Inspiration
AI and cloud usage is growing rapidly. Every day, new applications are built and shipped without much thought about how this invisible infrastructure impacts the environment. And the reason is because sustainability in the cloud is rarely treated as a first-class concern and many people don’t even realize it’s a real, measurable problem.
Most large tech companies publish sustainability reports as part of their compliance, but creating these reports is a painful, manual process. The required data is scattered across invoices, monitoring tools, and internal dashboards, often stitched together using spreadsheets. On top of that, the calculations depend on CO₂e and greenhouse gas emission formulas that the average engineer isn’t familiar with, which means producing these reports usually requires dedicated experts rather than the teams actually running the infrastructure.
Even worse, these reports arrive too late to be useful. They’re published at the end of the year, long after architectural decisions have been made and inefficient workloads have already run at scale. During the actual evaluation period, when changes could still be made, developers have no clear visibility into whether their key performance indicators (KPIs) are improving or worsening from a sustainability perspective.
What it does
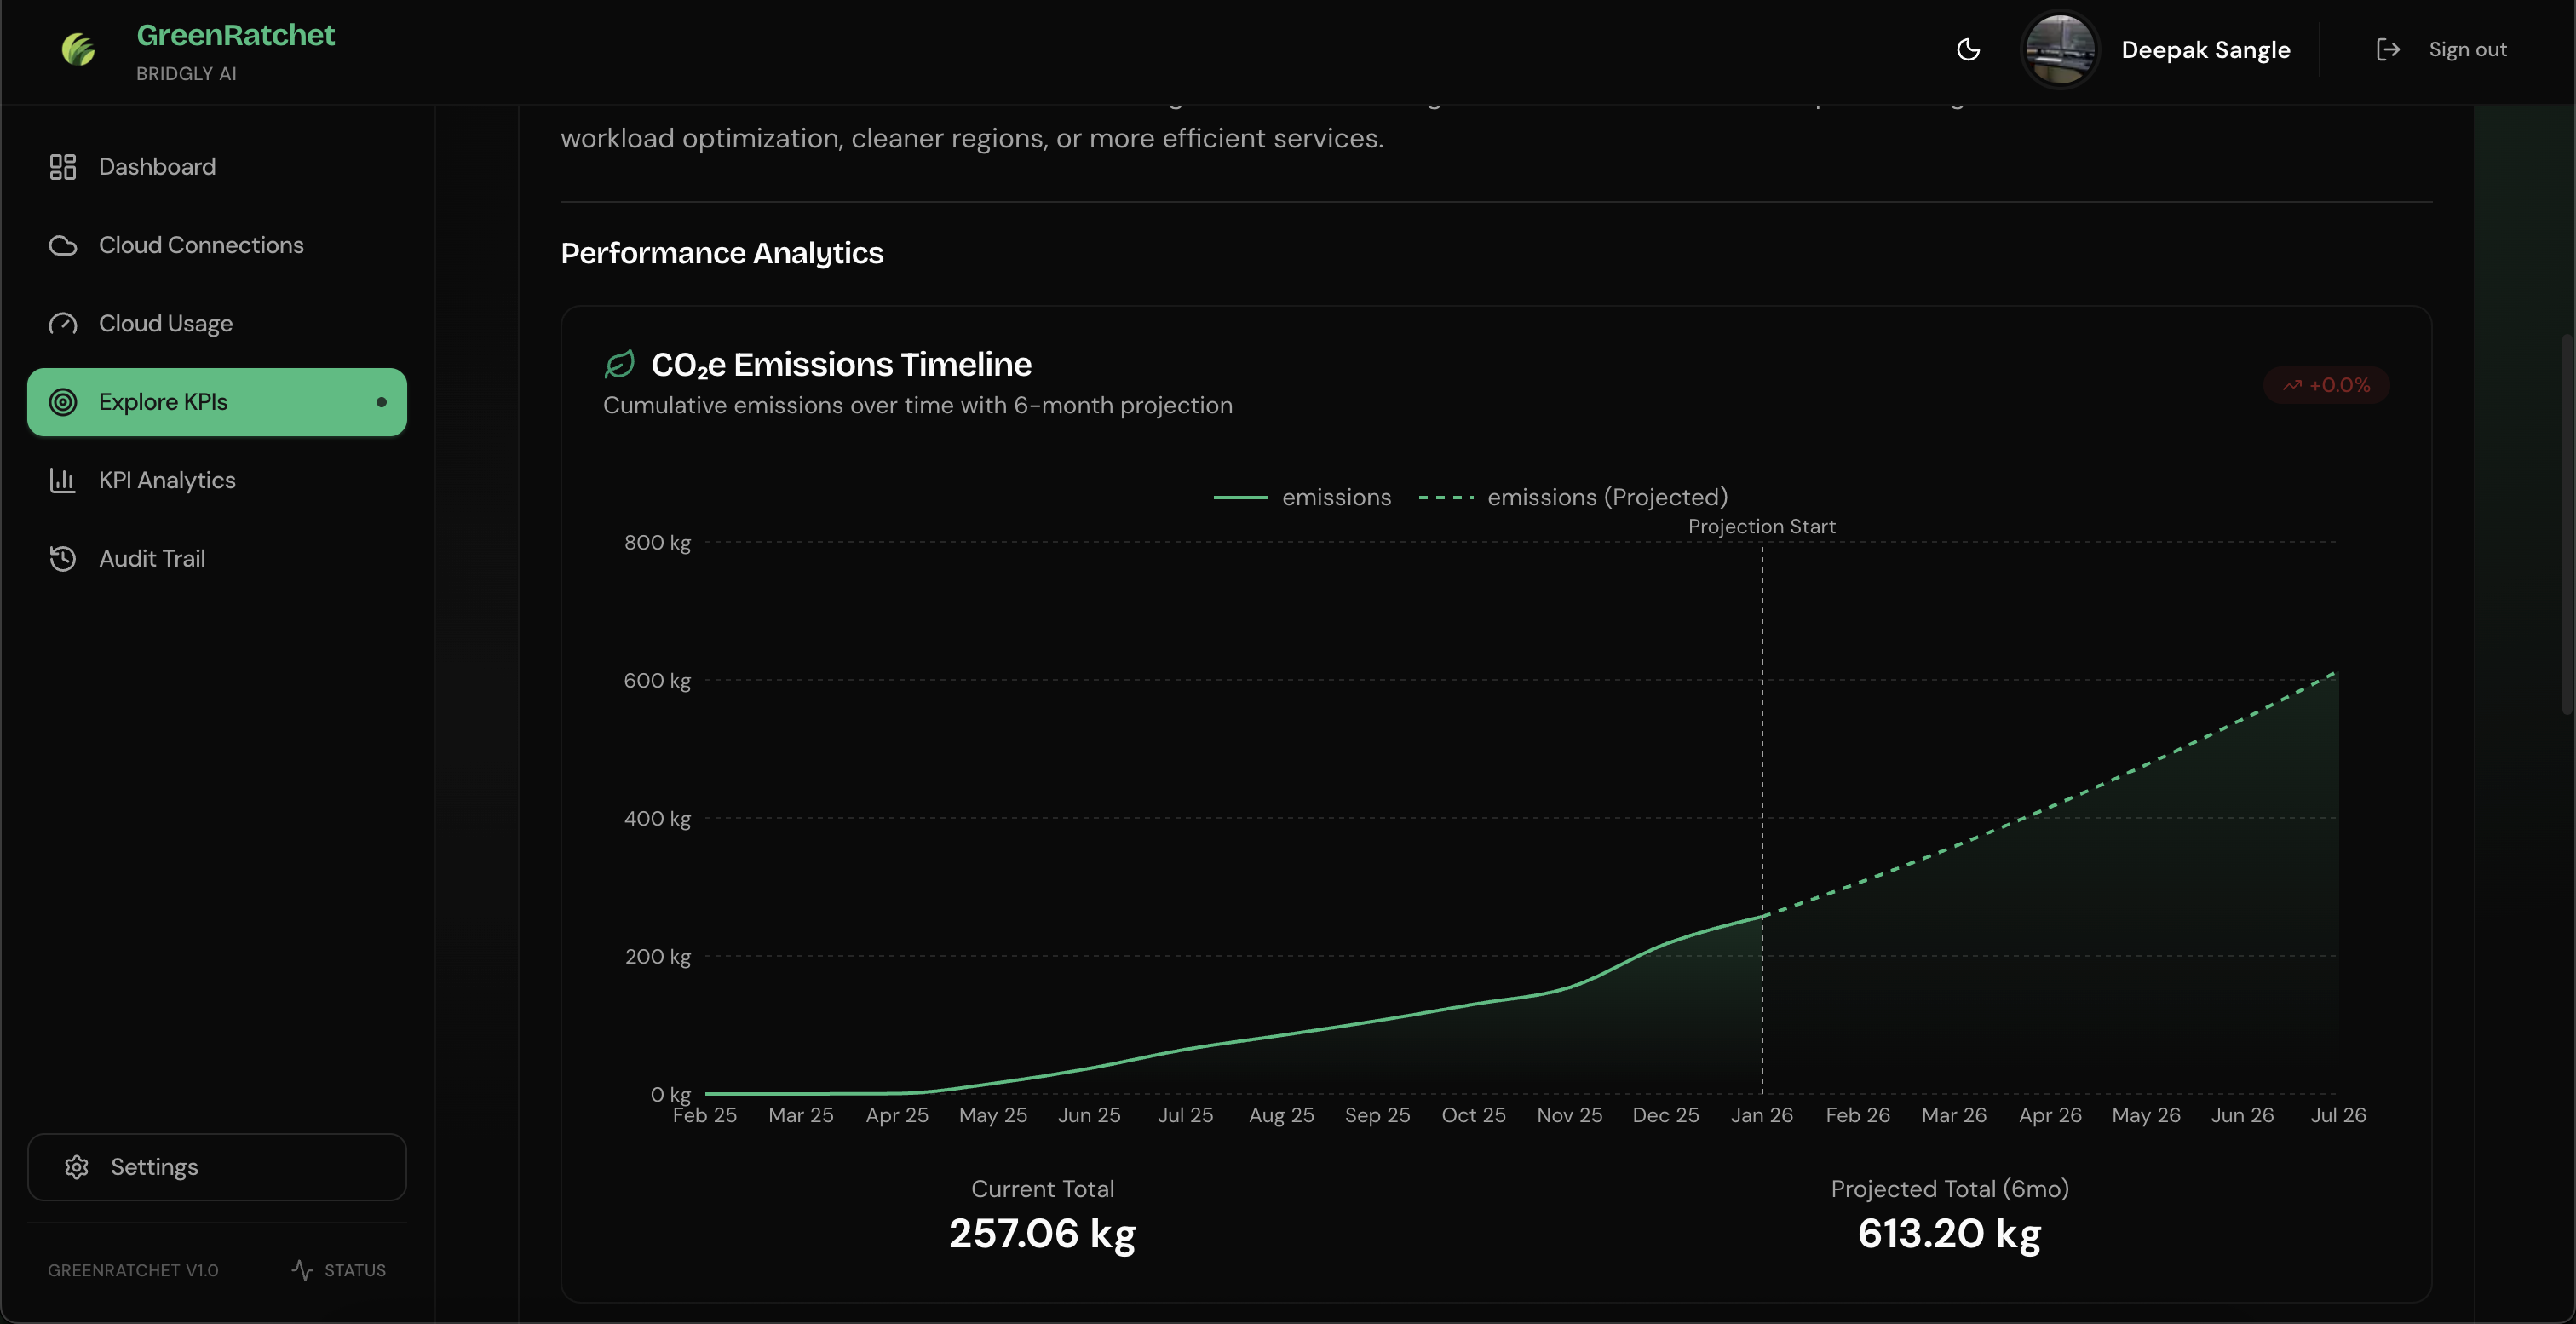
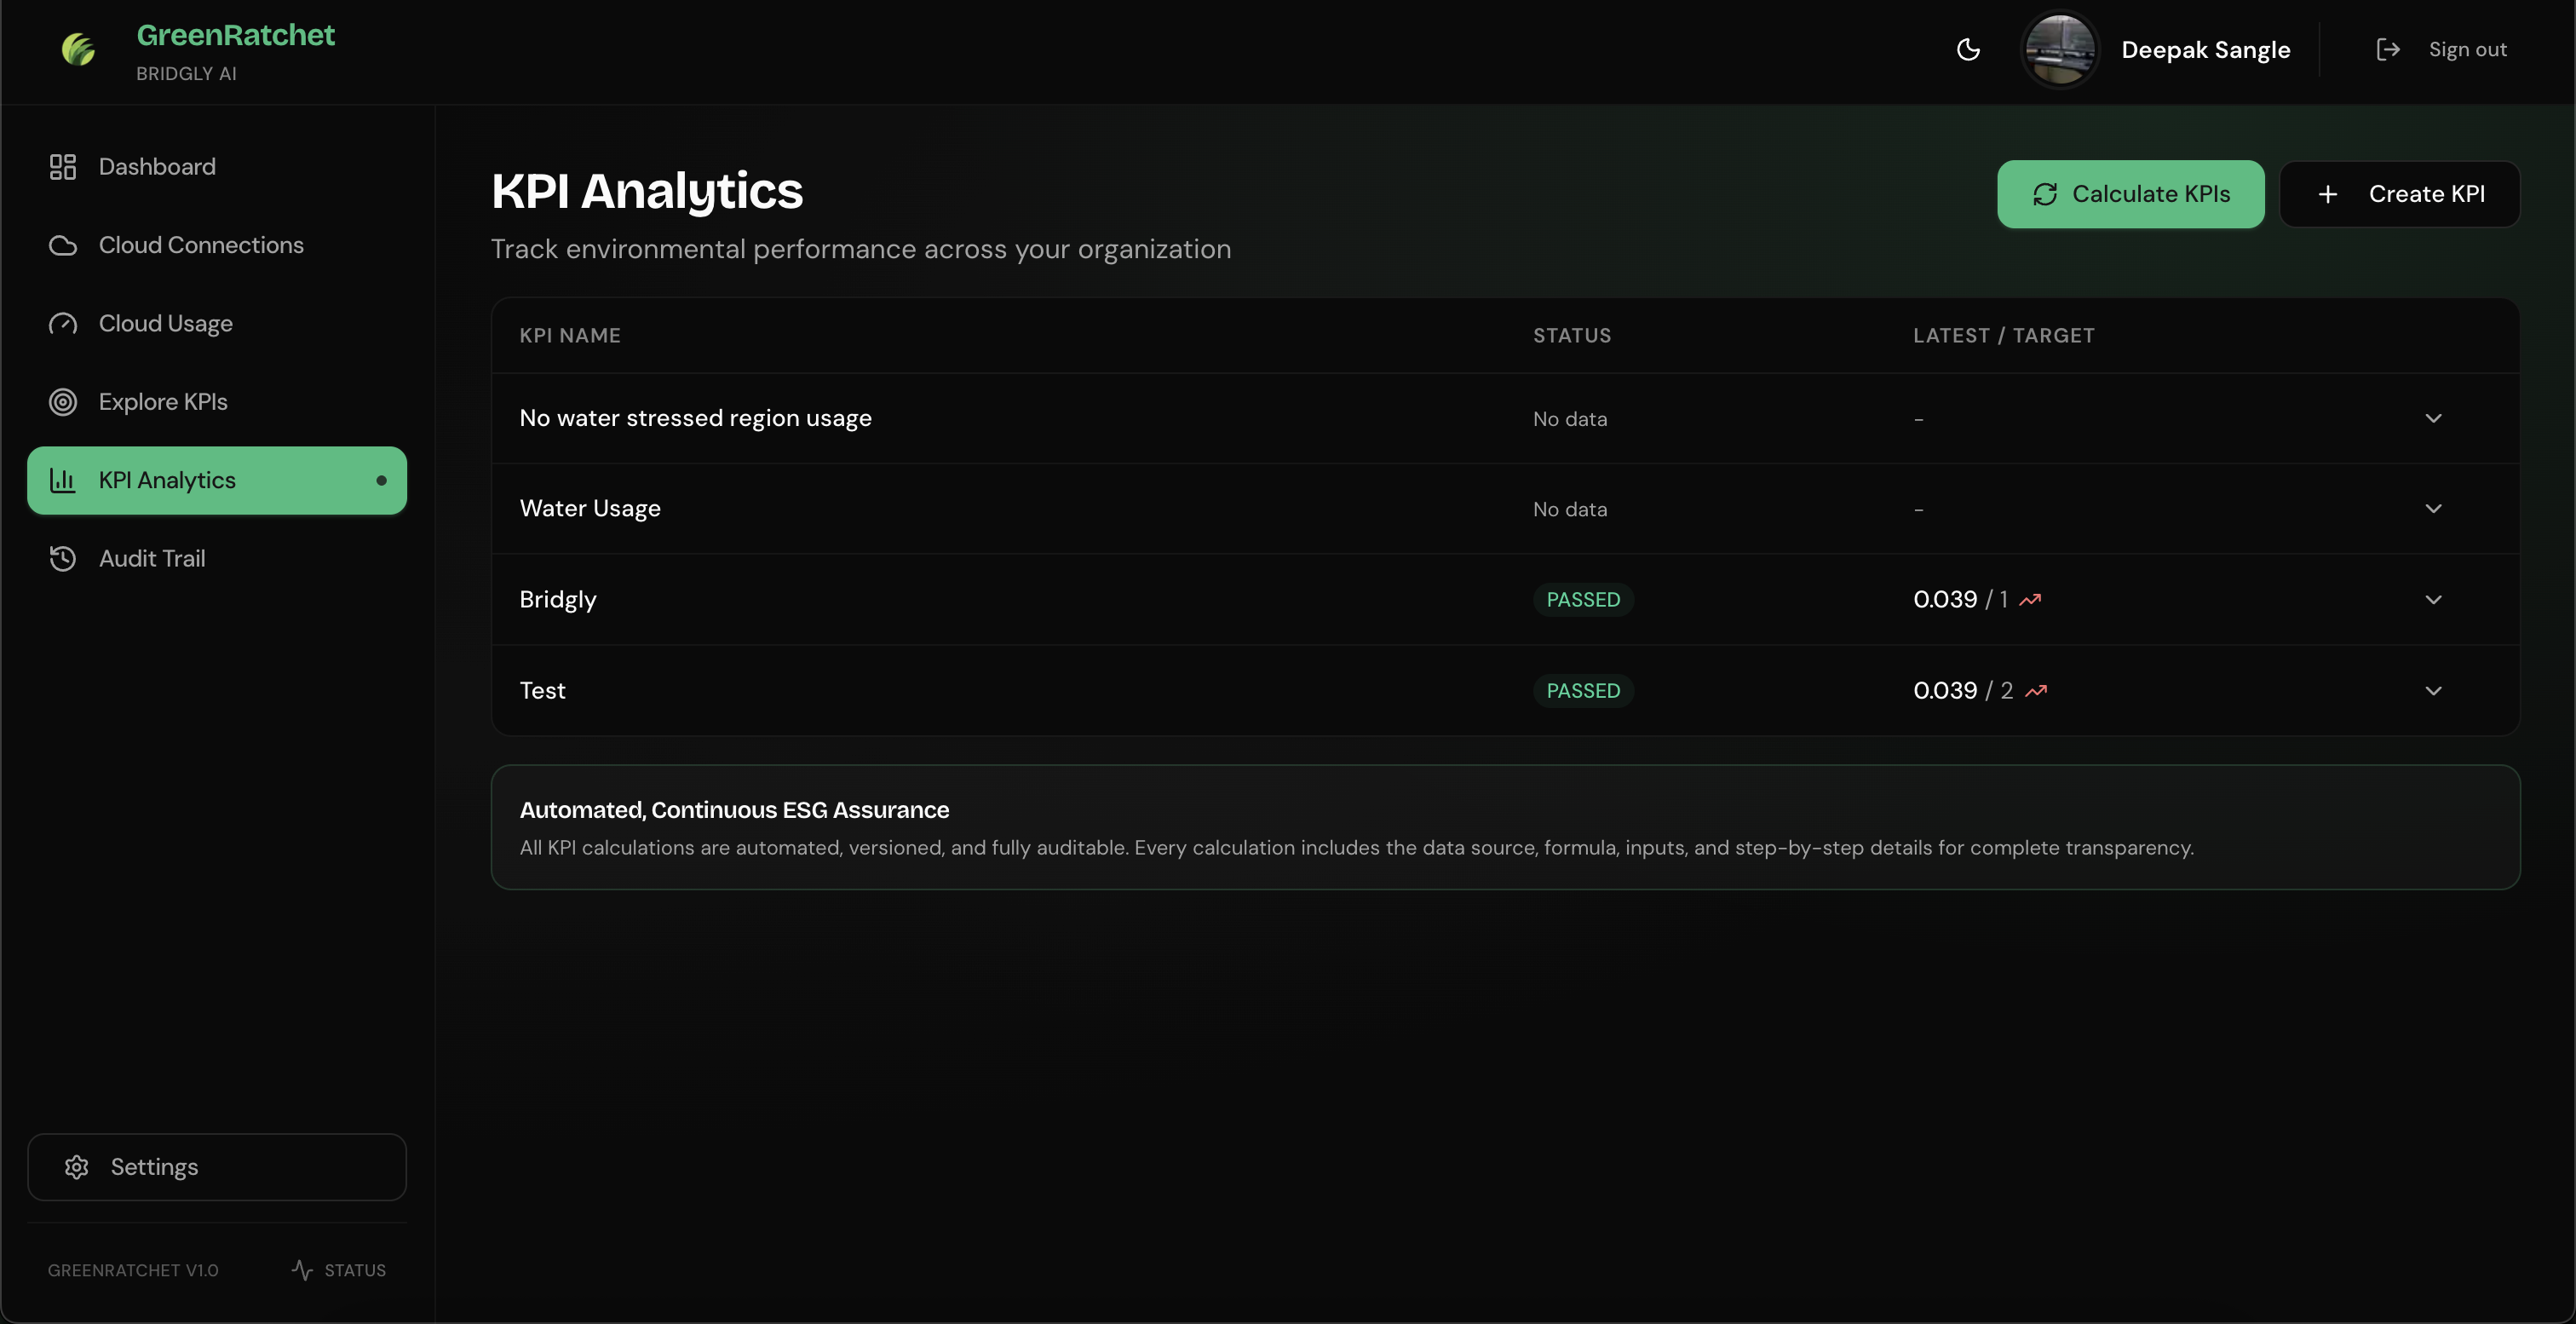
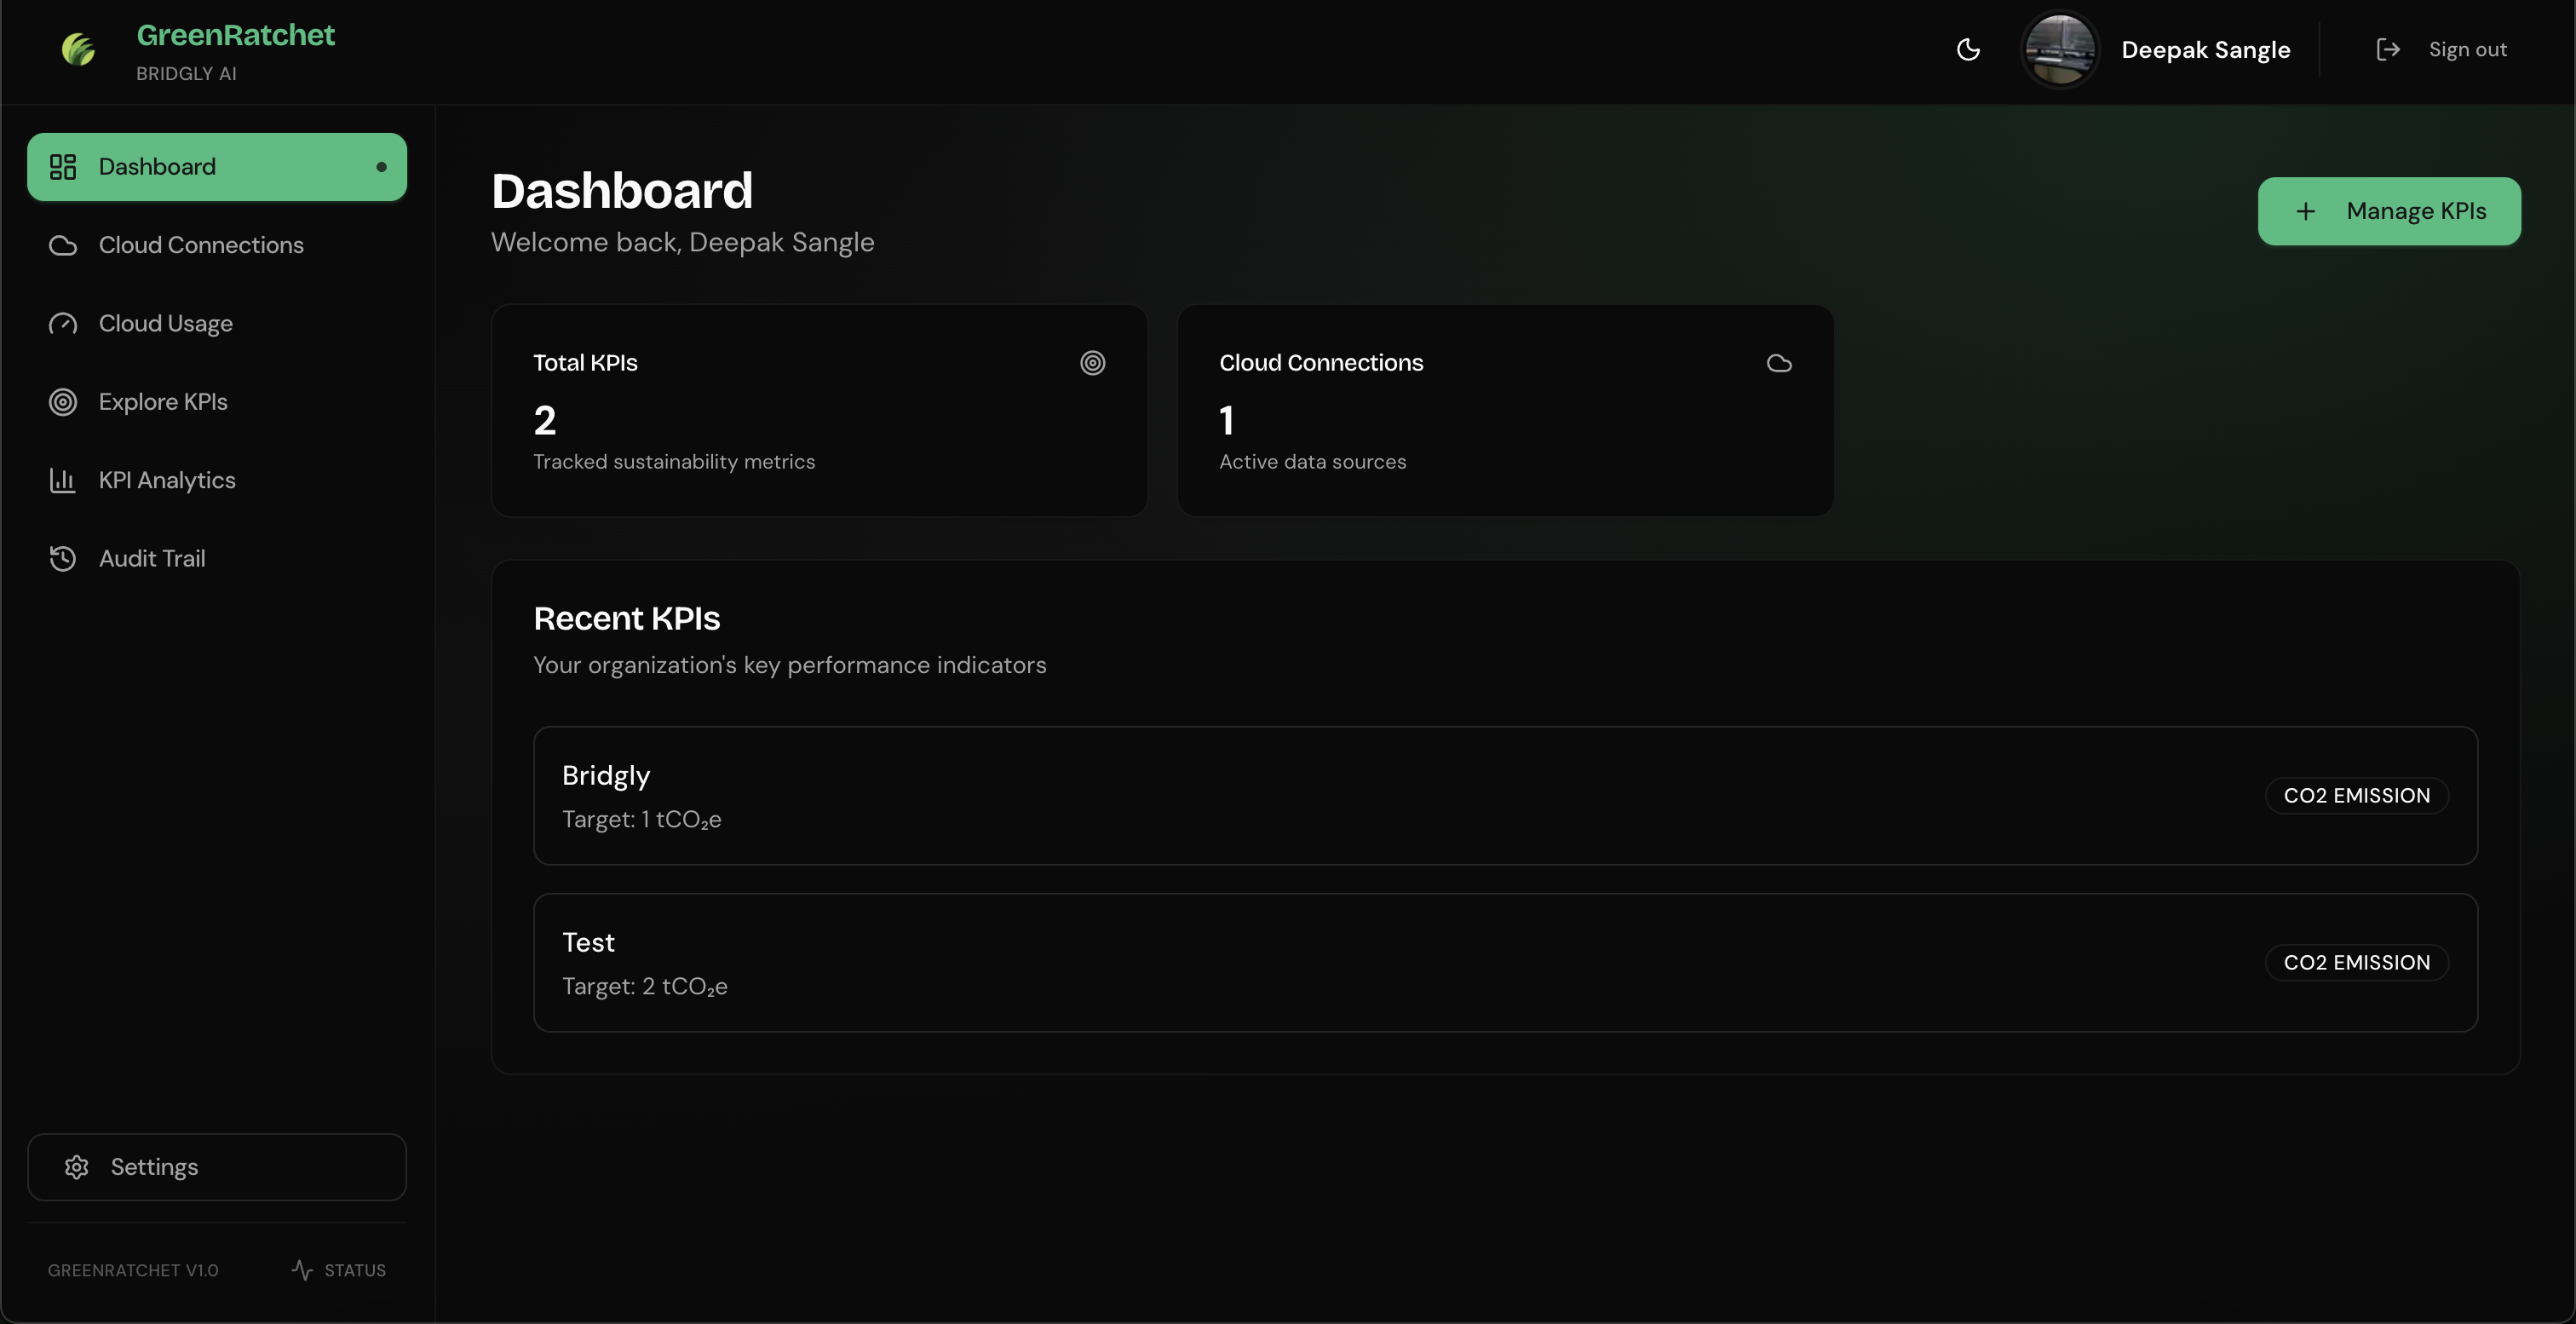
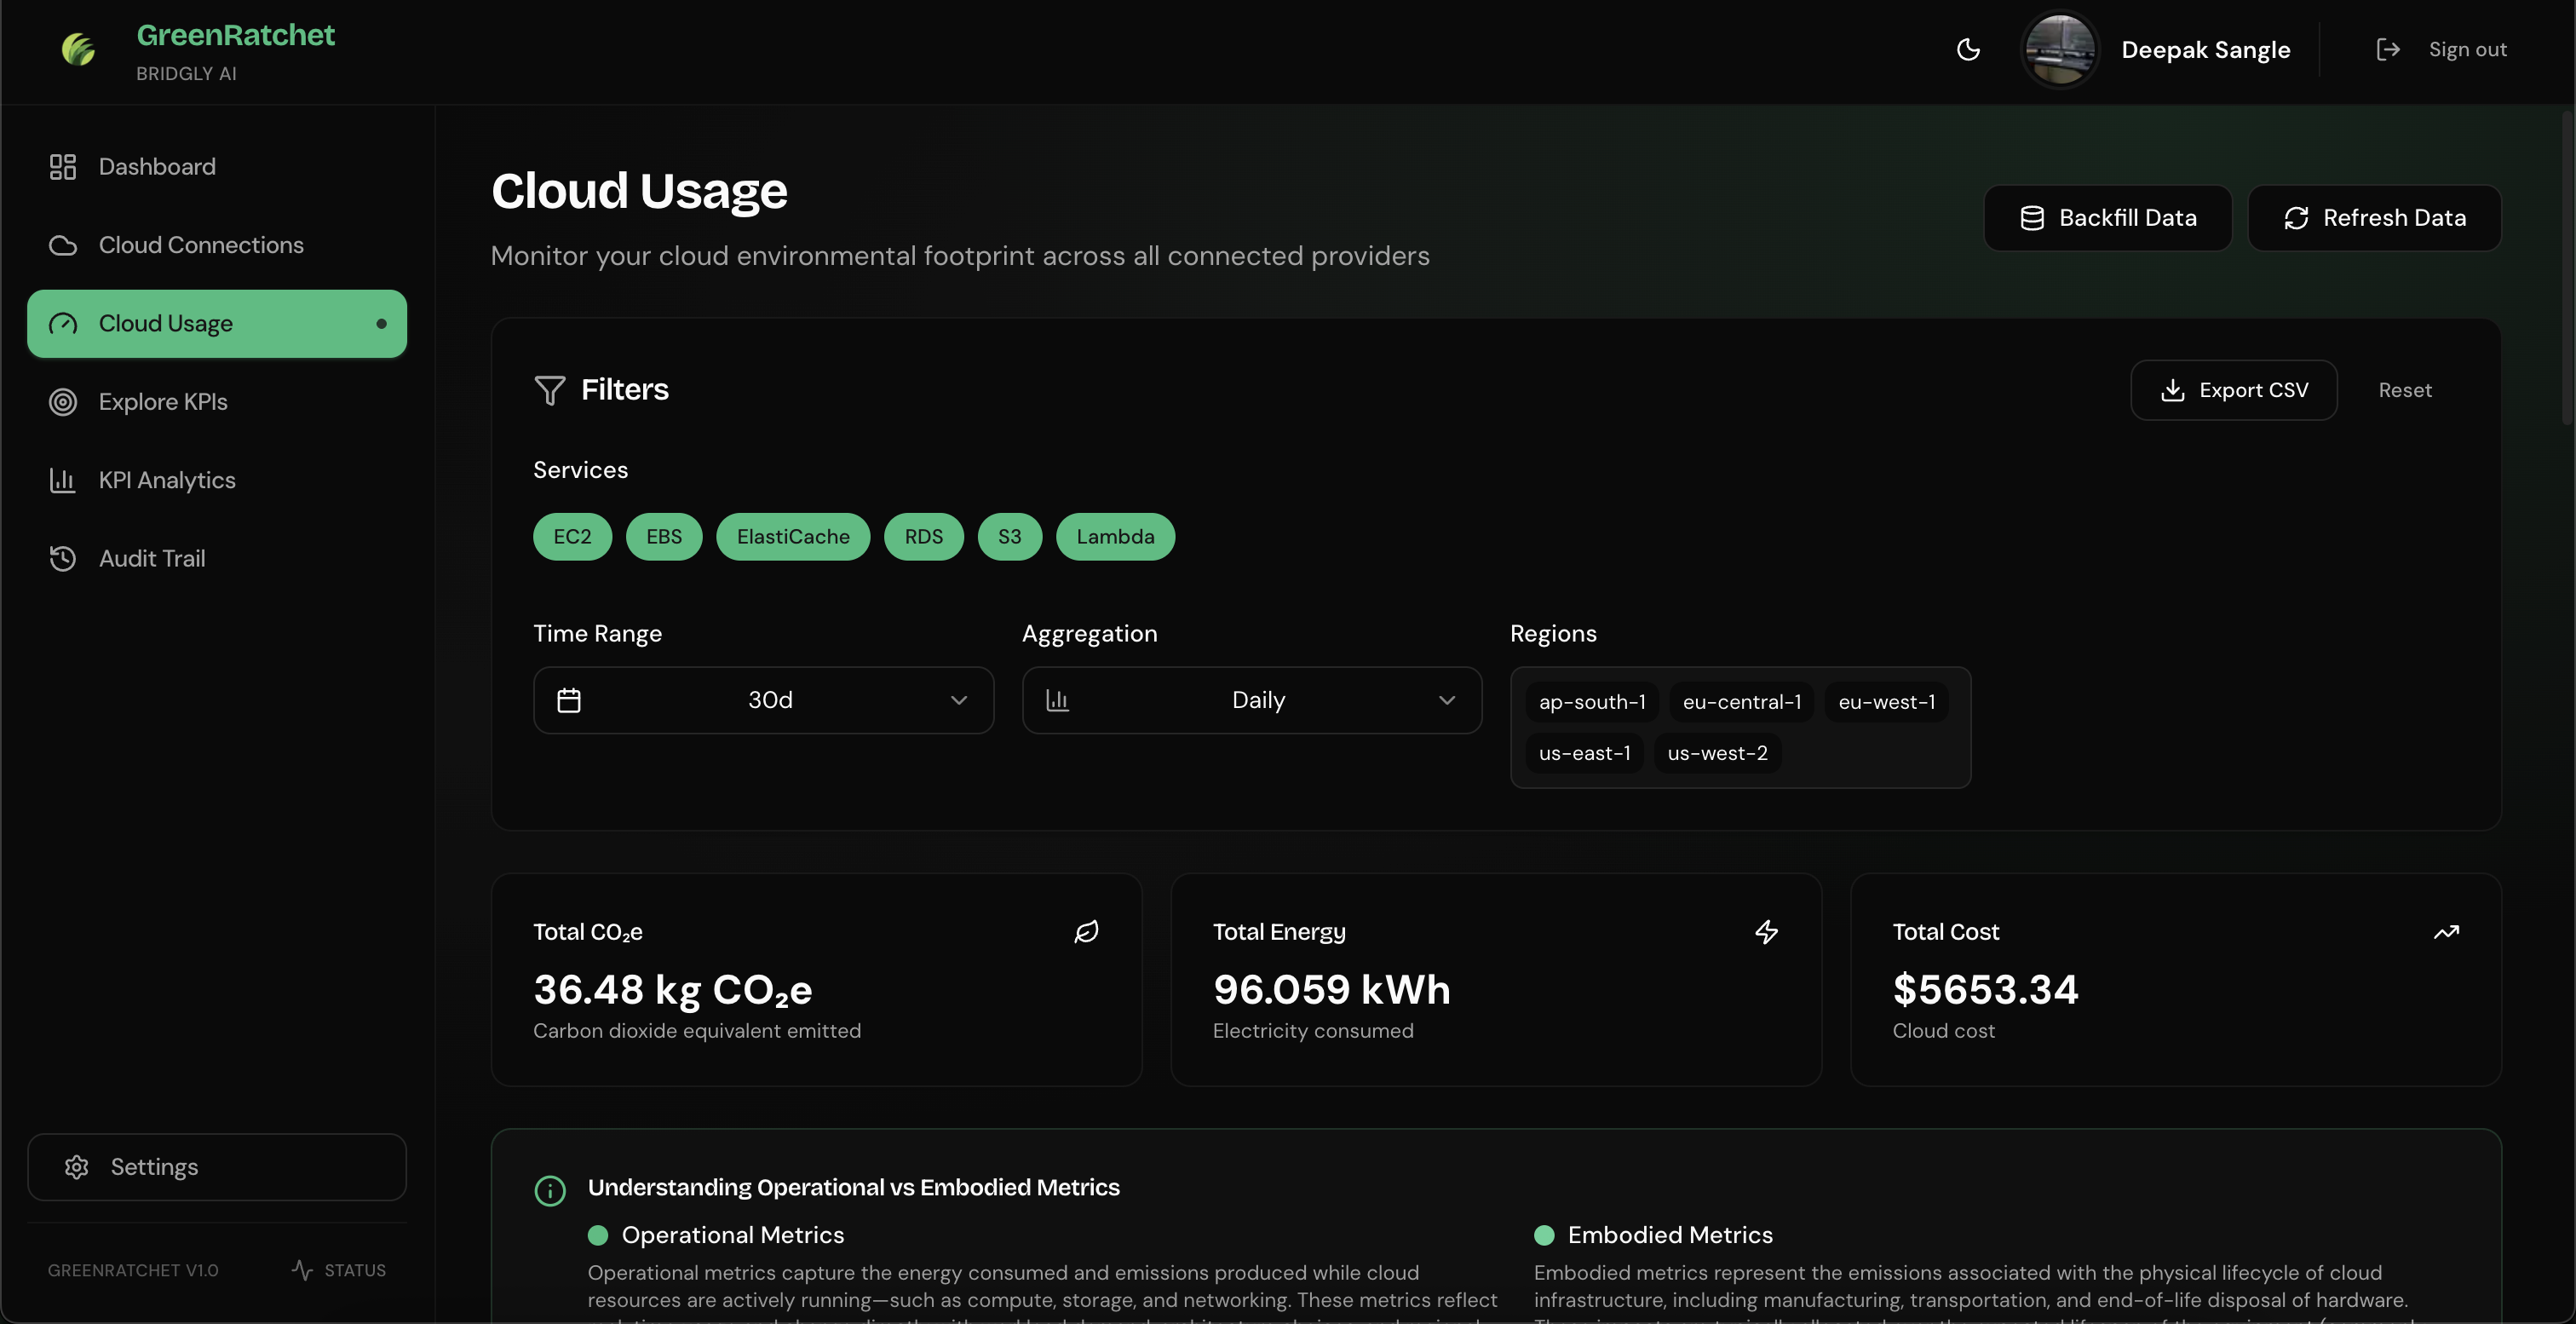
GreenRatchet automates cloud sustainability monitoring by integrating directly with cloud providers to track environmental metrics. It provides real-time KPI tracking, analytics, and reporting for organizations committed to reducing their cloud infrastructure's environmental footprint.
How we built it
- Frontend: Next.js 15 with App Router, TypeScript, Tailwind CSS
- Backend: Server Actions with Prisma ORM
- Database: PostgreSQL (Supabase)
- Auth: NextAuth.js v5
- UI: shadcn/ui components with lucide-react icons
- Charts: Recharts with dark mode support
- Validation: Zod schemas (auto-generated from Prisma)
💪 Challenges We Ran Into
Carbon Calculation Accuracy
The most challenging part was building services to fetch and calculate cloud usage data accurately. We explored multiple solutions including Cloud Carbon Footprint (open source), OxygenIT, Electricity Maps, Climatiq, and CO2 API. Each had limitations - some lacked free tiers, others had incomplete data. We spent significant time customizing the Cloud Carbon Footprint repository, but eventually hit walls. The challenge was that cloud usage extraction needs to be 100% correct, and we had to handle the unique characteristics of each AWS service.
Cloud Provider Integration Complexity
Implementing one-click AWS connection was unexpectedly challenging. The frontend and backend were straightforward, but making the actual connection work required a deep understanding of IAM roles, trust policies, and External IDs. After multiple approaches, we solved it using AWS CloudFormation stacks with pre-filled parameters.
Data Sourcing and Rate Limiting
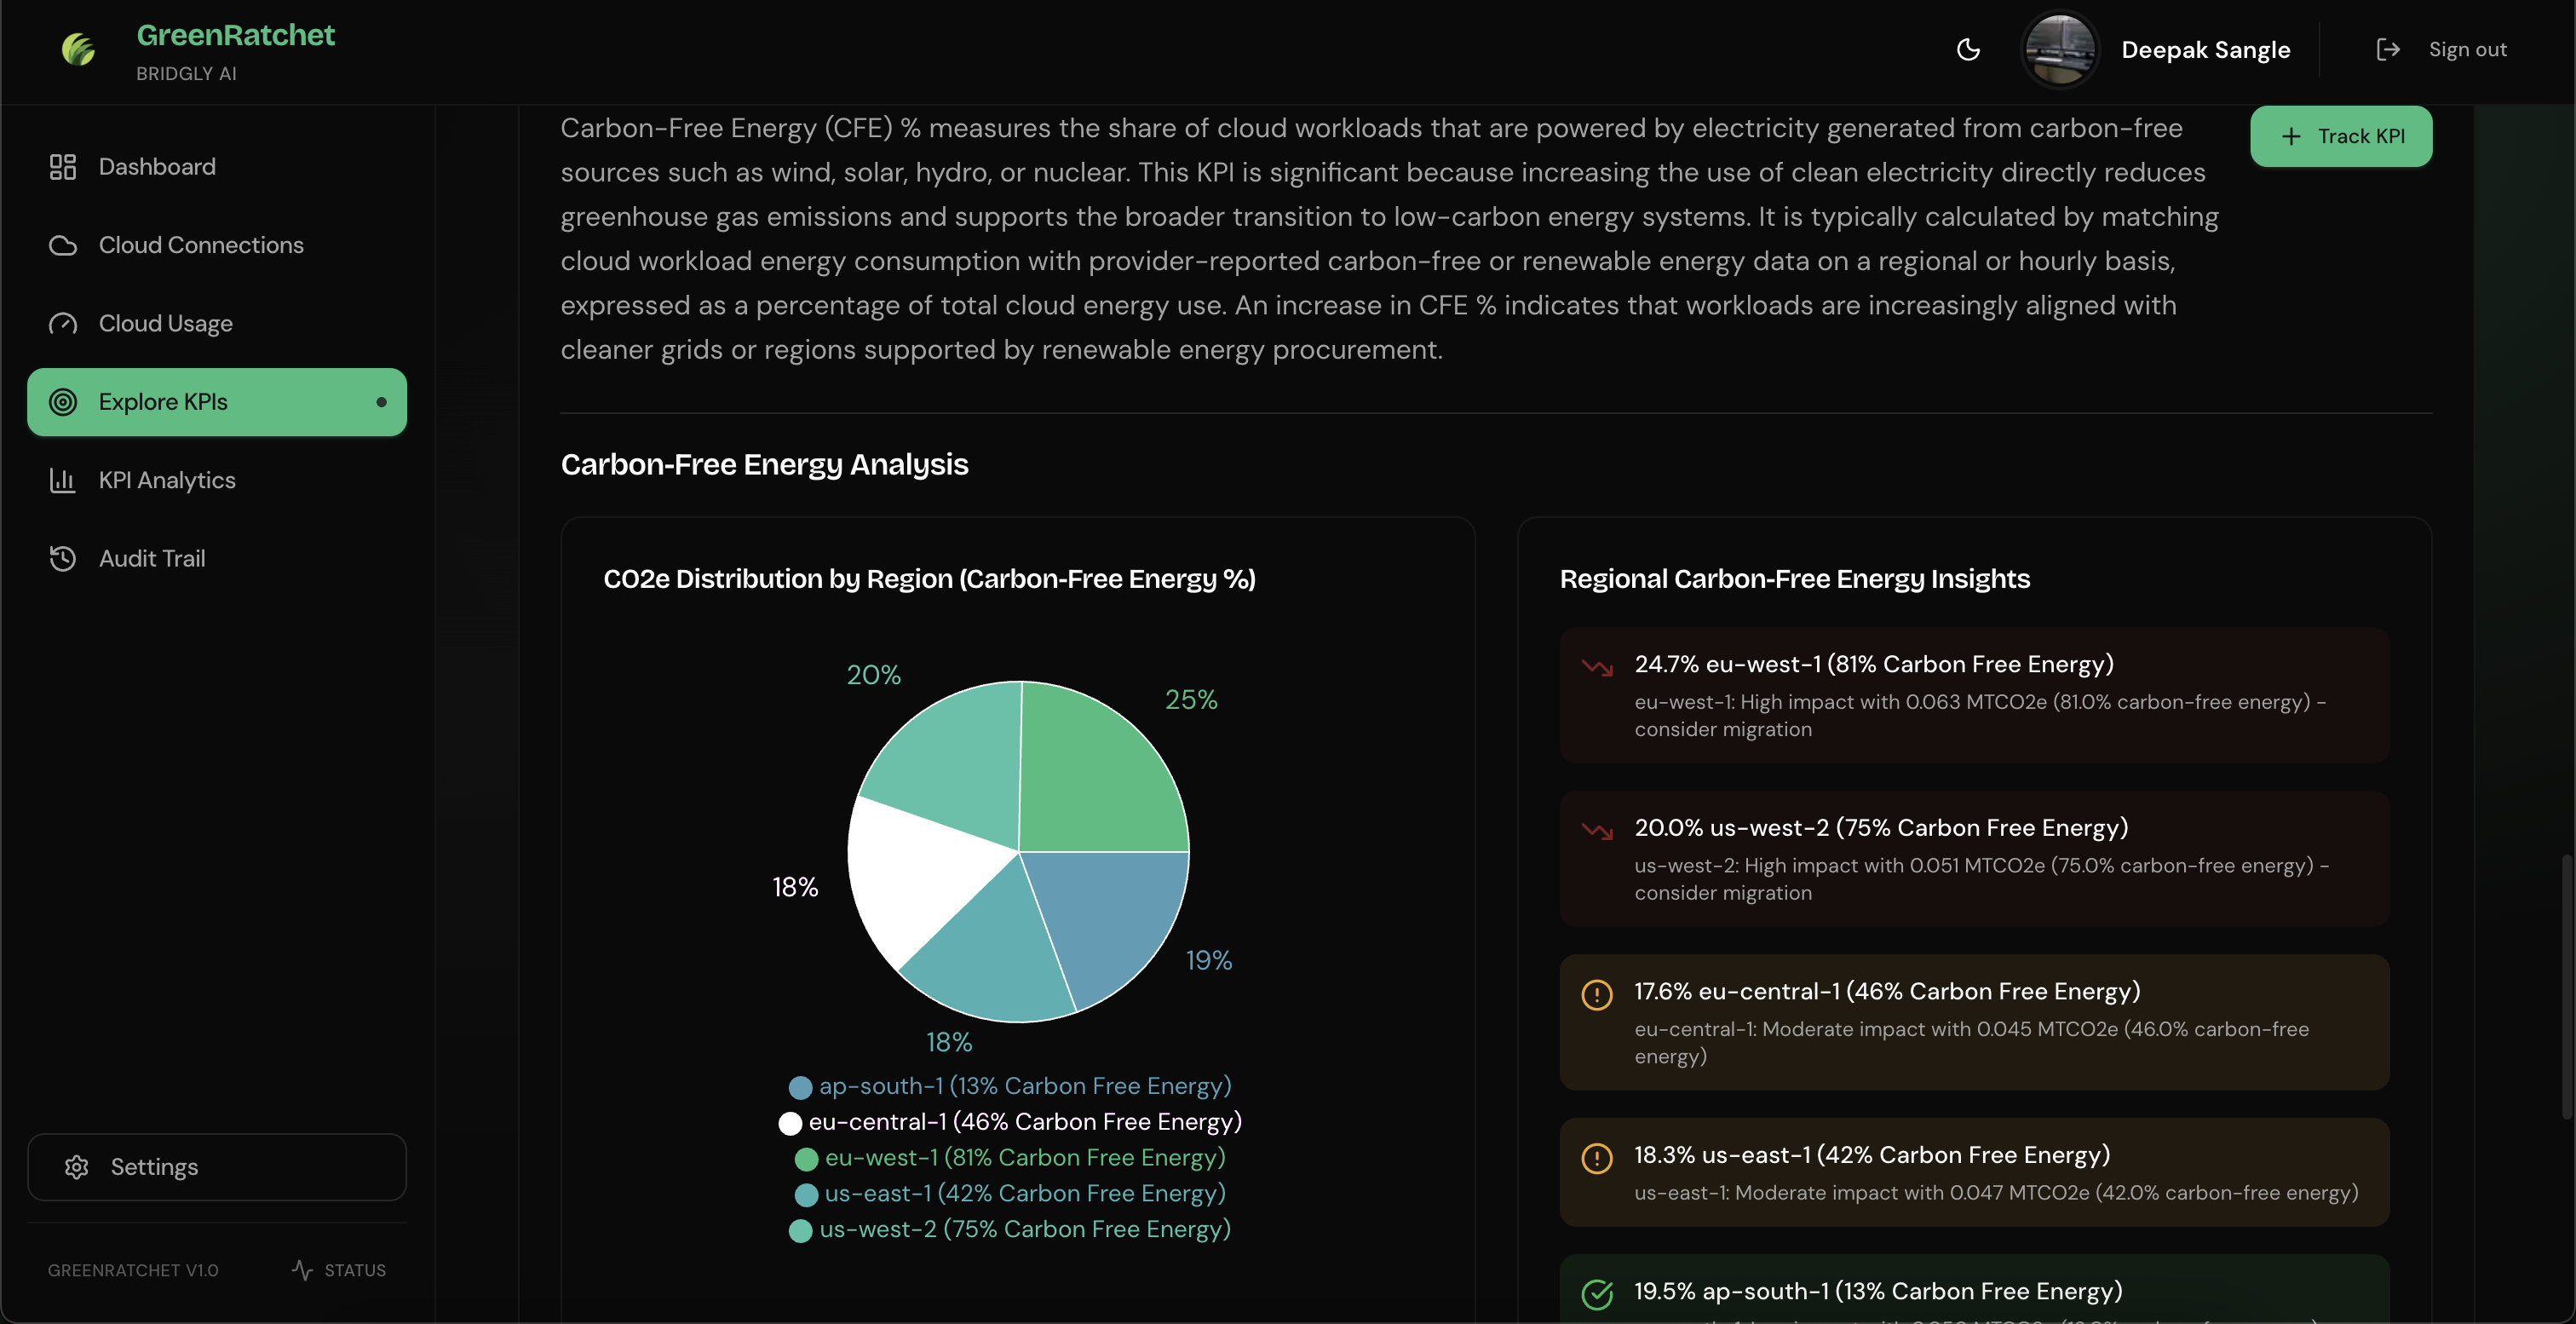
Finding reliable data for AWS's Power Usage Effectiveness (PUE) and Water Usage Effectiveness (WUE) was time-consuming. For metrics like Carbon-Free Energy %, Renewable Energy %, and Electricity Mix % at regional levels, we couldn't find reliable free sources. Integrating Electricity Maps solved this but introduced heavy rate limiting. We solved it by pre-fetching data, storing it in the database, and querying locally instead of hitting the API repeatedly.
🏆 Accomplishments That We're Proud Of
Complete End-to-End Solution
We built a production-ready platform that solves a real problem. From secure cloud provider connections to accurate carbon calculations to comprehensive audit trails - every piece works together seamlessly. Organizations can go from zero to full sustainability monitoring in minutes.
Industry-Standard Methodology
We implemented Etsy's Cloud Jewels approach - the gold standard for cloud carbon accounting. Our calculations include both operational emissions (energy consumption) and embodied emissions (hardware manufacturing), using real-time regional grid carbon intensity data. This level of rigor is rare in sustainability tools.
Enterprise-Grade Auditability
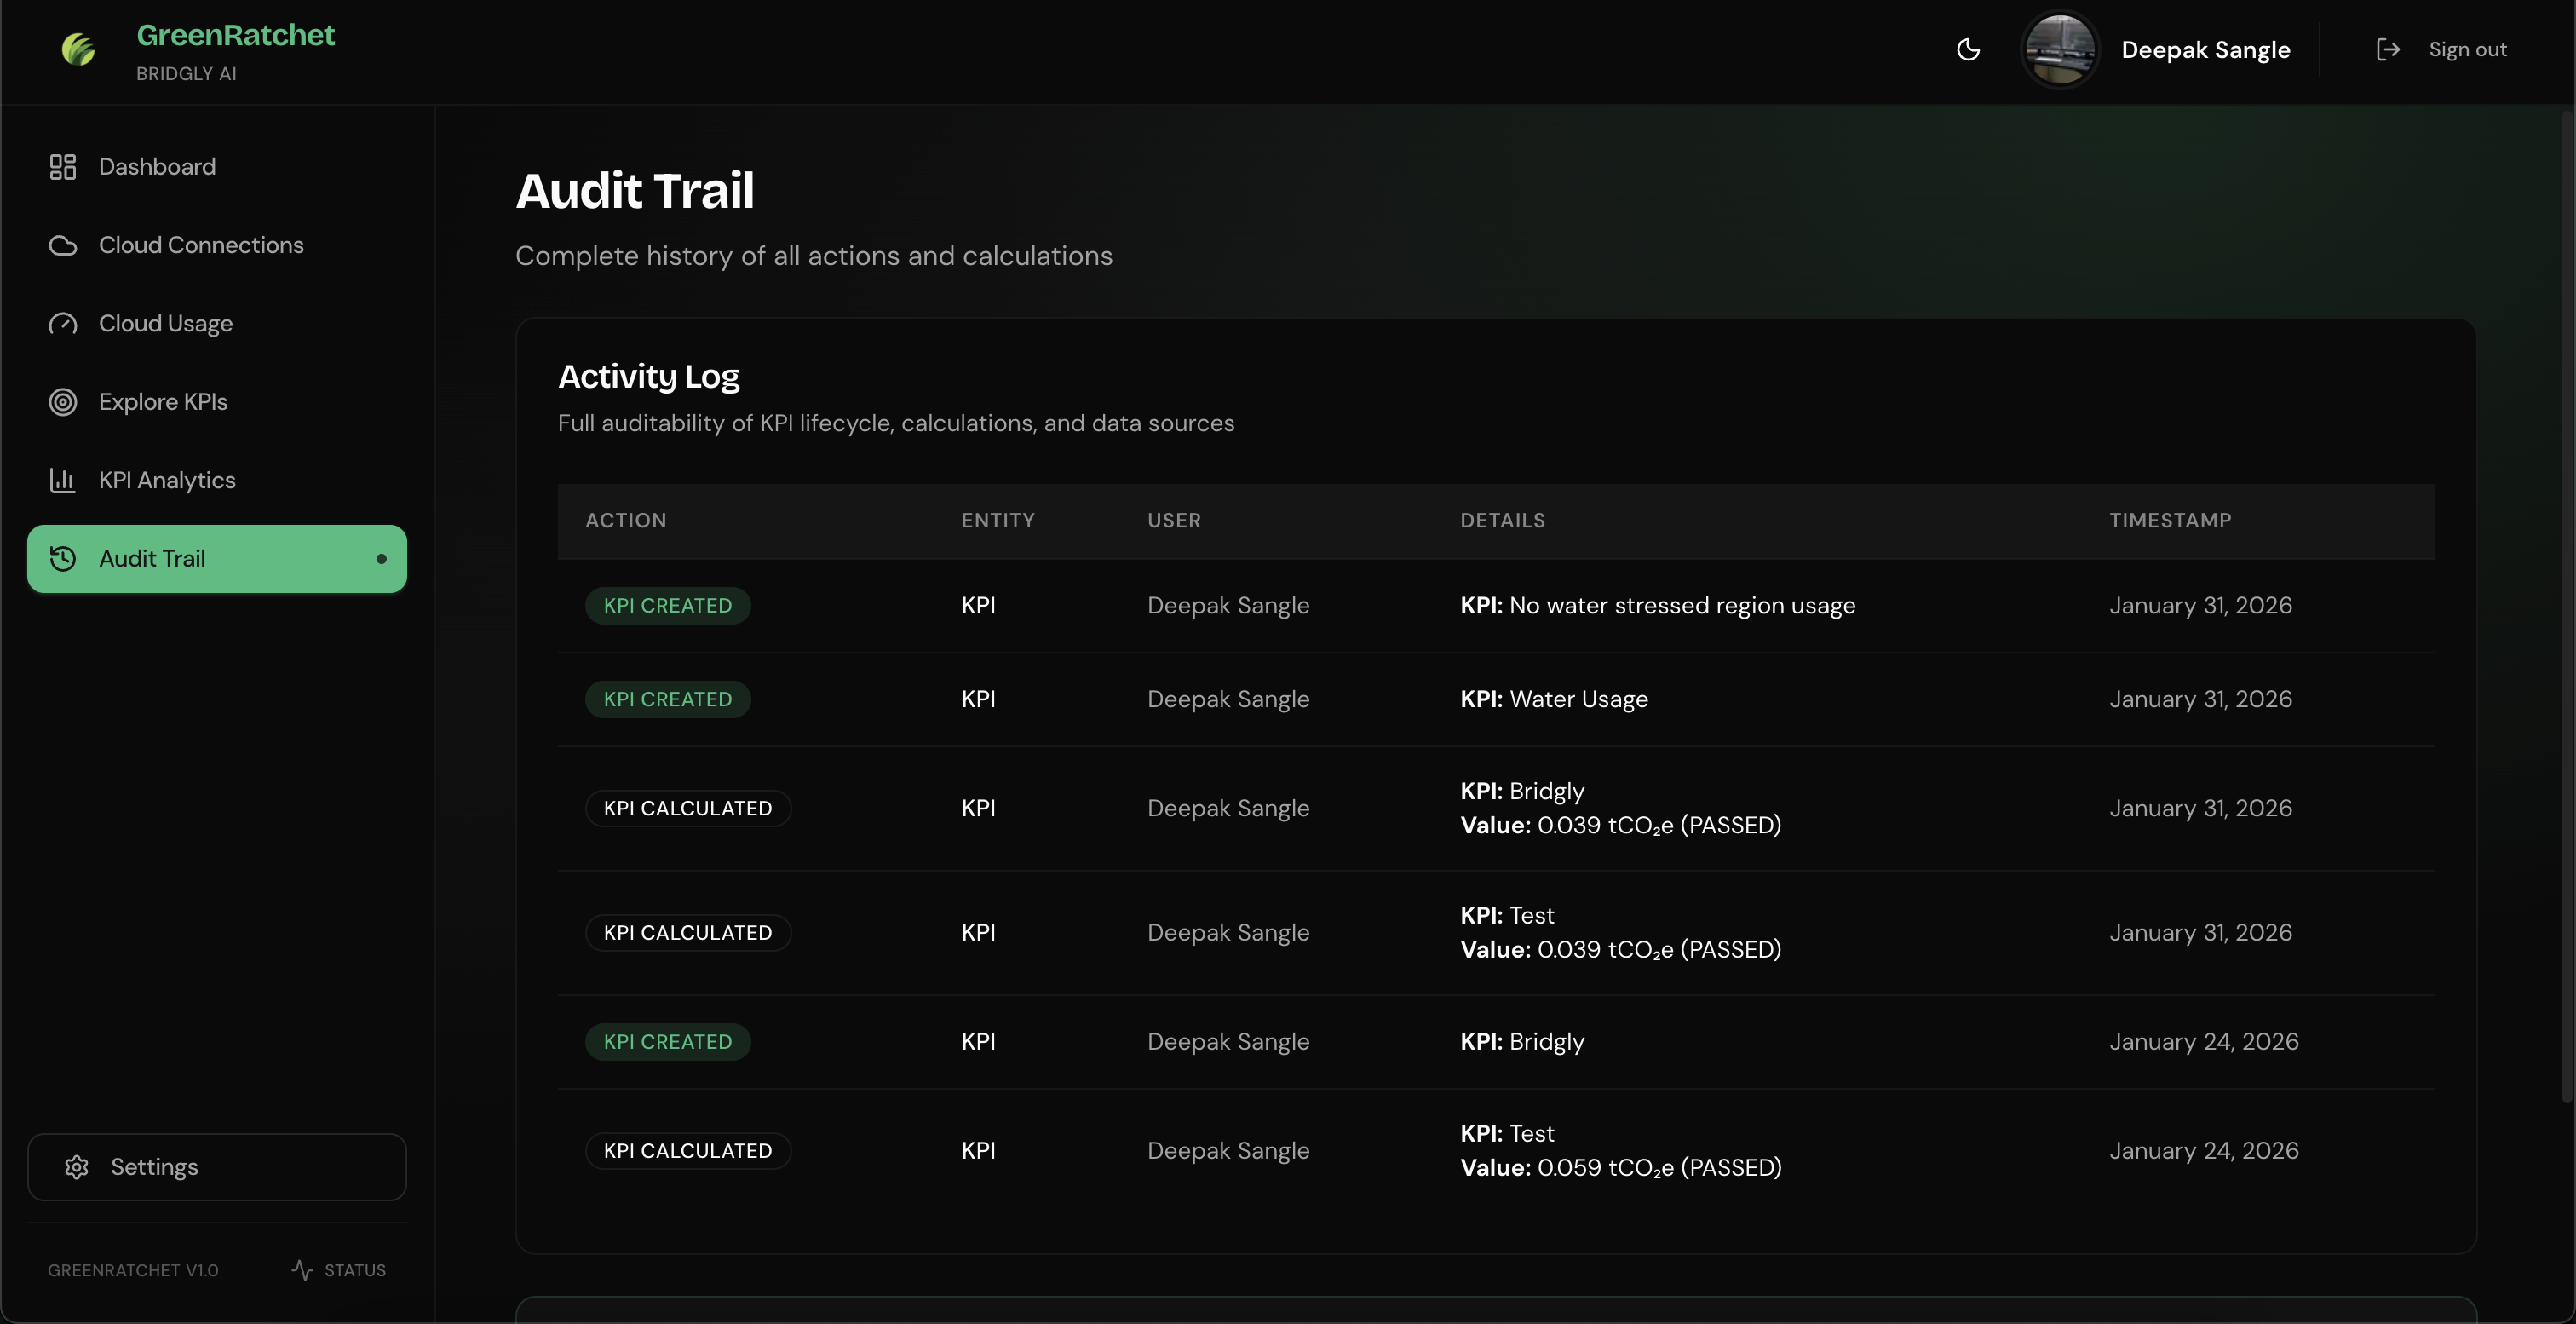
Every action in the system is logged with complete transparency. KPI calculations include the formula, data sources, input values, and step-by-step execution. This level of auditability is essential for ESG compliance and stakeholder reporting, and it's built into the platform's core.
📖 What We Learned
Cloud Carbon Accounting is Complex
We learned that accurate cloud carbon accounting requires a deep understanding of multiple domains: cloud infrastructure, energy systems, grid carbon intensity, hardware manufacturing emissions, and regional variations. There's no simple formula - it requires combining data from multiple sources and applying sophisticated methodologies.
Data Quality is Critical
The accuracy of sustainability metrics depends entirely on data quality. We learned to validate data sources, handle missing data gracefully, and provide transparency about calculation methods. Users need to trust the numbers, which means showing exactly how they were calculated.
Security and Compliance are Non-Negotiable
For enterprise adoption, security and auditability aren't optional features - they're requirements. We learned to implement proper IAM role-based authentication, use External IDs for security, provide read-only access, and log every action with complete transparency.
🚀 What's Next for GreenRatchet
Multi-Cloud Expansion
Complete GCP and Azure integration to provide true multi-cloud sustainability monitoring. Organizations often use multiple cloud providers, and they need unified visibility across all of them.
Advanced Optimization Recommendations
Build an AI-powered recommendation engine that analyzes usage patterns and suggests specific optimizations: instance type changes, region migrations, workload scheduling, and architectural improvements. Move from "here's your data" to "here's exactly what to do."
Automated Reporting
Generate compliance-ready sustainability reports automatically - PDF exports, stakeholder presentations, ESG disclosures. Include year-over-year comparisons, progress tracking, and benchmark data against industry standards.
Built With
- nextjs
- postgresql
- prisma
- react
- rechart
- supabase
Log in or sign up for Devpost to join the conversation.