Inspiration
We were inspired by the 11th goal of the 17 goals for sustainable development of the UN : Sustainable Cities and Communities. And after looking at the EPFL objectives, we saw that our project also fall under the EPFL obejctive of Resilient Campuses.
What it does
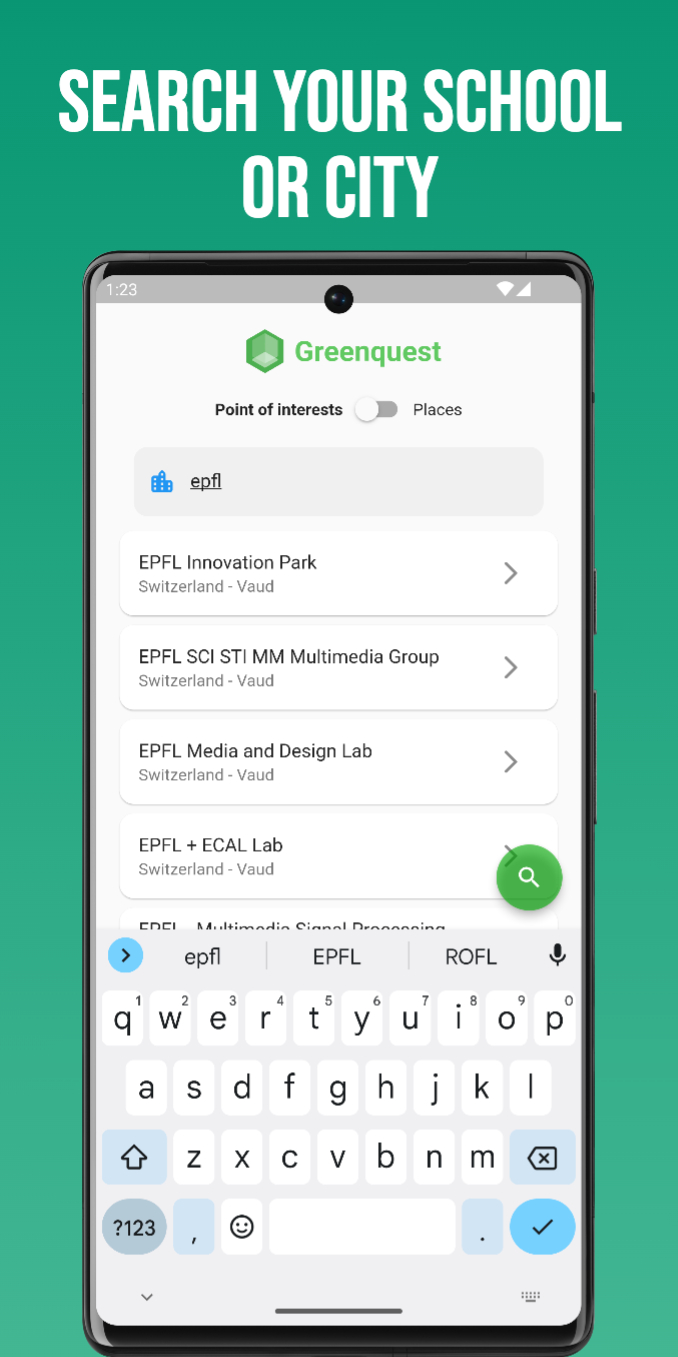
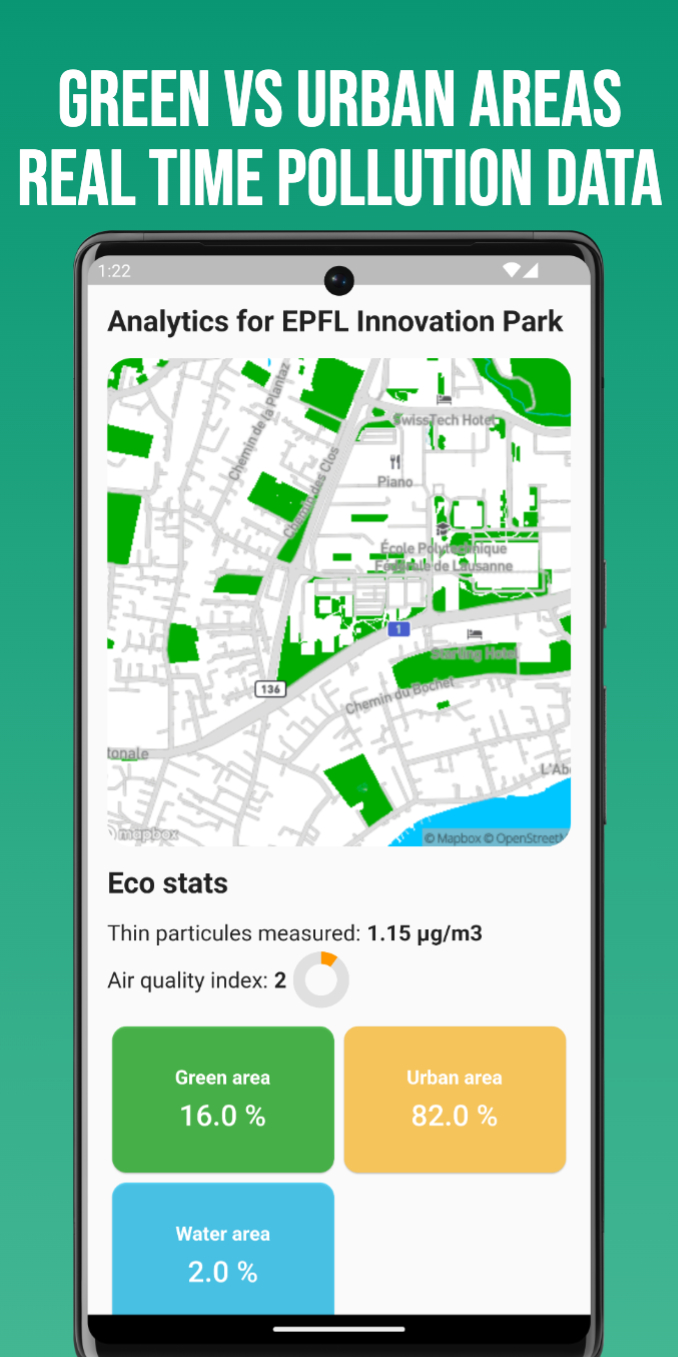
We let you search through all the cities or places you want and give you some stats on the proportion of the different types of areas : Green Spaces, Urban Spaces, Water Spaces using an oftenly updated map and also show the pollution of the city.
How we built it
Front-end : Flutter
Back-end : Firebase Cloud Functions
Maps : Mapbox
Other APIs : OpenWeatherMap (pollution data)
Challenges we ran into
Getting the percentage of green / urban / water areas for an area seemed like a really simple task. And we thought it would take only a small amount of time with the tools we have available today. But it turned out to be way more difficult then expected.
We tested various ways (Tensorflow, "manual" iteration on all pixel and then classifying with their RGB) and had really bad results with each one, the best we found and used was google cloud vision. And we still have some big isssues with it sometimes for reasons we still didn't manage to understand.
Accomplishments that we're proud of
Coming up with a fully functionnal project in just 24 hours (23 hours actually 😉) and being only 2 in the team. We are also really proud of the fact that the whole project can be uploaded online fast and is highly scalable. Those are the benefits of using Flutter, Firebase Cloud Functions, the last having only one limit : your credit card limit😝.
What we learned
We learned a lot on the google cloud functions as we did a lot of that but also color recognition, and we understood that image processing isn't as easy at it looks 🙃.
What's next for GreenQuest
We'll for sure try to continue to work on this interesting project after this hackaton !


Log in or sign up for Devpost to join the conversation.