Inspiration
Cities generate over 70% of global CO₂ emissions, yet urban carbon flows remain invisible. Planners rely on static maps and spreadsheets, making it hard to understand how emissions move through complex city systems. We wanted to visualize the dynamic, invisible rivers of carbon—from roads to rooftops, and parks to power plants. By turning CO₂ into an interactive, real-time 3D experience, we hope to empower climate action and smarter urban design.
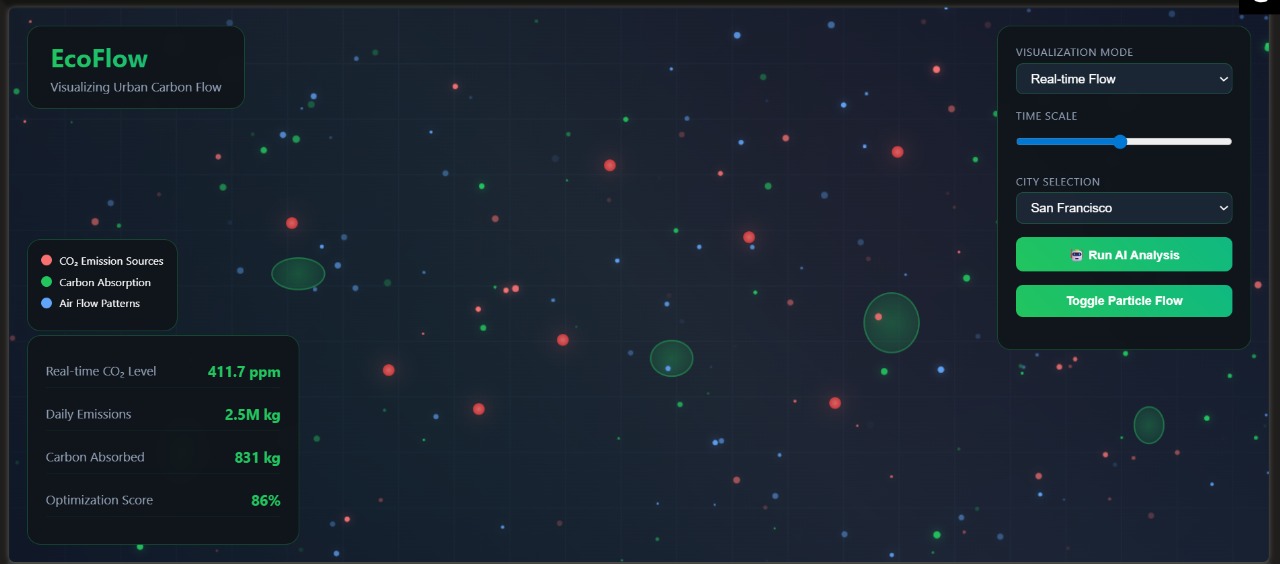
What it does
EcoFlow is a web-based, AI-powered platform that visualizes real-time carbon flow patterns across cities using 3D particle animations over Google Maps. It:
Shows CO₂ emission and absorption dynamics in a city using real-time data and ML modeling
Identifies emission hotspots and recommends optimal locations for green infrastructure (trees, parks, green roofs)
Allows users to explore seasonal carbon flow changes via an animated time-lapse
Offers a gamified "Community Impact Scoring" system to encourage public participation
Provides a developer API for integration into urban planning tools or sustainability research
How we built it
Tech Stack:
Frontend: React.js, Maps JavaScript API, WebGL, Three.js, D3.js
AI Modeling: TensorFlow.js (for real-time CO₂ flow prediction)
Geospatial Data: Google Earth Engine (NDVI, heat island data), Places API, Routes API
Infrastructure: Node.js/Express (API backend), Firebase (real-time database), Vercel (deployment)
We fused satellite data, weather APIs, and IoT sensors to create a live carbon model. WebGL shaders rendered immersive 3D particles that flow based on emission vectors, traffic, and weather patterns.
Challenges we ran into
Rendering performance: Smooth animation of thousands of particles on mobile was challenging. We optimized with GPU shaders and data throttling.
Data integration: Merging diverse real-time data sources (weather, sensors, satellite) into a single coherent model took significant preprocessing.
Model calibration: With limited ground-truth CO₂ data, we had to make trade-offs between accuracy and generalization.
Cross-device compatibility: Ensuring WebGL and shader behavior across browsers was time-consuming.
Accomplishments that we're proud of
Successfully built a live, browser-based carbon flow simulation that runs on consumer hardware
Developed an intuitive interface that merges complex geospatial science with user-friendly visuals
Designed an open API for researchers, students, and city planners
Turned abstract CO₂ data into an emotionally resonant and actionable experience for users
What we learned
Environmental data needs storytelling to drive public engagement
Edge AI (TensorFlow.js) can handle surprisingly complex models when optimized properly
Maps are not just tools—they can be canvases for change, especially when layered with real-time visuals
Community features (like impact scoring) can turn passive viewers into active problem-solvers
What's next for EcoFlow
AR Experience: Overlay CO₂ flows through your phone camera while walking through a city
City Comparison Mode: Analyze two cities side by side for emissions and green coverage
Carbon Credit Marketplace: Connect green proposals to offset markets for funding
City Planning Integration: Offer plugins for GIS and government planning platforms
Open Source SDK: Let others build on EcoFlow’s carbon engine for new regions and research
Built With
- express.js
- firebase
- google-3d-tiles-api
- google-earth-engine
- google-maps-javascript-api
- google-places
- google-routes-api
- javascript
- node.js
- react
- react.js
- tensorflow.js
- three.js
- vercel
- webgl

Log in or sign up for Devpost to join the conversation.