-
-
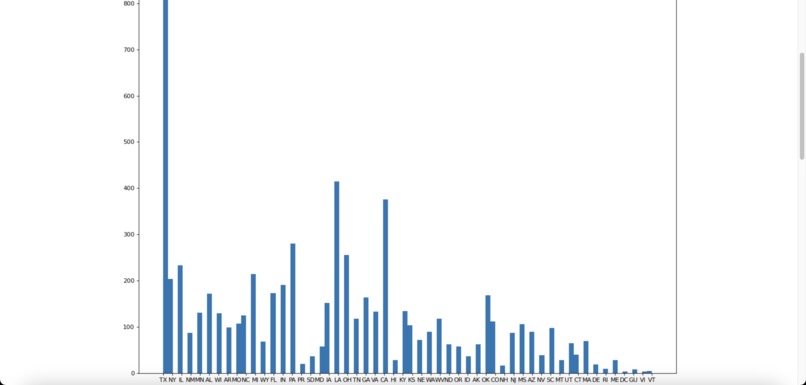
Analytics 1
-
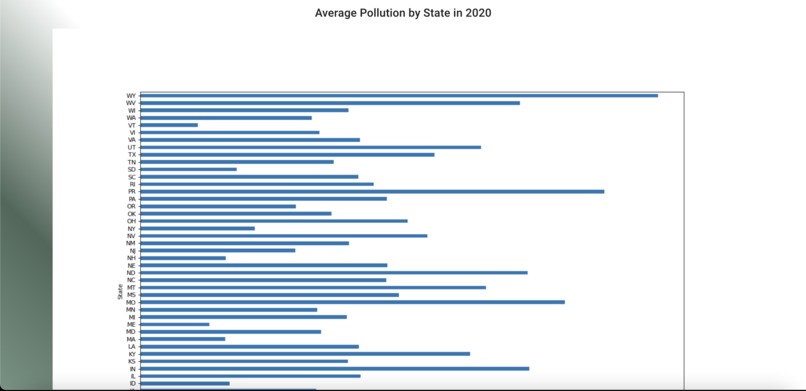
Analytics 2
-
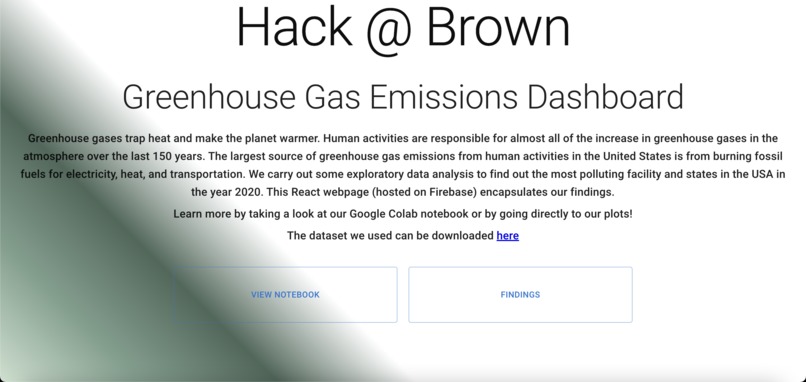
Home Page


Inspiration
Greenhouse gas emissions is becoming a runaway problem if we do not react now. Analyzing and drawing out facts from data is crucial to this process.
What it does
We encapsulate our findings in an easy to interact web dashboard. The dashboard displays our results, has links to peripherals and focuses on UI.
How we built it
We built it using React.js, Google Colab with Python and hosted it on Firebase.
Challenges we ran into
Thorough exploratory data analysis and integration with the web app in such a short time was challenging.
Accomplishments that we're proud of
We have a final POC and product to demonstrate along with a neat, clean UI!
What we learned
We learnt that some states and facilities are outliers and contribute excessively to greenhouse gas emissions.
GitHub
https://github.com/trajnishBrown/hack-at-brown
What's next for Greenhouse Gas Emissions Analytics Dashboard
Further, more thorough analytics, plots and inferences.

Log in or sign up for Devpost to join the conversation.