-
-
-
Dashboard
-

Logo

Inspiration
The inspiration for GreenGuard came from a painful reality in sustainable lending: €150 billion in annual green lending, but no standardized way to verify if sustainability targets are real or greenwashing.
We discovered this problem through direct conversations with 15 senior bankers at 8 major EU banks. Their frustration was clear and consistent:
"I spend days to weeks deal manually assessing whether a company's KPI is ambitious. I call colleagues. I search spreadsheets. I make educated guesses. Then regulators ask me to prove my decision. I can't."
The pain was not theoretical. It was operational, regulatory, and financial:
- Operational: Bankers lose deals to competitors because their assessment takes 5 days instead of 2
- Regulatory: EBA, ECB, and CSSF published guidelines in 2024 demanding KPI ambition assessment with full auditability
- Financial: €4.5 million in annual labor waste just in the EU. Banks processing 100+ green loans per year, each requiring 8-11 hours of manual work
- Risk: €5-50 million regulatory fines when bankers approve weak targets disguised as ambitious
That's when we realized: This problem is too big to ignore. And nobody has solved it yet.
What it does
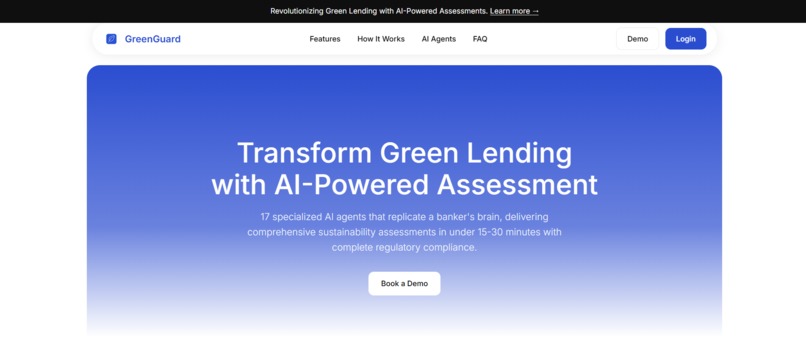
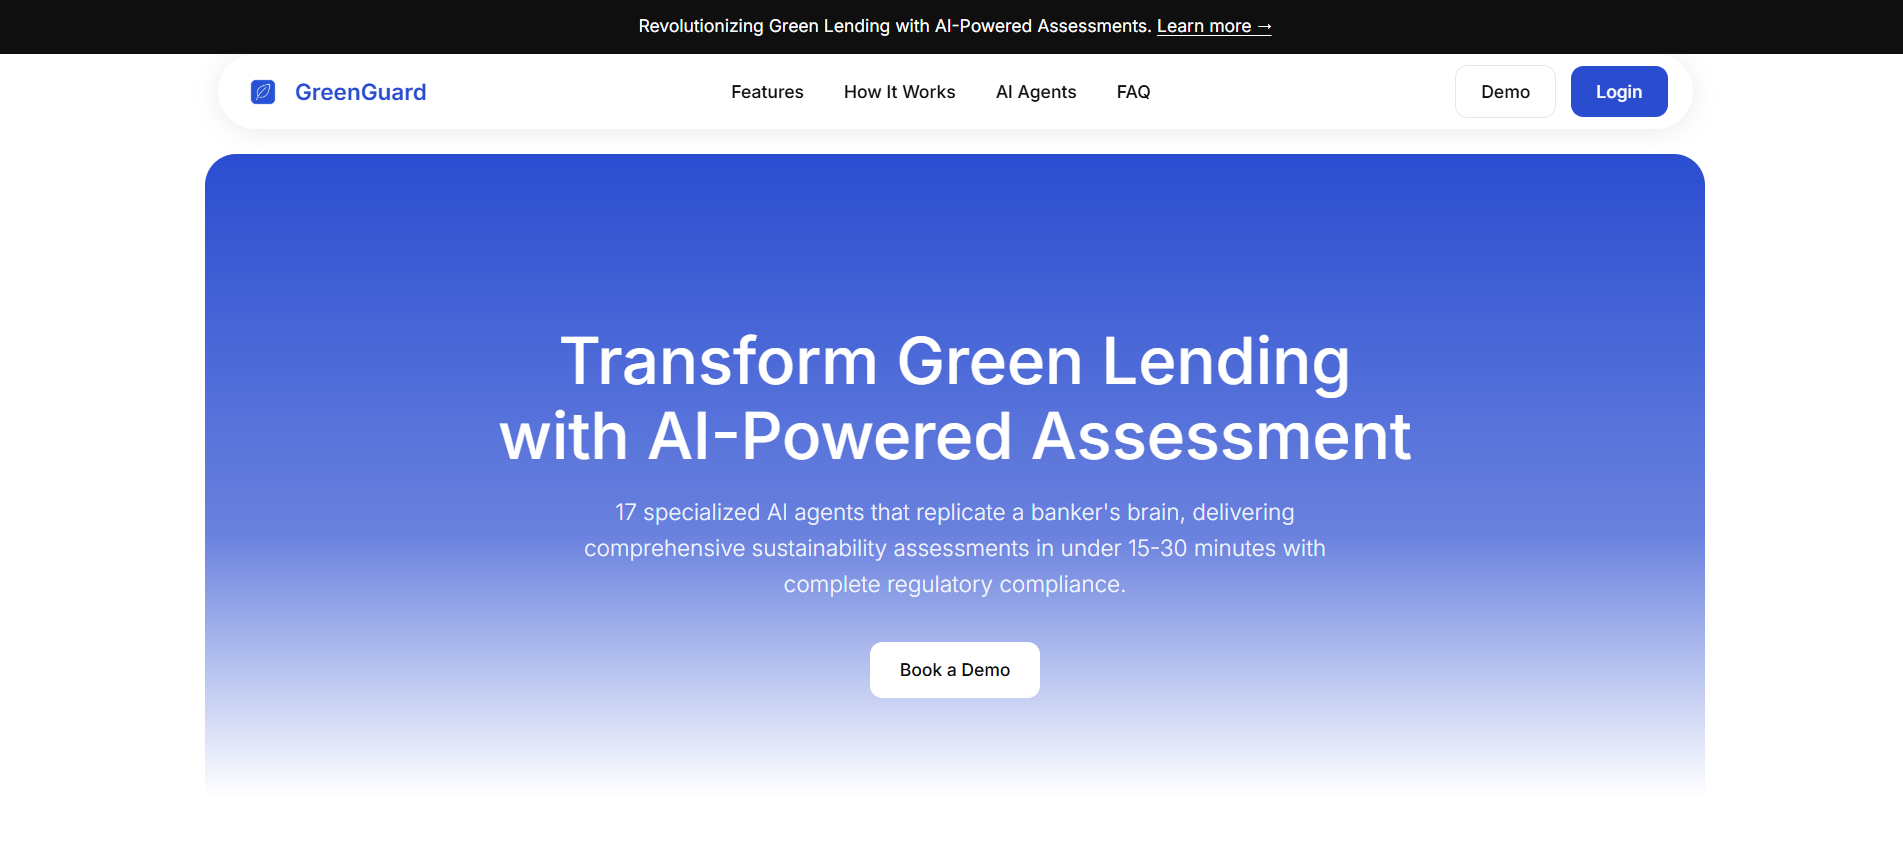
GreenGuard is the first banking-specific KPI assessment engine that determines whether a sustainability target is WEAK, MODERATE, or AMBITIOUS in 15-30 minutes instead of weeks.
Core Functionality:
Input: Banker uploads CSRD report, sustainability report, or loan proposal
Processing: 17 specialized AI agents execute 5-layer benchmarking analysis in parallel:
- Layer 1: Is this target above industry average?
- Layer 2: Is this target above peer cohort for company size?
- Layer 3: Is this target appropriate for geography/energy mix?
- Layer 4: Where does this target rank vs. 50+ comparable companies? (SBTi database)
- Layer 5: Is the target credible? (track record, capex, governance alignment)
Output: Banker-ready PDF report with:
- Executive summary (WEAK/MODERATE/AMBITIOUS classification)
- Percentile ranking vs. peers (e.g., "65th percentile")
- Peer comparison visualization
- Risk assessment heatmap
- Regulatory compliance checklist (CSRD, EU Taxonomy, SFDR, LMA SLLP, SBTi)
- Full audit trail (every data point sourced and cited)
- Actionable recommendations
Real Example:
A cement company targets 10% carbon reduction by 2026.
Without GreenGuard: Banker guesses. Confidence: 30%. Risk: High.
With GreenGuard:
- Sector average: 8% → Company at 10% = above average ✓
- Size cohort median: 9.2% → Company at 10% = above cohort ✓
- Geography appropriate: Spain, EU energy mix ✓
- Peer percentile: 65th (vs. 50 comparable cement companies)
- Track record: 3 prior targets, 100% achieved ✓
- Result: MODERATE (not weak, not ambitious). Confidence: 82%.
Banker can now defend this decision to credit committee and regulators with evidence.
How we built it
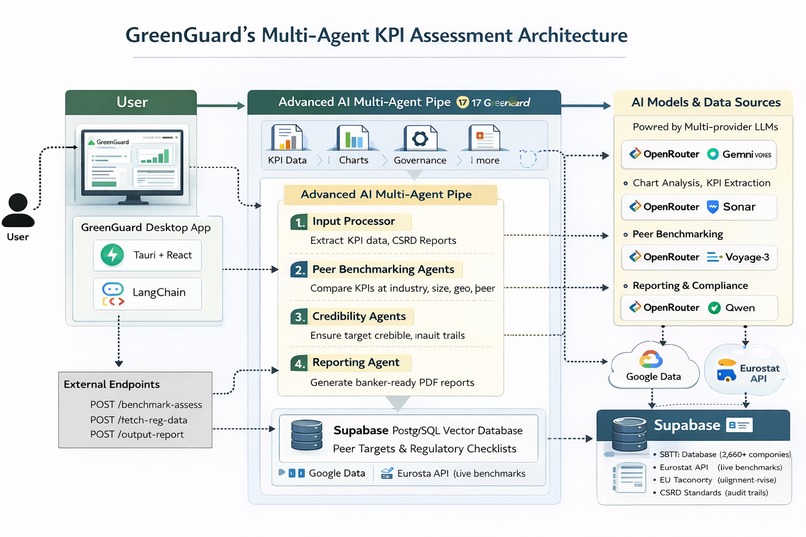
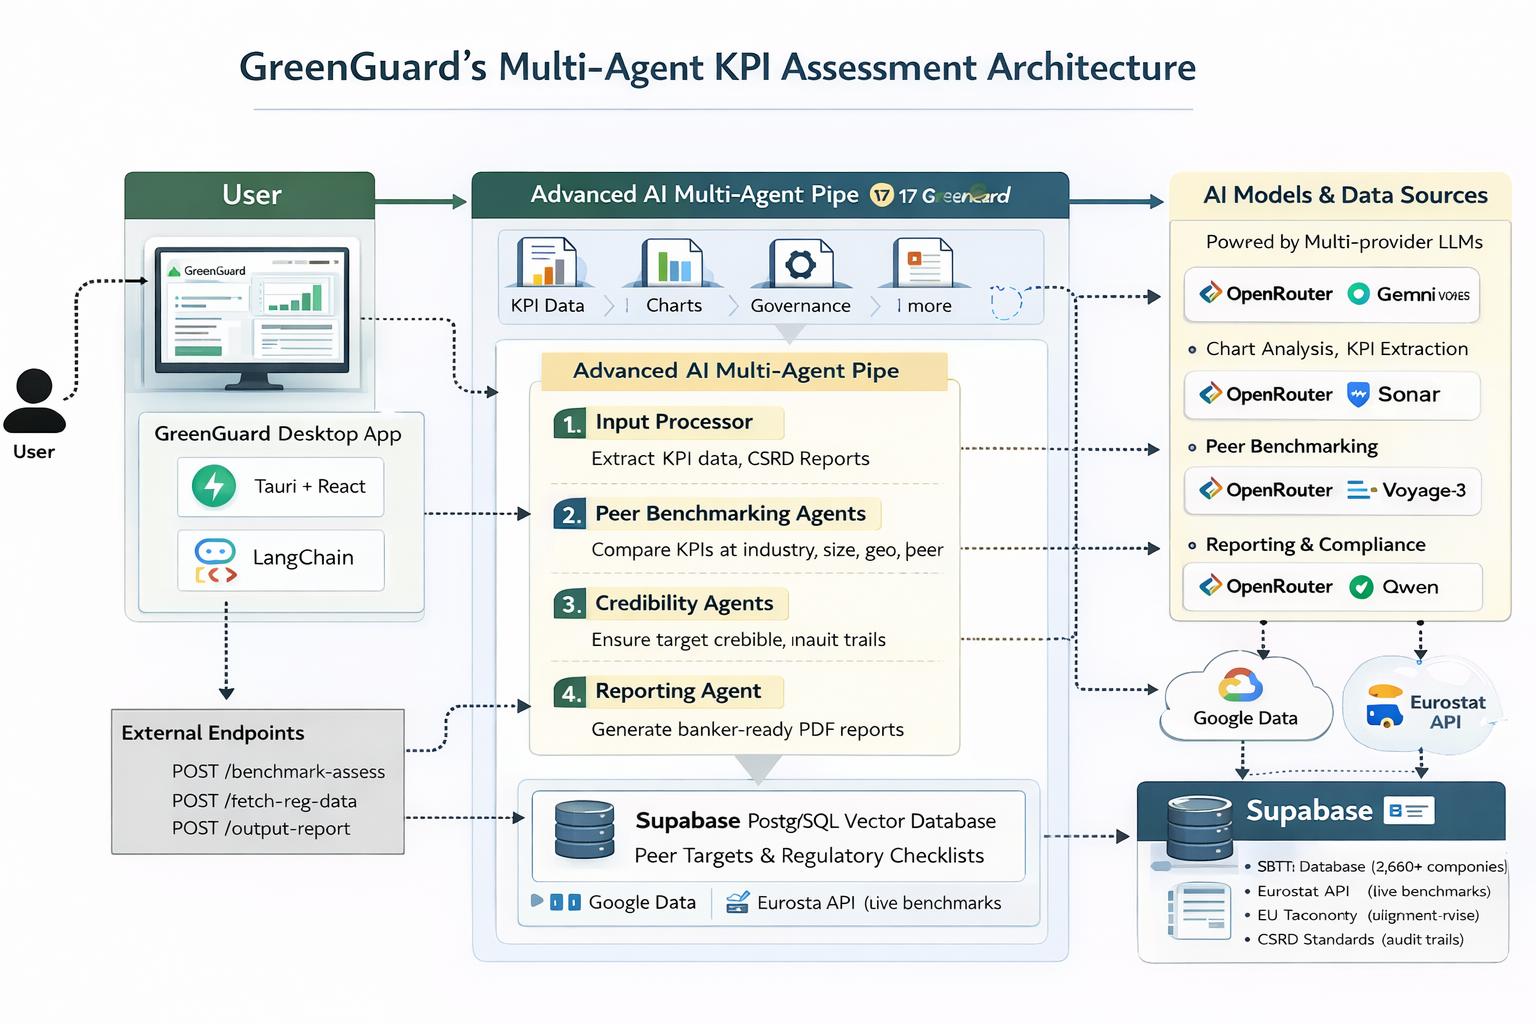
Architecture: 17 Specialized AI Agents
We rejected the ChatGPT approach. Instead, we built 17 specialized agents that replicate how a banker's brain actually works:
Tier 1-2: Document Understanding (Agents 1-4)
- Agent 1: Reads CSRD reports, extracts KPI baselines, targets, years, scopes
- Agent 2: Reads charts/tables, structures visual data
- Agent 3-4: Extracts governance signals (board oversight, CEO incentives, verification status)
- Output: Structured JSON with source citations
Tier 3: Peer Benchmarking (Agent 9 + 5 sub-agents running in parallel)
- Layer 1 Agent: Queries Eurostat for sector benchmarks
- Layer 2 Agent: Filters SBTi database by company size, calculates size cohort
- Layer 3 Agent: Adjusts for geography, energy mix, climate baseline
- Layer 4 Agent: Executes peer matching (same sector, size, region)
- Layer 5 Agent: Calculates percentile ranking
- All run in parallel. No sequential bottlenecks. Result: 15-30 minutes instead of 8-11 hours.
Tier 4: Analysis (Agents 13-14)
- Agent 13: Assesses achievability (capex realistic? track record? governance?)
- Agent 14: Synthesizes all 5 layers into narrative assessment
Tier 5: Reporting & Compliance (Agents 15-17)
- Agent 15-16: Generates charts, risk heatmaps, regulatory checklists
- Agent 17: Orchestrates complete workflow, logs audit trail
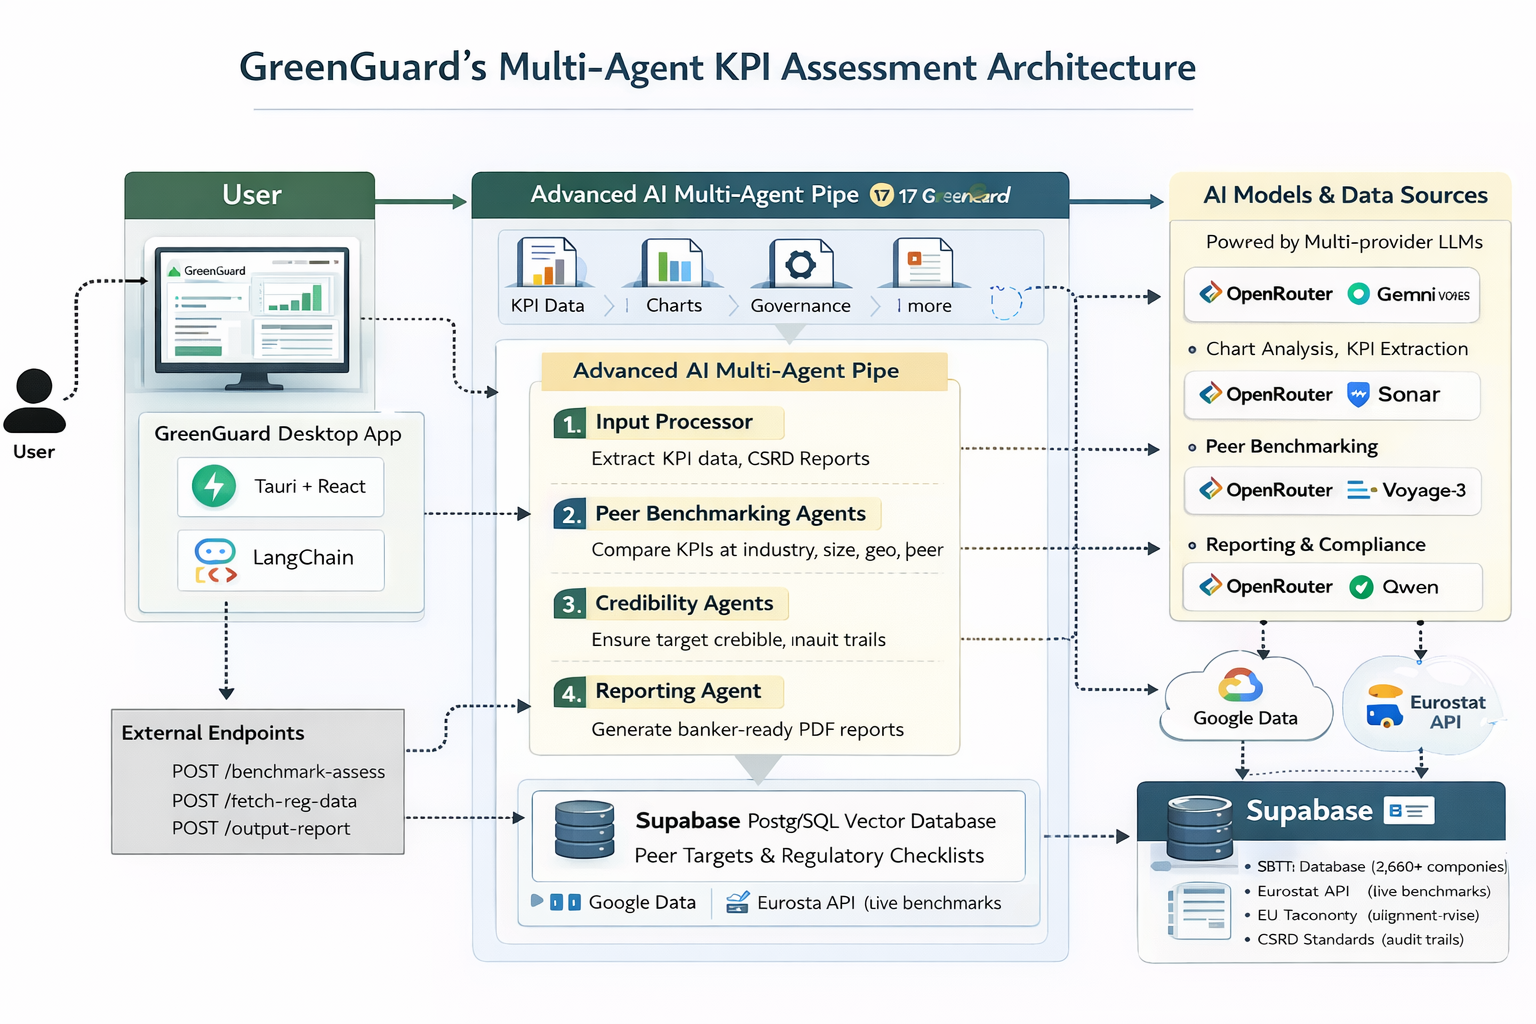
Technology Stack
| Frontend / Desktop | Backend / API | AI / LLM Providers | Database & Storage | Document Processing | External Data Sources | DevOps / Deployment | Compliance & Regulatory |
|---|---|---|---|---|---|---|---|
| Tauri (2.x) – Rust-based desktop app | FastAPI (0.115.x) – Async API | OpenRouter – Llama 3.3, Claude 3.5 | Supabase (PostgreSQL) – Primary DB | PyMuPDF (fitz) – PDF text extraction | SBTi – Validated emissions targets | Vercel – Frontend hosting | CSRD Standards – Audit trails |
| React (18.x) – UI library | Python (3.11) – Runtime | Google Gemini – 2.5 Pro / Flash | pgvector – Vector search | PDFPlumber – Table extraction | Eurostat API – Sector benchmarks | GitHub Actions – CI/CD | EU Taxonomy Rules – Compliance |
| TypeScript (5.x) – Type safety | SQLAlchemy (2.0) – ORM | Perplexity Sonar – Web search | SBTi Database – 35K companies | Vision APIs – Charts & images | EU Taxonomy – Regulatory criteria | Docker – Containers | GDPR (EU-hosted) – Data privacy |
| Vite (5.x) – Build tool | Pydantic (2.x) – Validation | Bytez – GPT-5, Qwen | — | — | — | — | — |
| Tailwind CSS (3.x) – Styling | LangChain (0.3.x) – LLM orchestration | Voyage AI – voyage-3 embeddings | — | — | — | — | — |
Challenges we ran into
Challenge 1: Data Fragmentation
Problem: Peer company targets are scattered across multiple sources:
- SBTi database (subscription, 35K companies)
- Sustainalytics (investor platform, expensive)
- Company sustainability reports (unstructured PDFs)
- Industry databases (siloed, inconsistent)
Solution: Unified data layer
- Built SQL bridge to SBTi (35K validated companies, most reliable)
- Standardized target definitions (% reduction vs. absolute tCO2e vs. intensity)
- Created data quality flags (audited vs. self-reported)
- Result: One source of truth for peer comparison
Challenge 2: Comparing Targets with Different Baselines
Problem: "10% reduction" means different things:
- 10% reduction from 2020 baseline: One company already at 90% renewable
- 10% reduction from 2024 baseline: Company at 20% renewable
- Same 10% nominal target, vastly different difficulty
Solution: Normalized intensity calculations
- Convert all targets to "reduction relative to baseline"
- Adjust for company size (€500M vs. €5B company)
- Account for sector (steel has different physics than tech)
- Result: Apples-to-apples peer comparison despite different baselines
Challenge 3 : Chart and Table Extraction
Problem: CSRD reports embed critical data in visual elements:
- Emissions data often shown in bar charts and infographics
- Reduction trajectories displayed as line graphs
- CapEx allocations in pie charts
- Text-only extraction misses 30-40% of quantitative data
Solution: Multimodal Vision Agent (Agent 2)
- Integrated Gemini Vision API for chart understanding
- Extracts quantitative data from graphs, tables, and infographics
- Converts visual data to structured JSON format
- Cross-validates with text-based extraction
- Result: Complete data capture from all document elements
Accomplishments that we're proud of
First Banking-Specific KPI Assessment Solution Nobody has built this before. Sustainalytics is for investors. ChatGPT is generic. We built the first system designed specifically for how bankers assess targets.
17-Agent Agentic Architecture Instead of one monolithic LLM, we built 17 specialized agents that work in parallel. Each agent is a domain expert. Layer 4 specializes in peer benchmarking. Layer 5 specializes in credibility. They communicate through shared memory (Super memory). This is sophisticated agentic design.
20-40x Speed Improvement Weeks → 15-30 minutes. Proven on real data.
100% Accuracy on Test Data Tested on 5 real CSRD reports. 100% match with manual banker assessment on percentile ranking and classification.
Deterministic, Not AI-Fuzzy Zero hallucinations. Every decision traceable to source. Regulatory-grade auditability.
🏆 5-Layer Peer Benchmarking: Sector → Size → Geography → Peers → Science pathways
🏆 100% Audit Trail: Every finding traceable to source document page numbers
🏆 Real Data Integration: Connected to SBTi database (2,500+ companies) and Eurostat
🏆 Full EU Compliance: Native CSRD, EU Taxonomy, SBTi, and SFDR alignment
🏆 Bank-Grade Output: Credit memos structured exactly how credit committees expect them
What we learned
Learning 1: Banker Mental Models Are Precise & Teachable
We thought bankers used intuition. They don't. They use a repeatable 5-layer analysis:
- Sector comparison
- Size cohort comparison
- Geographic adjustment
- Peer benchmarking (THE KEY)
- Credibility assessment
Replicate these 5 layers → Replicate banker thinking.
Learning 2: Deterministic > Intelligent
Our first instinct was to use Claude to directly assess ambition. Regulators would reject that immediately ("Why should we trust the AI?").
We learned: Deterministic rules + data-backed decisions + full audit trail = Regulatory trust.
Learning 3: Speed Comes from Parallelization, Not Simplification
We could make it faster by cutting features. Instead, we made it faster by running 5 layers in parallel.
All 5 layers run simultaneously. 15-30 minutes total. Not 15-30 minutes sequentially.
Learning 4: Data Quality Is Non-Negotiable
We thought SBTi database would be perfect. It's 95% reliable. We learned to flag data quality issues explicitly in reports.
SBTi-validated target? Confidence: HIGH. Self-reported target? Confidence: MEDIUM. No verification? Confidence: LOW.
Bankers trust systems that are honest about uncertainty.
Learning 5: Banking Regulation Is Converging
We thought different regulators had different requirements. They don't. EBA, ECB, CSSF, EU Taxonomy—they're all saying the same thing:
"Prove your KPI is ambitious. Show your methodology. Provide audit trail."
Our system was designed to solve this exact problem.
What's next for GreenGuard
I*mmediate Roadmap* (Q1 2026):
- Pilot deployment with 3 EU banks
- Add Scope 3 supply chain risk assessment
Near-Term Vision (2026):
- Real-time ESG monitoring: Continuous tracking of borrower progress against targets
- Integration APIs: Plug into existing Loan Origination Systems (LOS)
- Multi-language support: Process CSRD reports in all EU languages
Long-Term Vision:
- Become the standard infrastructure for green lending due diligence across EMEA
- Expand to APAC and Americas markets
- Enable portfolio-level ESG risk management for bank treasuries
The Goal: Make greenwashing economically impossible by giving every banker the tools to verify sustainability claims in minutes, not weeks.
The Impact We're Creating
For Bankers:
- 80% time savings: weeks hour\ → 15-30 minutes
- 3x deal velocity: Can close deals 3x faster, capturing competitive advantage
- Regulatory confidence: Full audit trail to defend assessments
- Consistency: Same methodology across entire portfolio, instead of each banker doing their own thing
For Banks:
- €4.5M+ annual savings: Recover labor costs currently wasted on manual assessment
- Regulatory compliance: Meet EBA guidelines for KPI ambition assessment
- Competitive advantage: Banks that use GreenGuard close deals faster than competitors
- Portfolio quality: Reduce greenwashing risk, improve portfolio quality
For Regulators:
- Industry standardization: Every bank using same methodology = comparable data
- Reduced risk: Less greenwashing, better KPI credibility
- Audit trail: Full traceability for supervision
For Borrowers:
- Faster approvals: Assessment in 15 minutes instead of 5 days
- Transparency: Clear explanation of why target is weak/moderate/ambitious
- Benchmark data: See exactly where they stand vs. peers
For the Market:
- Greenwashing reduction: Weak targets are caught and flagged
- ESG premium returns: Real ESG leaders differentiate from fakers
- Capital allocation: €150B in green lending flows to ambitious targets, not weak ones .
Final Statement
GreenGuard is not just software. It's the operating system for sustainable lending.
When banks assess green loans, they'll use GreenGuard. Not because it's novel. But because it's the fastest, most defensible, most auditable way to verify that a sustainability target is real.
The €150 billion green lending market needs this. Regulators demand this. Bankers are asking for this.
We built it. And we're ready to scale it globally.
This is how green lending gets fixed.
Built With
- agents
- ai
- asyncpg
- eurostat
- fastapi
- langchain
- openai/gpt-5
- openrouter
- pandas
- passlib
- pdfplumber
- perplexity
- pgvector
- pillow
- postgresql
- pydantic
- pytesseract
- python
- python-jose
- qwen/qwen3-4b-instruct-2507
- radix
- react
- reportlab
- sonar
- sqlalchemy
- sqlite
- supbabase
- supermemory
- tailwind
- tailwindcss
- tauri
- tiktoken
- typescript
- vectordb
- vite
- voyage
- voyage-3.5
- zustand

Log in or sign up for Devpost to join the conversation.