-
technical report
-
our results
Inspiration
The inspiration for this project came from searching for some of the reasons why global warming is affecting Scotland. We, as a team, wanted to do something for Scotland and something that is related to Scotland. We found out that peatlands are very unique to Scotland, and these things account for a huge percentage of CO2 emissions every year when they catch fire during dry seasons. We wanted to figure out if we can help the government prioritize which areas they need to spend more time giving attention to, so as to avoid the fires.
What it does
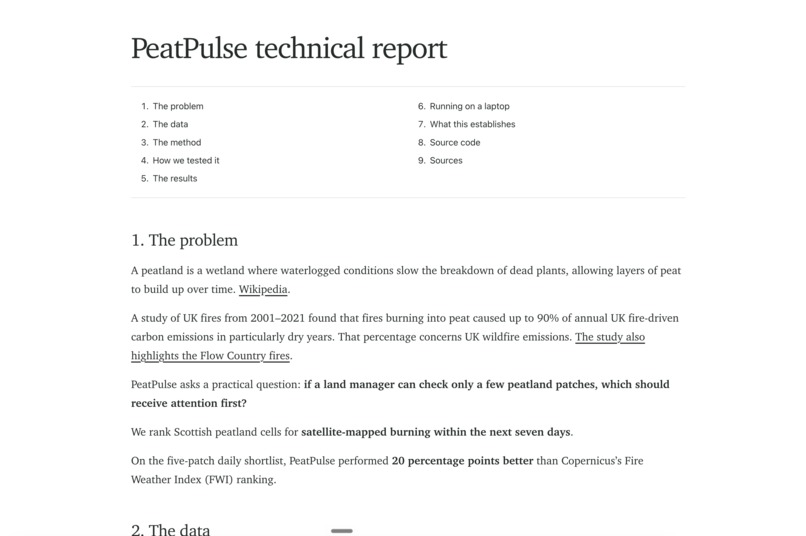
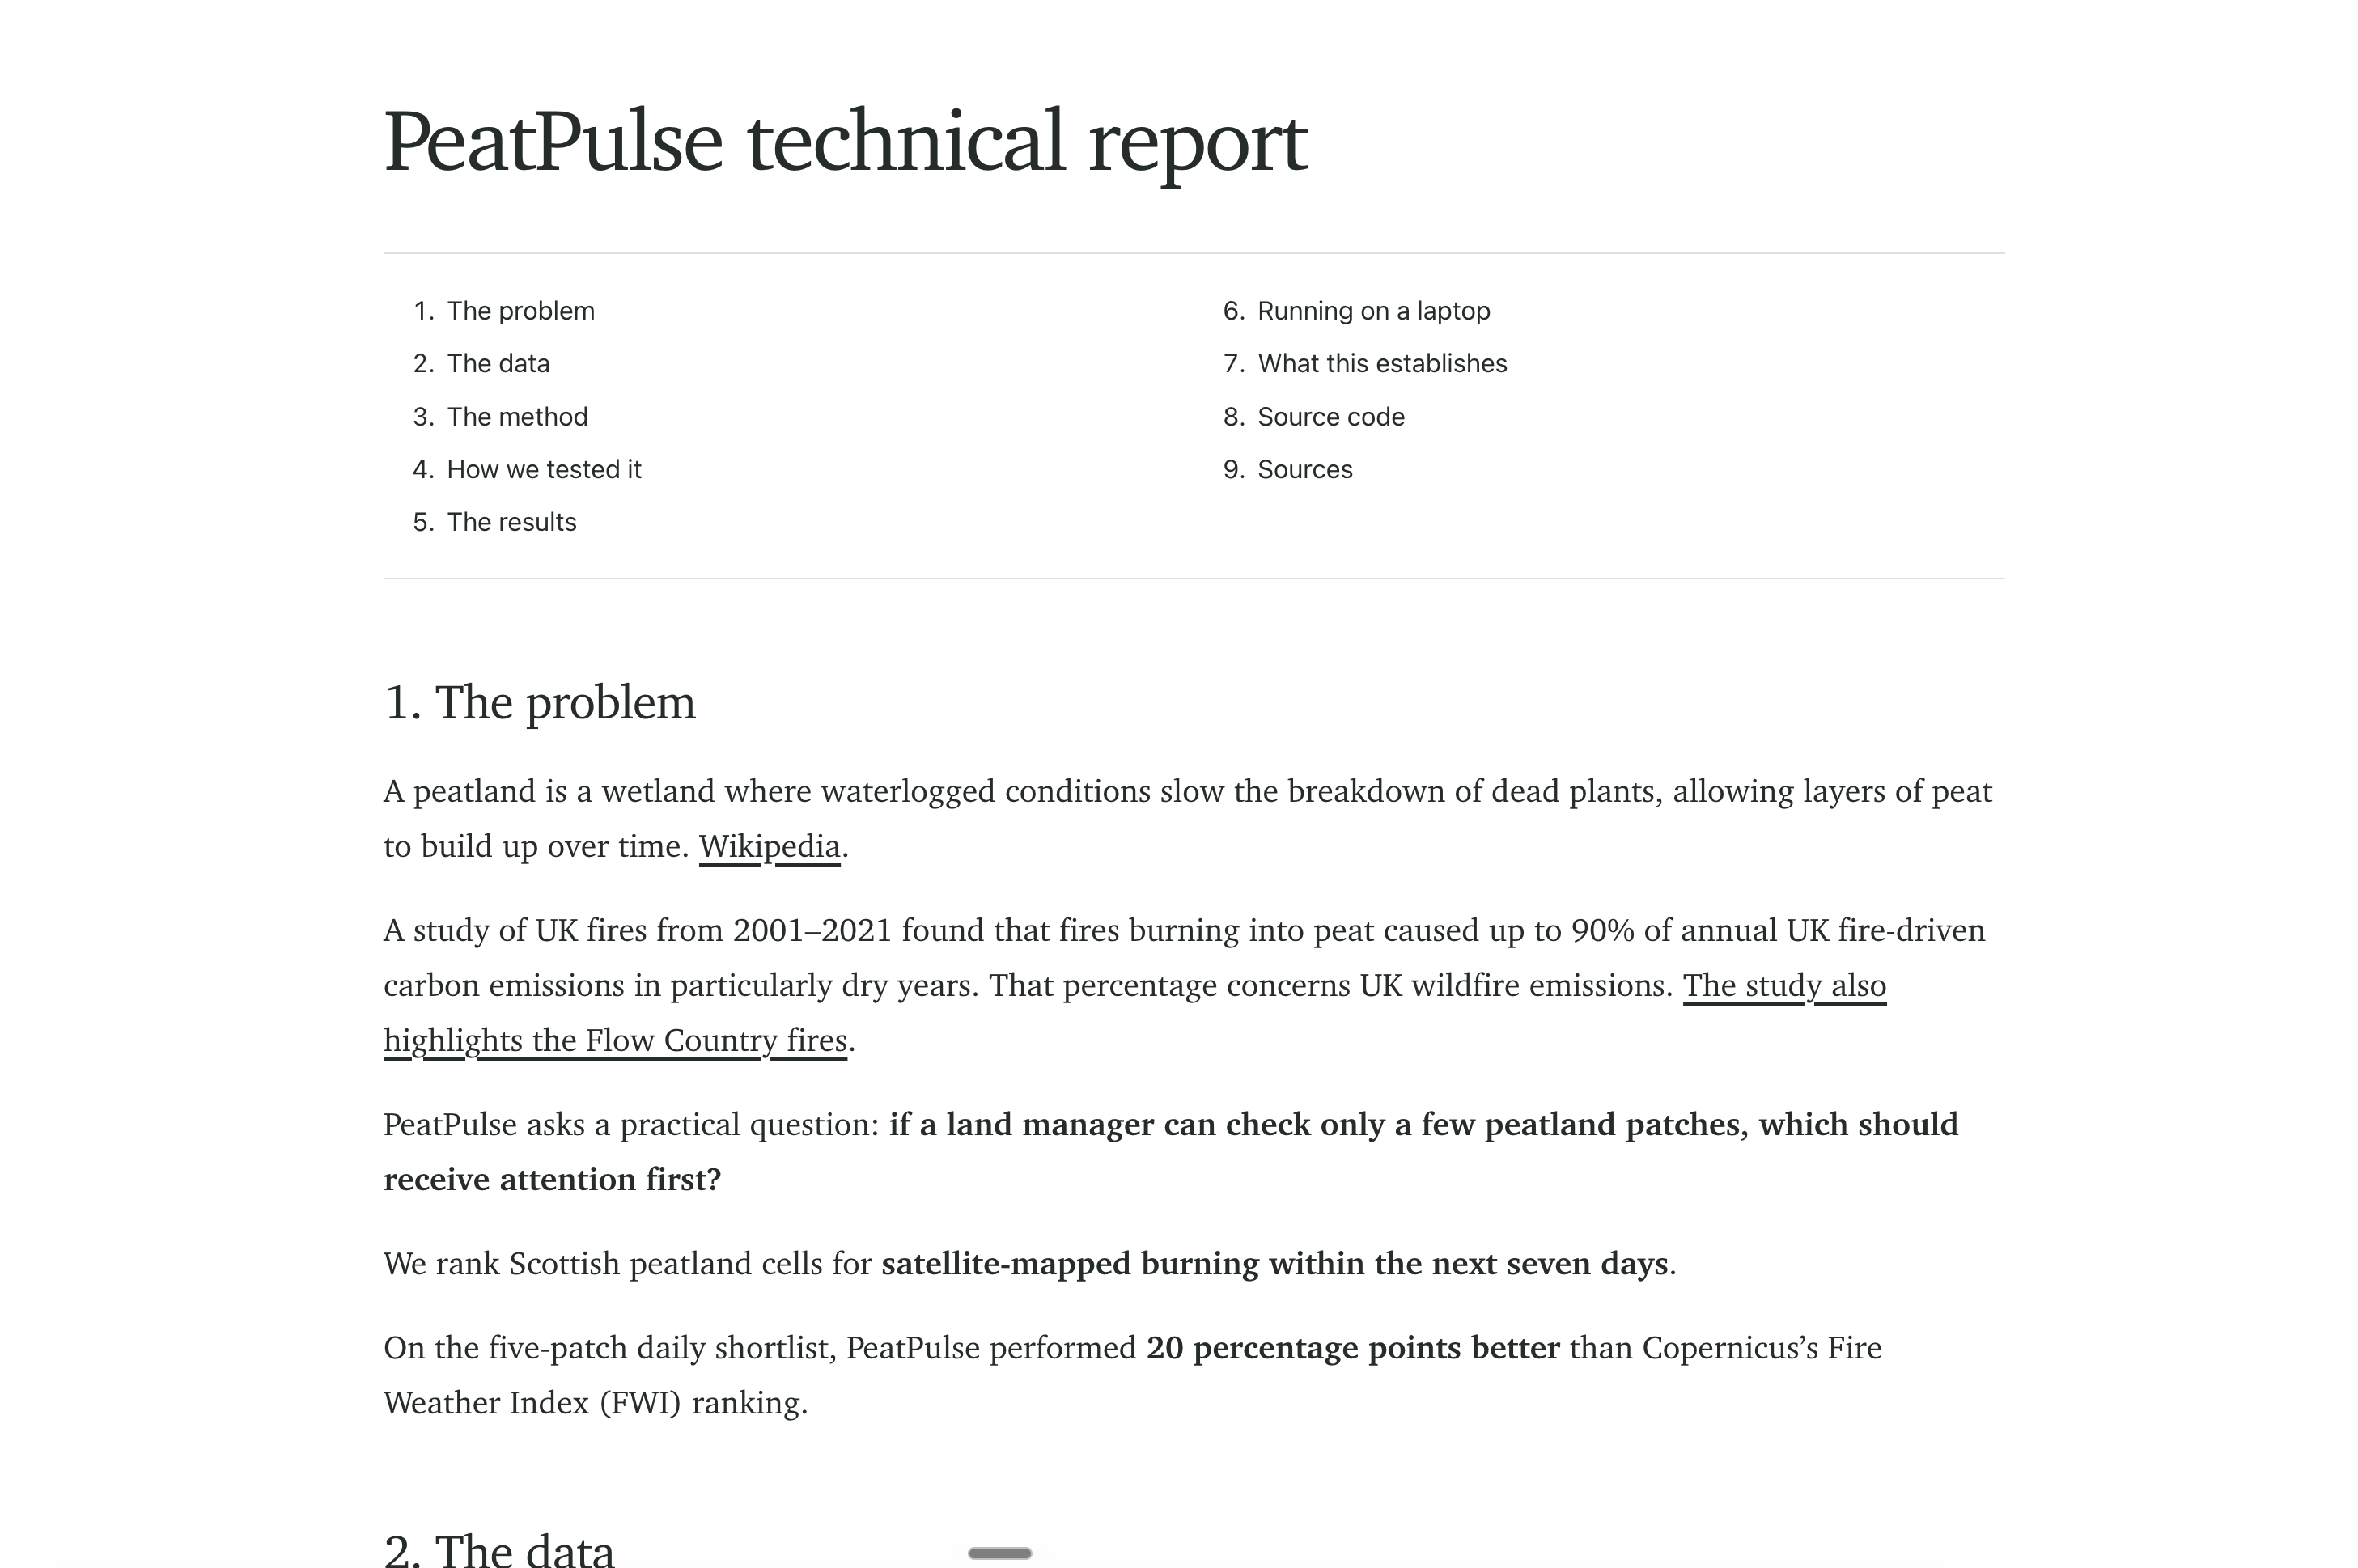
PeatPulse ranks 1 km peatland squares by their relative risk of satellite-mapped burning in the next seven days. It uses a Random Forest model trained on historical weather and Copernicus fire-danger data. The score is for ranking areas that need the most attention in the next 7 days.
How we built it
The way we built this is by first gathering a lot of data from various open platforms. We brought together public data by location and date:
- NatureScot peatland maps to identify peatland areas
- ERA5 historical weather, including rain, temperature, humidity and wind
- Copernicus fire-danger readings, including the Fire Weather Index
- Satellite burn records to check where burning was later mapped
- Sentinel-1 radar data, which we tested as an additional input
Challenges we ran into
The hardest part was matching data that describe different places, time periods, and map sizes.
Accomplishments that we're proud of
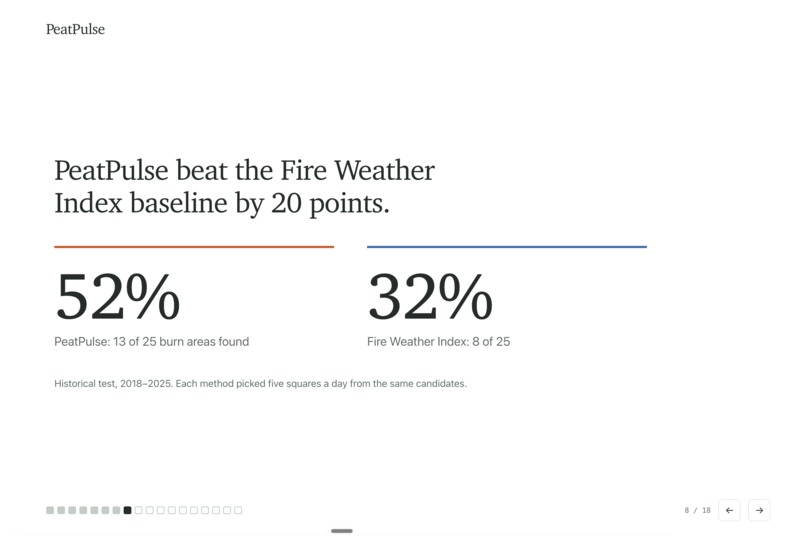
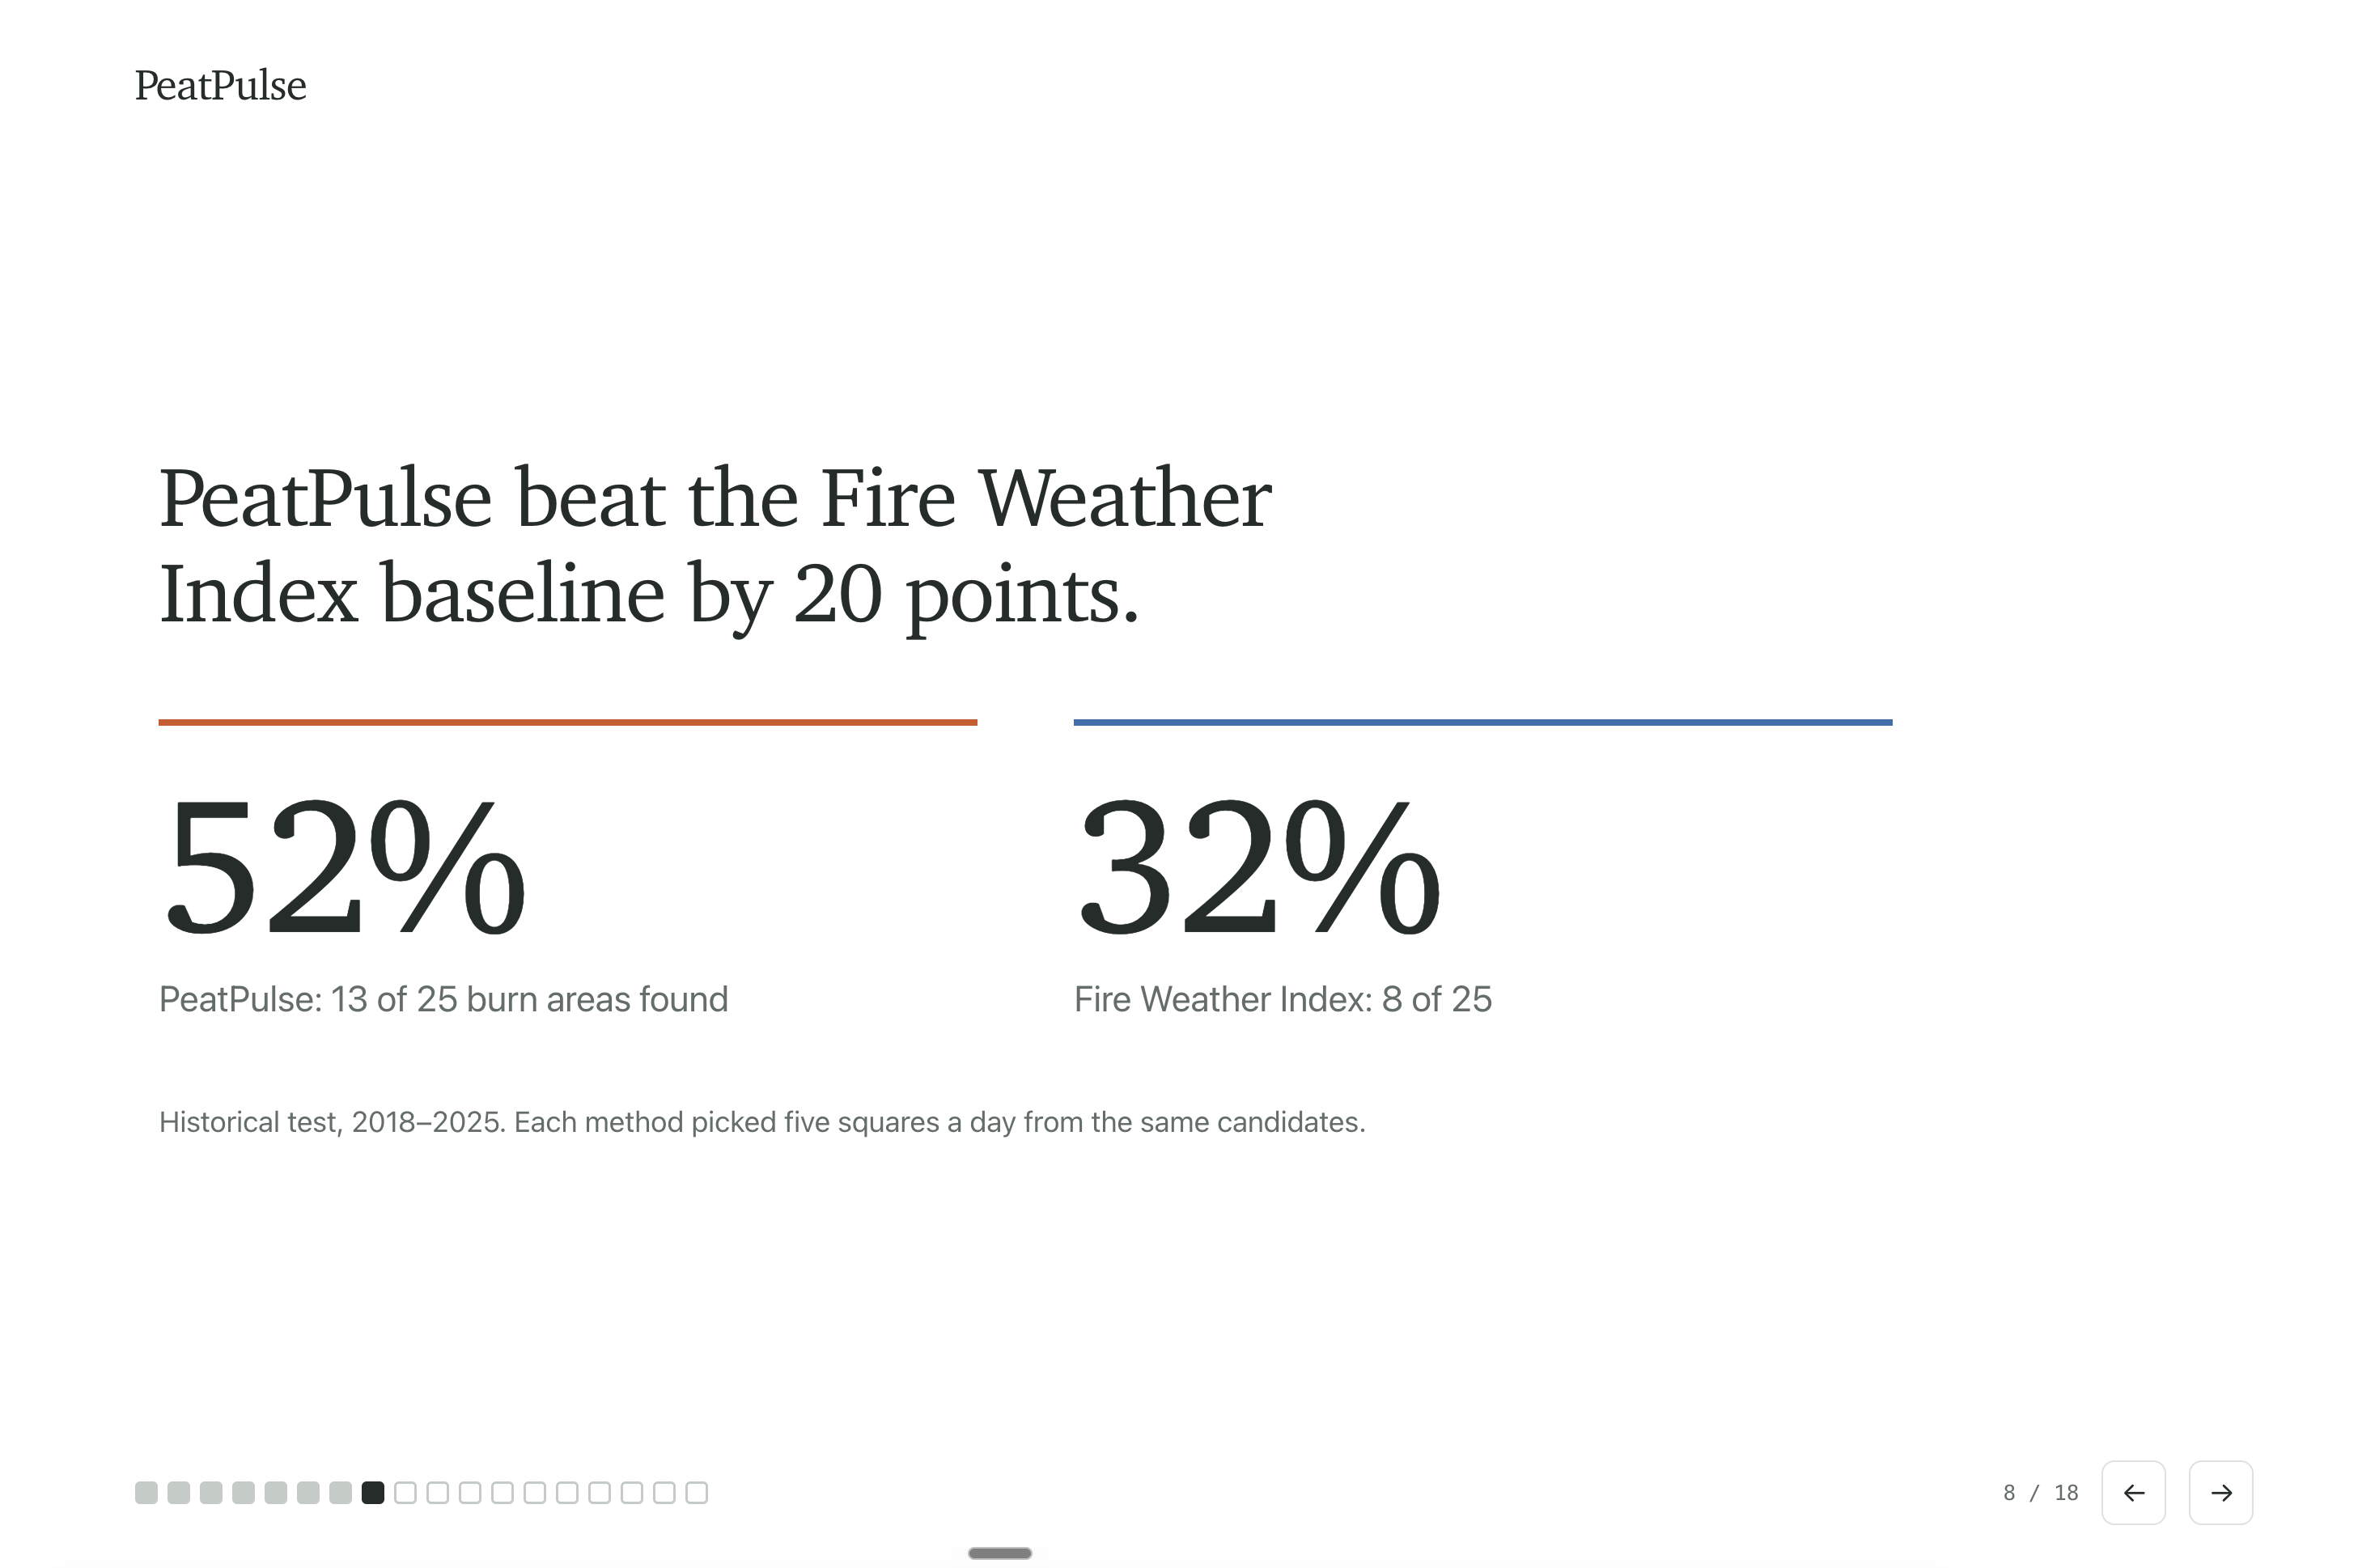
On our historical benchmark, when each method could shortlist five areas per day, PeatPulse matched 13 of 25 mapped burn areas. Ranking by the Fire Weather Index alone matched 8 of 25. That is a 20 percentage point difference in this test.
We also tested radar data, several model types, and different shortlist sizes. Radar did not improve the best result, so we kept the simpler weather and fire-danger model.
What we learned
I think the most important thing that we learned as a team was, of course, how to work with scattered data across many places, because the data we gathered was coming from many different sources. After gathering the data, we had a very important job of aligning the dates and areas that we were looking into. That reduced the amount of data from a very big number to a relatively smaller number, which was surprising to us and something that we didn't think about.
What's next for PeatPulse
We would test the ranking on a later period with stronger, independently checked fire records. Land managers could then help assess whether the shortlist is useful in practice and how many areas they could realistically check.

Log in or sign up for Devpost to join the conversation.