-
-
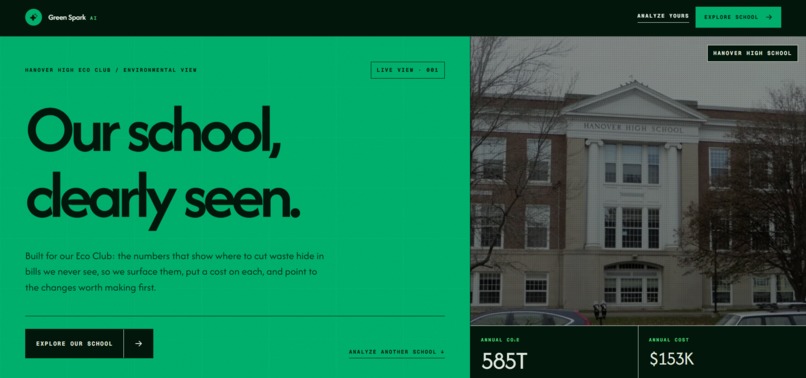
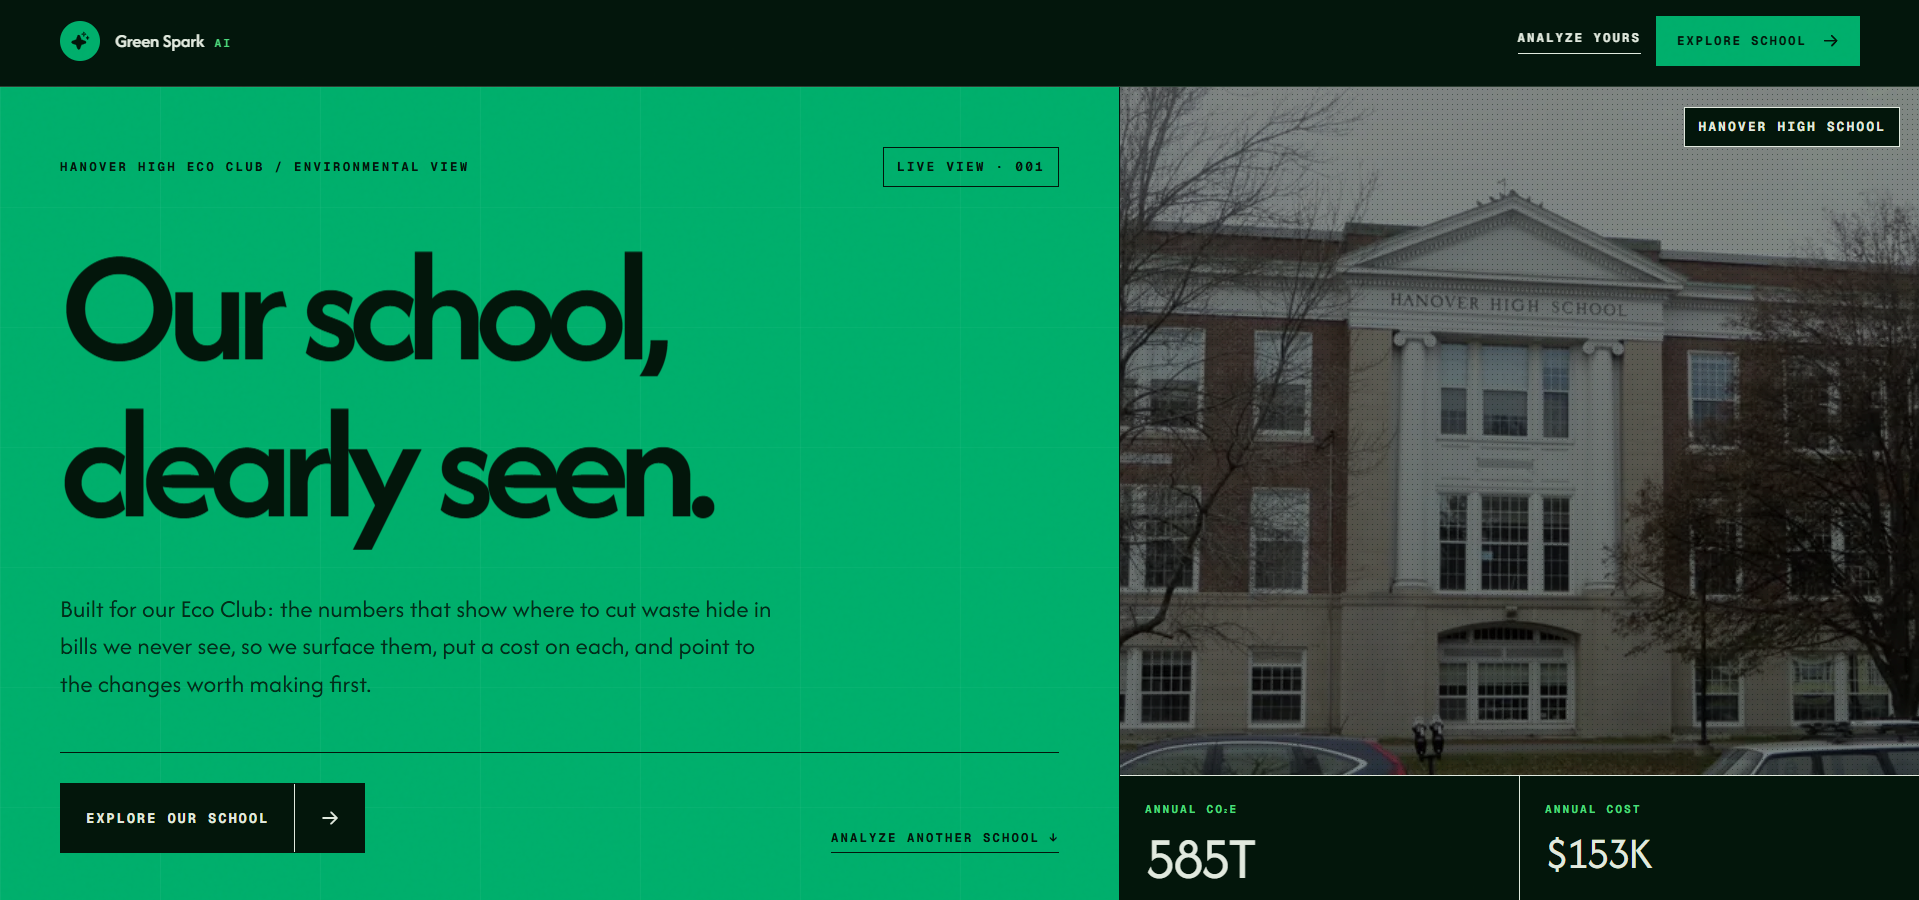
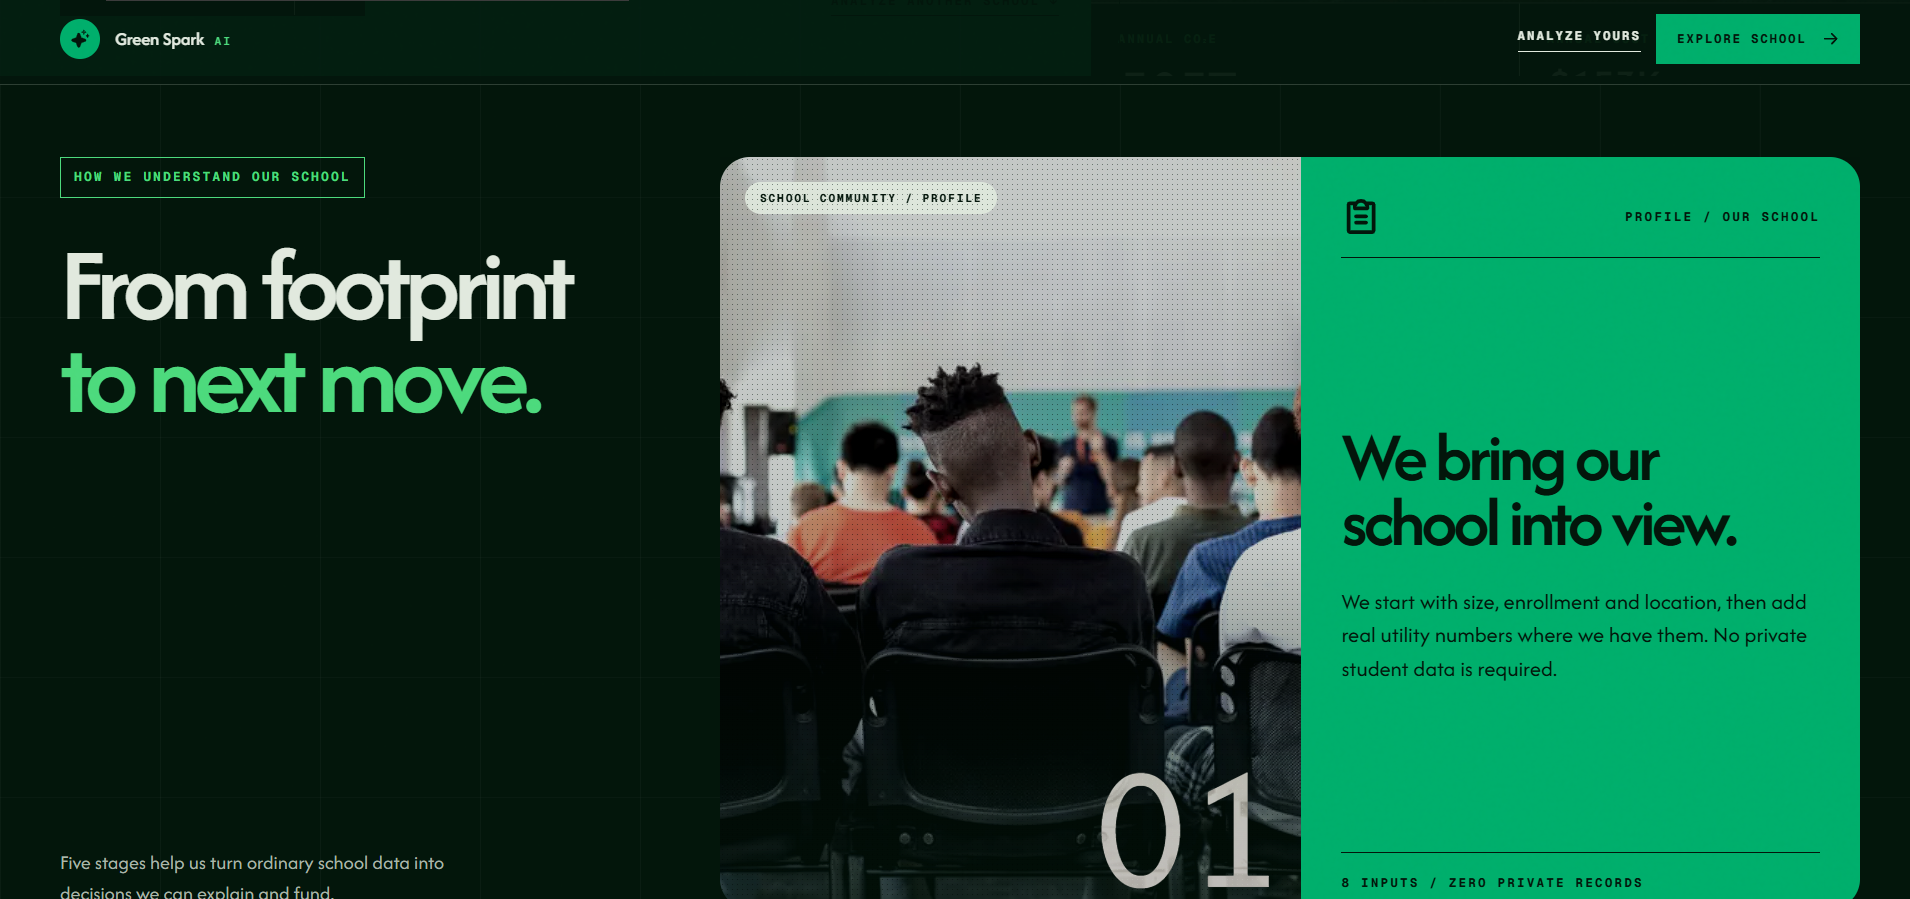
The Green Spark AI homepage introduces Hanover High School’s environmental dashboard with a bold green and dark interface.
-
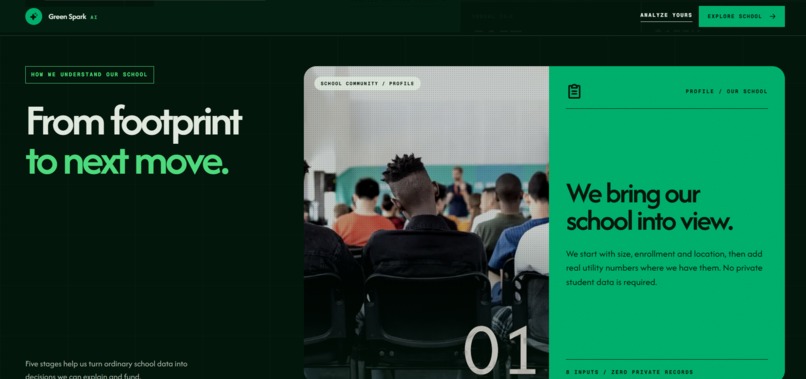
This section explains how Green Spark AI turns a school’s basic profile into an environmental analysis.
-
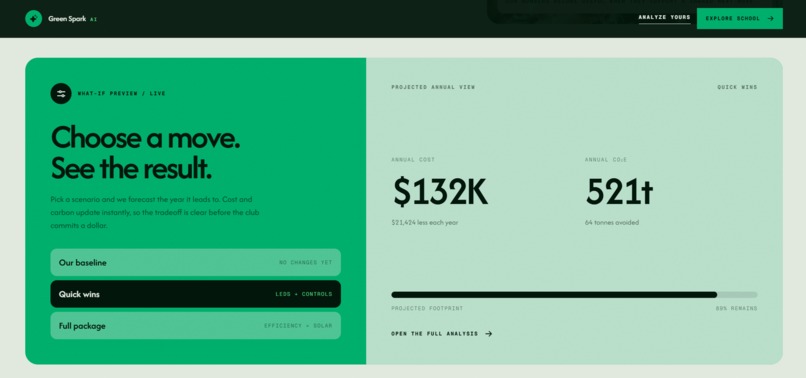
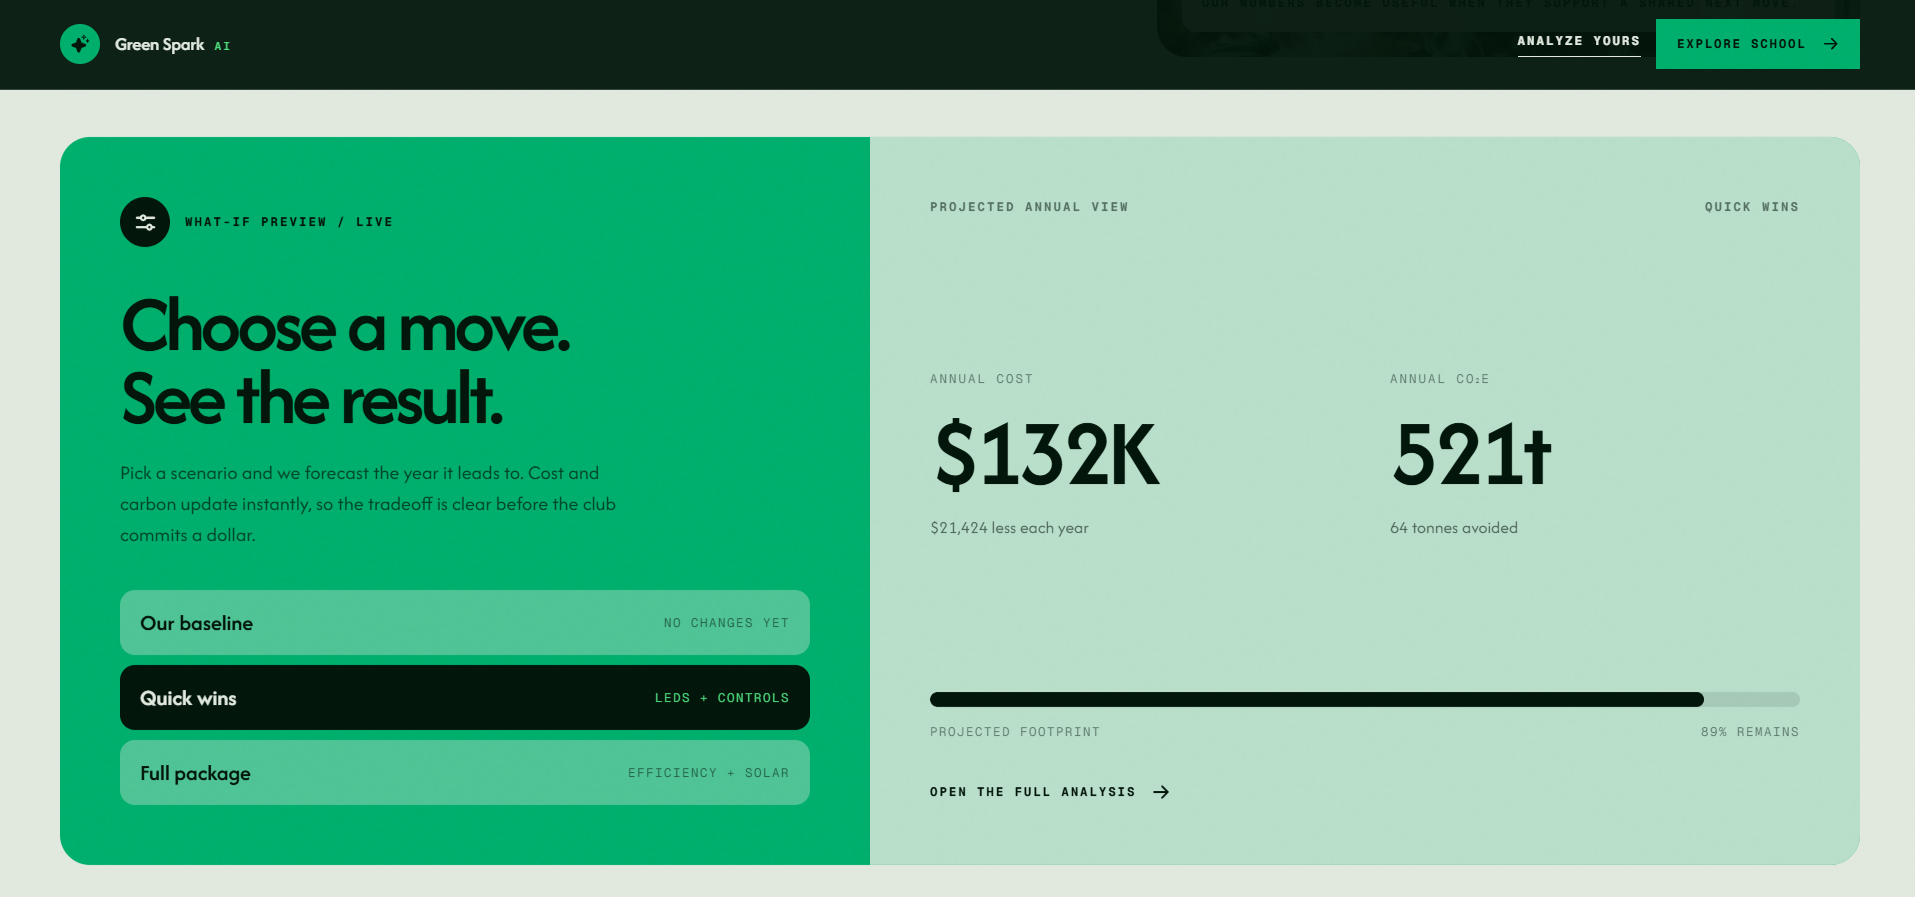
This page shows an interactive “what-if” feature where users can choose different sustainability actions and see the projected impact.
-
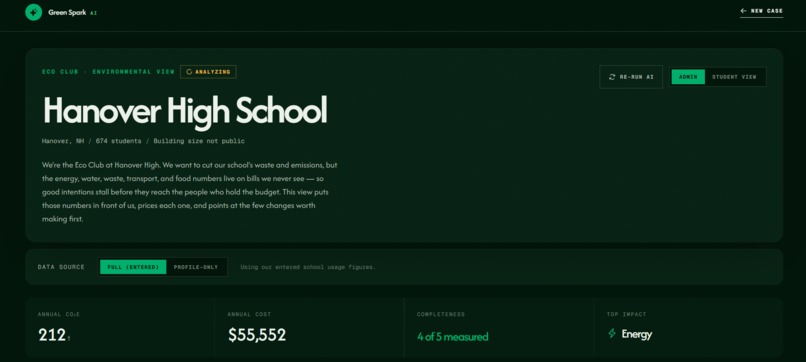
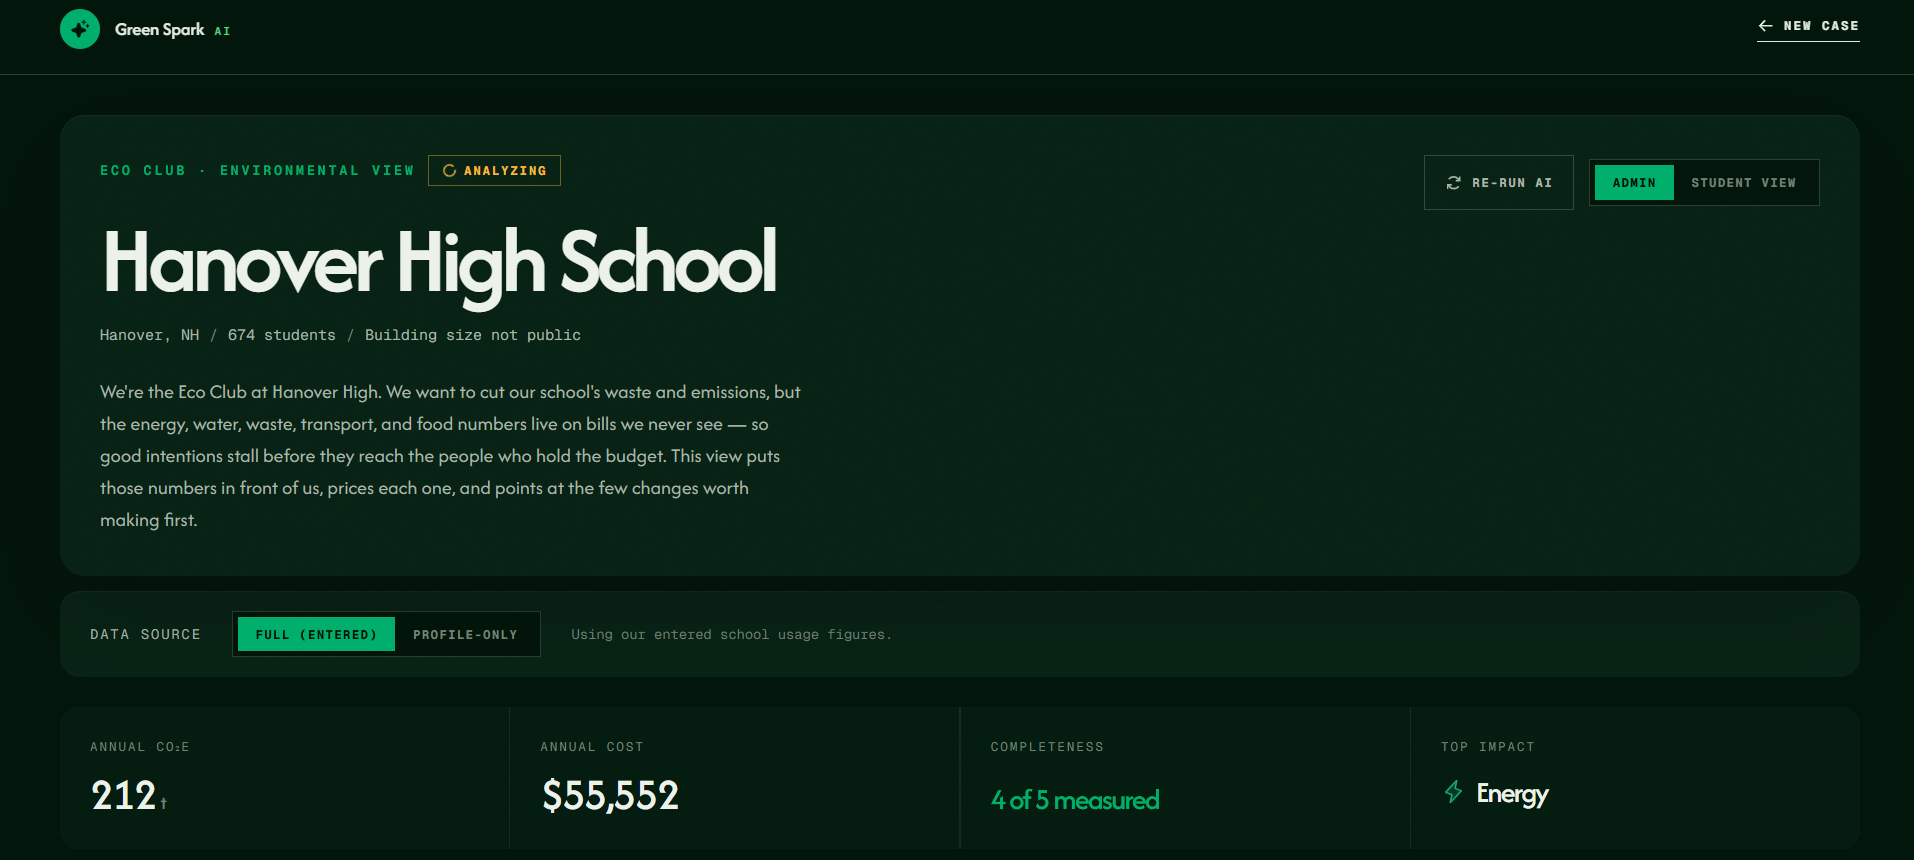
The dashboard displays Hanover High School’s environmental profile, including location, student count, and data completeness.
-
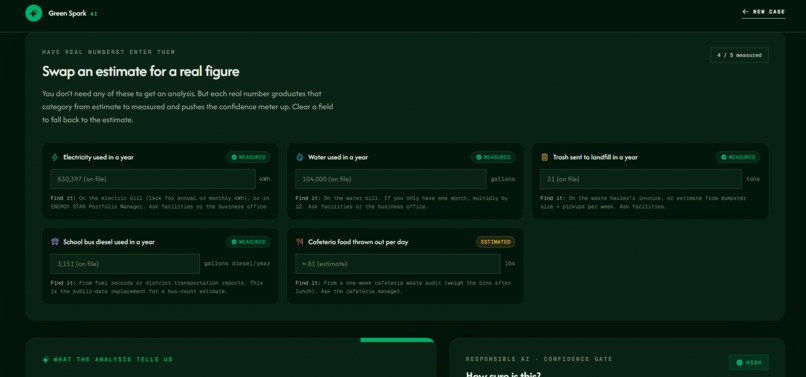
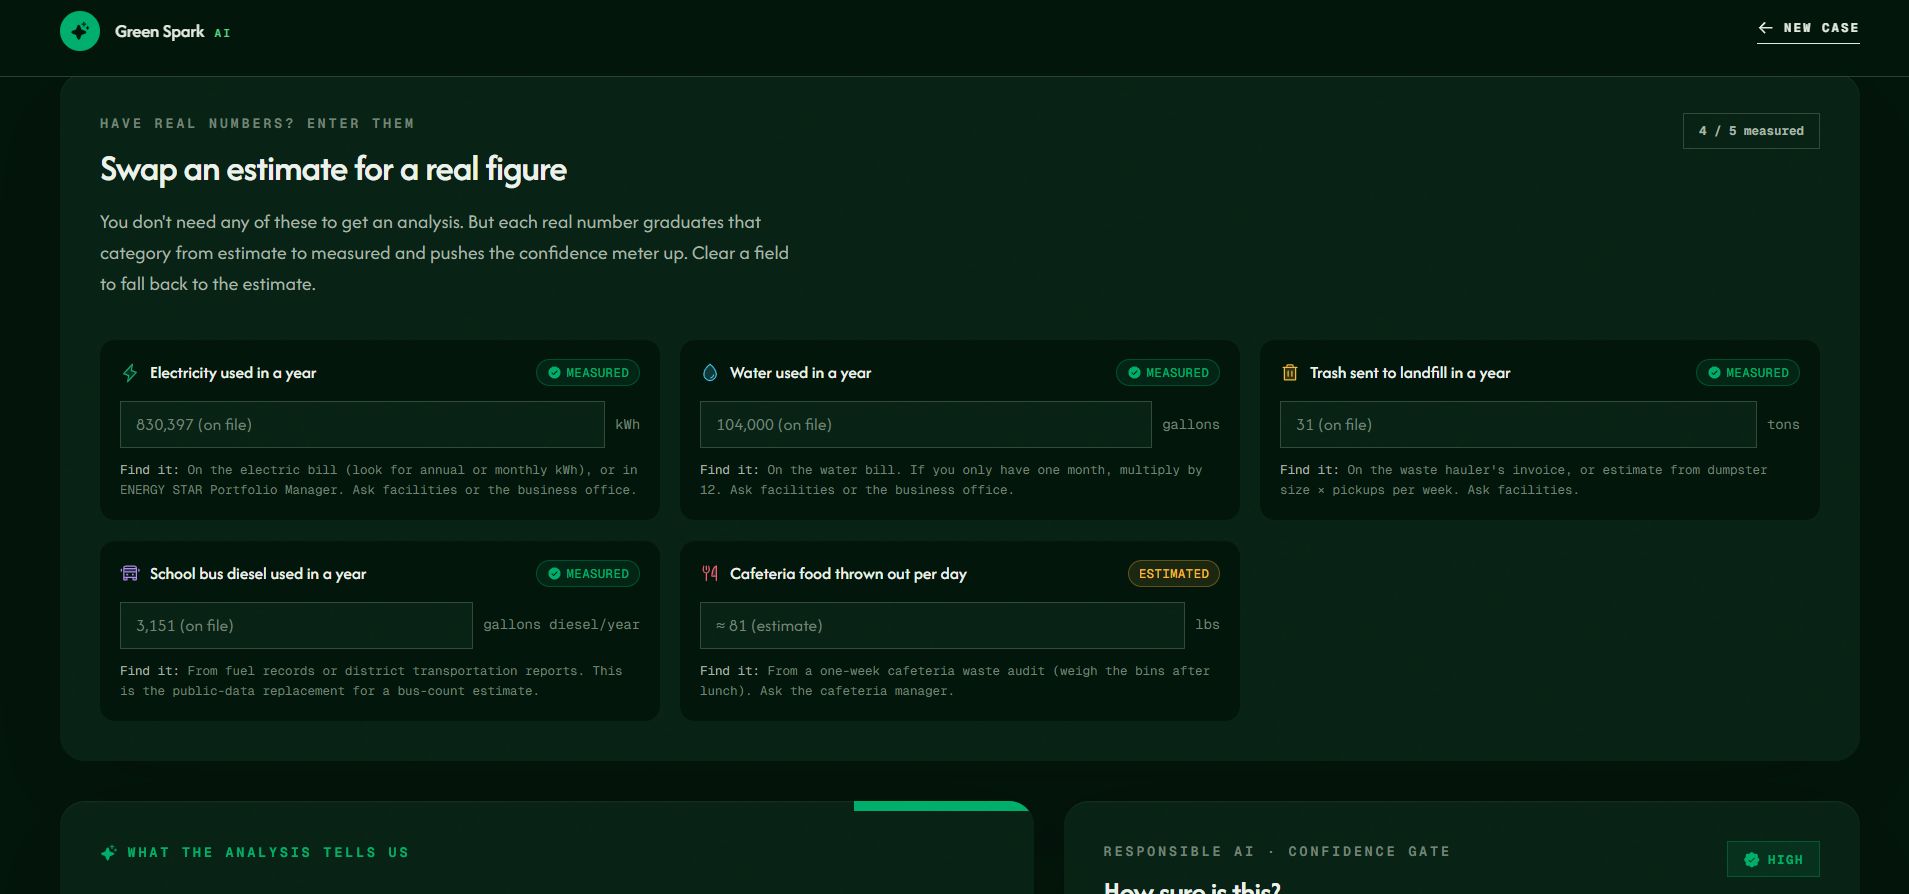
This page lets users replace estimates with real school numbers, such as electricity use, water use, landfill waste and bus diesel.
-
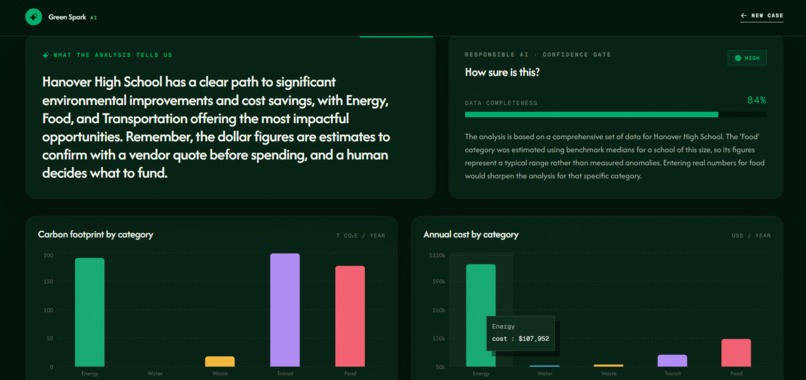
This section explains the main findings from the analysis and includes a responsible AI confidence score.
-
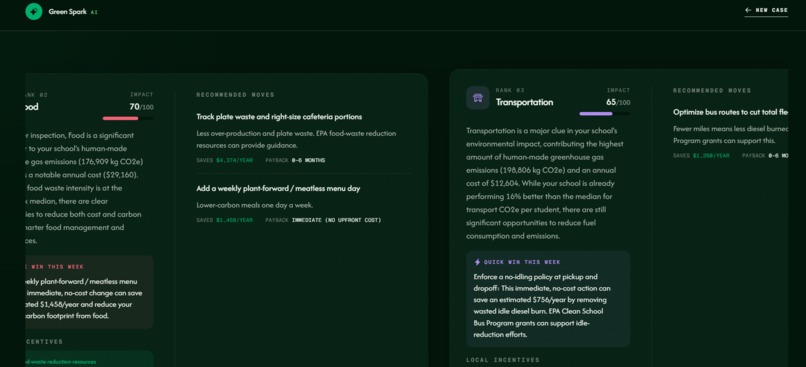
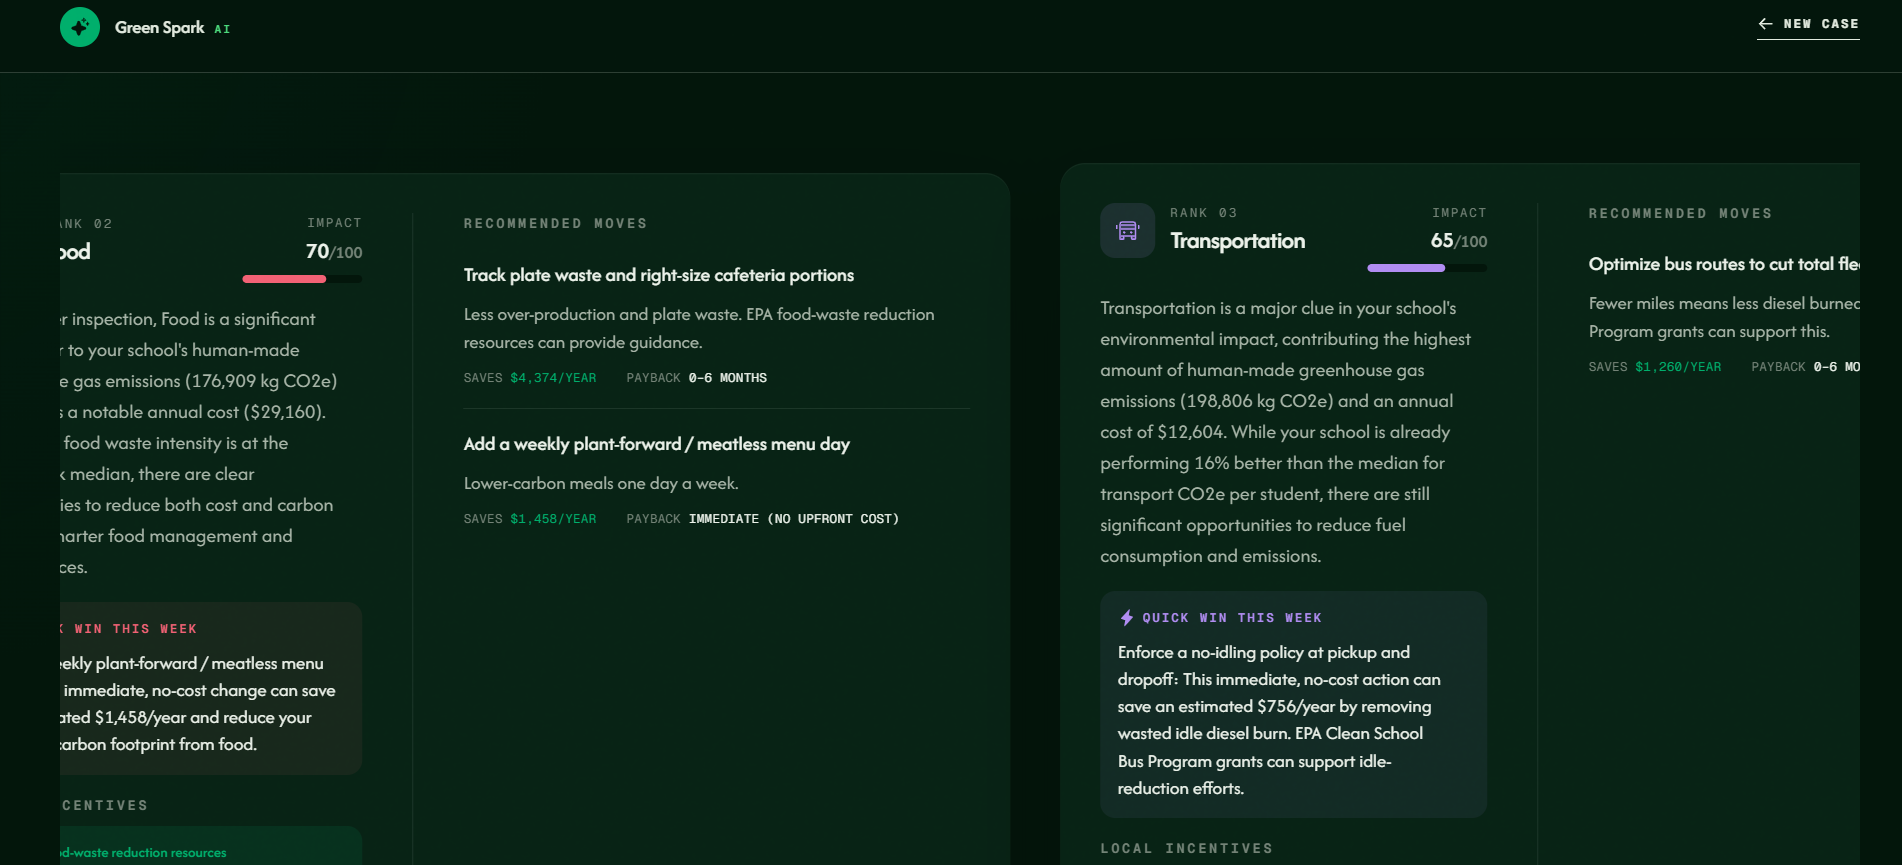
This page ranks the school’s biggest impact areas and recommends specific actions.

Inspiration
81 pounds of food gets scraped into the trash at Hanover High every school day. Nobody in the eco club had ever seen that number, because it never leaves the cafeteria.
That's the whole problem in one stat. The students who most want to cut a school's waste are the ones who never get to see the numbers. The energy, water, waste, and bus data lives on utility bills in a front-office cabinet nobody on the club ever opens. Even when someone does get the bills, it's a pile of figures with no sense of which one actually matters.
We didn't have to imagine this user. We are this user. We've sat in the meeting where everyone agrees the school should do better and nobody can say where to start. Climate action feels huge and far away, but a school's footprint is small and local, and if you can see it, it's fixable. So we built the part that comes after "we should do something."
What it does
Green Spark AI is an environmental detective for one school. You hand it a school's numbers, it works the case, and it gives you a verdict instead of another dashboard.
It lines up the five usual suspects, energy, water, waste, transportation, and food, figures out which ones are doing the most damage, and names the top 3 worth acting on. For each one it gives a plain-English read on what's going on, a dollar saving, a payback time, a CO2 cut, and a free quick win the club can pull off this week. It tells you how confident it is and what it's still guessing at. If a fix qualifies for a real rebate, it names the program.
The point is the verdict. Most tools stop at "here's your data." Ours stops at "here's what to do, and here's the number to walk into the principal's office with."
We picked Hanover High on purpose. We didn't want to demo on a made-up "average school," because the whole point of the brief is to stay local and real. Hanover is a real public high school with enough public data to build an honest case: an enrollment, a real electricity figure, a diesel bus fleet, a New Hampshire grid with actual state rebate programs like NHSaves behind it. It also let us be honest about the gaps. Its square footage isn't public and its cafeteria waste isn't separately measured, which is true of almost every school, so showing how the tool handles missing data on a real example mattered more than picking a school where everything happened to be available.
How we built it
We wrote the data contract first, on day one, so we could build the engine and the interface at the same time without stepping on each other. Then we built the case file in three layers.
A calculator in plain TypeScript turns raw inputs into yearly CO2 and cost, using EPA, DOE, and EIA factors that are each cited. A pattern layer compares the school to a benchmark and to 40 peer schools, flags anything running hot, and scores how much real data there is. Then Gemini reads the whole file and solves the case: it ranks the suspects, picks fixes from a library of real interventions, and matches rebates, all returned as strict JSON we re-check before it reaches the screen.
The rule we never broke: the detective is not allowed to make up a single headline number. The calculator owns the math. Gemini only reasons over the evidence. Our stack was Next.js, TypeScript, and Tailwind, with Gemini 2.5 Flash doing the reasoning.
Challenges we ran into
The biggest one was trust. Early on, the model would happily invent a clean-looking "$4,000 a year" out of thin air. We fixed it by taking the numbers away from the AI entirely. The calculator computes every figure, the model only ranks and explains, and a schema check throws out anything off-contract.
We also switched AI providers partway through. We started on Claude, routed it through a proxy, and eventually moved to Google Gemini for its free tier and built-in structured output, which made our JSON contract far more reliable. Rewiring that mid-build was not fun, but the code came out cleaner.
Then there was confidence. A school with almost no data was coming back sounding totally sure of itself, which is exactly the kind of thing that gets an eco club to waste money. So we built a confidence gate that ties how certain the tool sounds to how much real data backs it, and caps anything we had to estimate. A good detective tells you when the evidence is thin.
And some data just doesn't exist. Hanover's square footage isn't public and its cafeteria waste isn't separately measured. Instead of faking it, we estimated from benchmarks and labeled every estimate as an estimate.
Accomplishments that we're proud of
It works end to end, and it works instantly on a real school. No setup, no private records, no waiting.
We're proudest that the responsible-AI part isn't a paragraph we tacked on at the end. It's built into how the thing runs. The detective can't hallucinate the numbers because it never touches them, and it can't oversell thin data because the confidence gate won't let it.
We also killed a feature we liked. We wanted users to photograph a utility bill, but that's exactly the kind of private data the brief warns against, so we cut it. Saying no to our own idea felt like the right call.
And we built an offline version that gives the same kind of result with no API key, so a live demo never blanks out on stage.
What we learned
The brief said it plainly and it stuck with us: a chart is not AI. The value isn't showing the data, it's reasoning over it and telling someone what to actually do.
We learned that money is the hook. A school doesn't move on "this is bad for the planet." It moves on "this saves $3,000 and pays for itself in a year." Framing every fix as savings and payback changed the whole tool.
And we learned how to make an LLM behave: give it computed evidence instead of raw questions, force its output into a fixed shape, and check that shape before you trust a word of it.
What's next for Green Spark AI
Deploy it publicly so any eco club can open it in a browser. Finish the path where a school types in real bill numbers and watches its confidence climb from Low to High as it replaces estimates with measurements. Grow the peer dataset toward real district data, and add more interventions and rebates by region so the advice fits wherever the school actually is.
The real next step is offline, though. We want to put Green Spark in front of an actual eco club and a real facilities manager and see if it gets one project funded. For years our club could say "we should do something." We finally built the part that says: here's what, here's the cost, let's do it.
Built With
- css3
- geminiapi
- gsap
- json
- motion
- next.js
- node.js
- react
- recharts
- typescript

Log in or sign up for Devpost to join the conversation.