Inspiration
Every evening the same sound fills Nigerian streets: generators. A typical home runs a 3 kVA petrol generator for hours a day, breathing in the exhaust and paying for it one jerrycan at a time, so the real cost is never added up. Then every rainy season the same drains overflow with plastic bottles, sachets and nylon, and ordinary rain turns into floods that ruin shop goods and block roads.
People already know generators are dirty and plastic is bad. Awareness isn't the gap. What's missing is a tool that answers three simple questions: how much is this costing me, where is the risk, and what should I do next? We wanted to build that tool for Nigerian homes and communities.
What it does
Green Shift Nigeria is a single web page with three working tools:
- Power Shift: enter your state, generator size, daily hours and petrol price. It shows your monthly fuel bill, litres burned, CO₂ released per year, and how many trees it would take to absorb it. A 5-year chart shows when solar breaks even. For a 3 kVA generator running 8 hours a day at ₦900/L, that's about ₦217,728 a month, 6.7 tonnes of CO₂ a year, and a solar payback of about 2.1 years. It also gives safety tips for your state and links to local solar installers.
- DrainGuard: residents report a blocked drain with a photo, a blockage level and notes. A transparent risk score combines how blocked the drain is with how soon heavy rain is due, and ranks corridors so cleanup crews go where flooding is most likely first. Toggling the rain forecast re-ranks the queue, and dispatching a crew marks the drain cleared and adds to a running total of waste removed.
- Loop & Lean: pick an everyday choice (repair instead of replace, a reusable bottle, a shorter shower, cold-water laundry, bringing your own container, washing in a basin) and how often you do it. It shows the water, energy, waste and CO₂ saved per week and per year.
It ends with an eight-step household checklist that saves your progress, clear generator safety guidance (including the 112 emergency number), and an open assumptions panel where anyone can change the numbers behind every calculation.
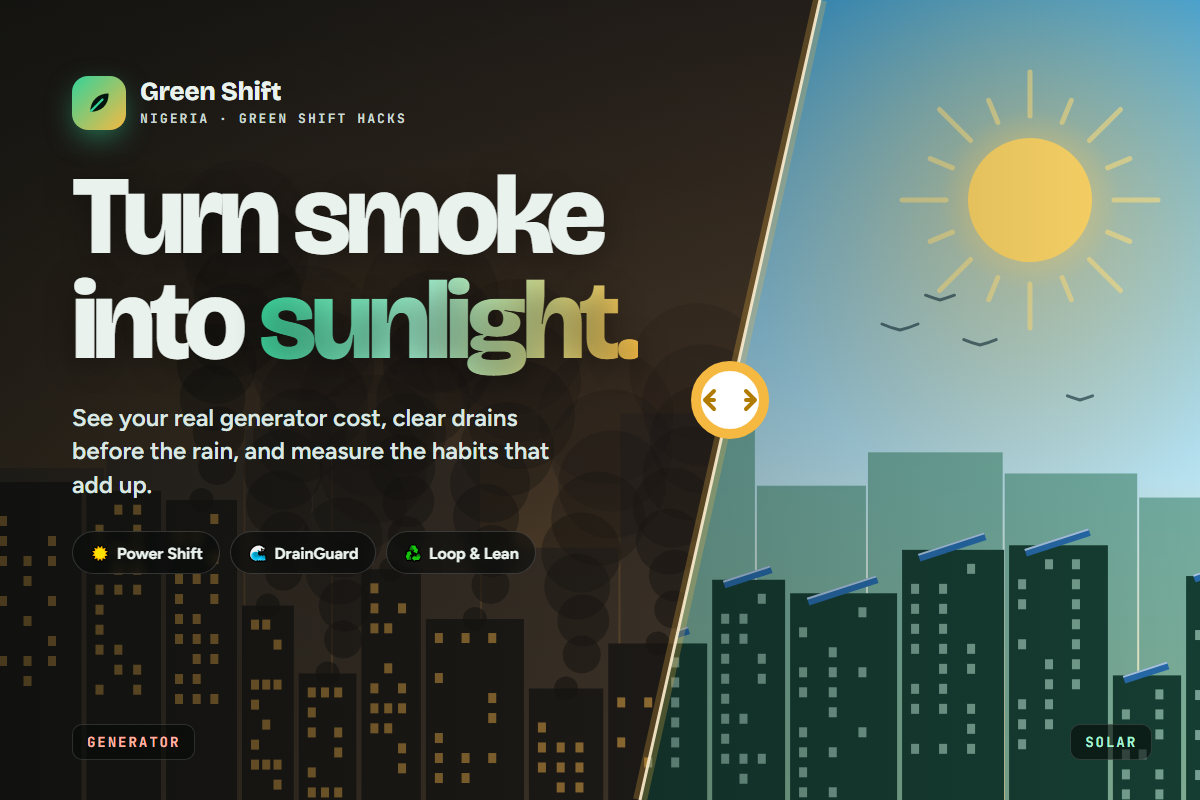
The opening scene shows the whole idea in one gesture: drag a slider and an animated Nigerian skyline shifts from generator smoke to solar sunlight.
How we built it
We built it with plain HTML, CSS and JavaScript, with no frameworks and no backend, so it loads fast and works on any phone browser.
- Canvas 2D draws the animated city. One value (0 = generator, 1 = solar) blends the sky colour, smoke puffs, rooftop solar panels and birds.
- Inline SVG draws the cost chart, the impact score rings, and a stylised map of Nigeria for the DrainGuard flood-risk radar.
- Simple, documented formulas power every number. For example: litres per month = kVA × 0.48 load factor × hours × 0.7 L/kWh × 30, and drain risk = blockage % × 6.5 + rain urgency × 3.5. Peak sun hours are grouped into four regions from the far north to the coast.
- IntersectionObserver and the Web Animations API handle scroll reveals, animated counters and the checklist celebration. The page respects "reduce motion" settings.
- localStorage keeps checklist progress on the user's own device.
We started from four separate drafts (a generator calculator, a drain-risk dashboard, a habit calculator and a hazard visualisation) and merged them into one consistent design.
Challenges we ran into
- Keeping the numbers honest. It's easy to make a climate app look impressive with big made-up figures. We kept every result tied to a stated formula, labelled simulated data and illustrative indicators clearly, and made the assumptions editable instead of hiding them.
- Getting the science right. An early draft claimed generator exhaust "depletes the ozone layer". That isn't accurate, so we reworded it around what generators actually do: carbon monoxide, fine particles, and ground-level ozone (smog).
- Dropping an insecure shortcut. One draft stored an AI API key in the browser with simple encoding labelled as "encryption". Anyone opening the page could have read it, so we removed it rather than ship something misleading. Real image analysis needs a proper backend, and that's on our roadmap.
- Merging four designs into one. Each draft had its own colours, fonts and styles. Bringing them into one dark, cohesive theme without losing what made each tool useful took several rounds.
- Mobile performance. The animated city, radar sweep and rain effects had to stay smooth on phones, so the canvas pauses when it's off-screen and heavy effects stay light.
Accomplishments that we're proud of
- A complete, working prototype with three interactive tools on one page, not just mock-ups.
- Results that are explainable: every number has a visible formula and editable assumptions.
- Zero data collection: no sign-up, no tracking, no API keys, and nothing typed or uploaded leaves the browser.
- A Nigeria-specific experience: naira, local petrol prices, all 36 states plus the FCT, and real cities like Awka, Lagos, Ibadan, Port Harcourt and Kano.
- The opening "smoke into sunlight" slider, which makes the whole idea clear in a couple of seconds.
- A responsive, accessible design that works from small phones to desktops.
What we learned
- People act on numbers they recognise. "₦217,728 a month" lands much harder than an abstract CO₂ figure, so cost comes first and carbon second.
- Transparency builds trust. Showing the formula and letting people change the assumptions makes an estimate more believable, not less.
- Timing matters for flooding. A drain's risk depends on how soon the rain arrives as well as how blocked it is, and that framing turns a cleanup list into a priority queue.
- Small habits need a scoreboard. Turning weekly actions into yearly totals makes them feel worth doing.
- Simple tech goes a long way. Plain HTML, CSS and JavaScript was enough to build something fast, shareable and easy to host anywhere.
What's next for Green Shift Nigeria
- Real drain photo analysis through a secure backend, so the AI estimates blockage from the photo, with no keys exposed in the browser.
- Live rainfall forecasts from a weather service, so DrainGuard's risk score uses real conditions.
- Shared community reporting, so residents and LGA sanitation teams see the same map, track cleanups and measure response times.
- New modules: AquaWatch (water-leak reporting), FoodLoop (surplus food rescue), ReBuild (a local repair network) and MaterialMind (a marketplace for construction scrap).
- A pilot with one market area and its LGA to measure real outcomes: drains cleared, kilograms of waste removed, and households that switch to solar.

Log in or sign up for Devpost to join the conversation.