Inspiration
The inspiration for GreenMeter came from the increasing need to understand everyday carbon emissions. We all use appliances daily, but very few know the actual environmental impact. Rising electricity bills, climate anxiety, and global warming motivated me to create a simple tool that uses technology to make sustainability easy, measurable, and achievable.
GreenMeter was inspired by one idea:
\textbf{“Small data-driven changes can create large environmental impact.”}
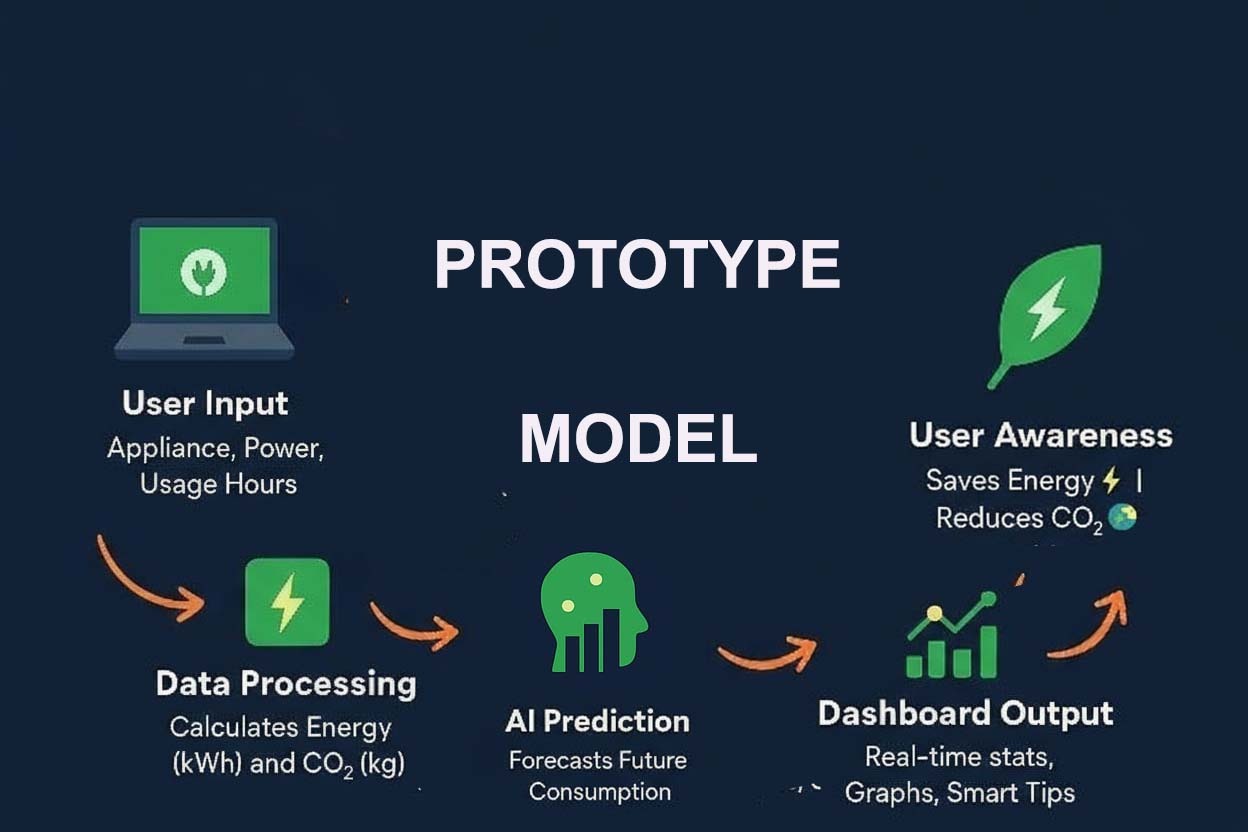
What it does
GreenMeter is a smart carbon footprint tracker that calculates and visualizes the CO₂ emissions produced by daily appliance usage.
It provides:
📊 CO₂ calculation using a custom formula
⚙ Energy consumption estimation
🌡 Mood-based CO₂ variation
🧠 Smart AI-like Green Score
🌳 Virtual forest growth based on CO₂ saved
📉 Graphs for trends & per-device analysis
🔔 Alerts for high usage
🏅 Titles like Environment Hero or High CO₂ Emitter
How we built it
PYTHON
Matplotlib for visualization
JSON for local storage
Custom algorithms to calculate CO₂ emissions
AI-style scoring logic to reward or warn users
Console-based interaction for simplicity and universal access
Core CO₂ Equation:
\text{CO₂} = \text{Device Rate} \times \text{Hours Used} \times \text{Mood Factor} \times \text{Power Source Factor}
Green DNA Score:
\text{Green Score} = 100 - (6 \times \text{Total CO₂}) - \text{AC Penalty} + \text{Solar Boost}
We designed everything to be lightweight but powerful.
Challenges we ran into
Designing formulas that are simple yet mathematically meaningful
Visualizing data cleanly inside Colab
Handling multiple device inputs and error cases
Creating AI-like scoring without using machine learning
Storing and retrieving session history with JSON
Motivating users without overwhelming them
Ensuring calculations remained accurate across all appliances
Accomplishments that we're proud of
Developed a fully functional CO₂ tracking system
Built real-time charts and device-level analytics
Implemented motivational features like:
🌳 Virtual Forest
🧬 Green DNA Score
🏅 Environment Hero badge
Successfully stored long-term history in JSON
Created smart energy-saving tips for every device
What we learned
Mathematical modeling of carbon emissions
Visual data representation using plots
How user motivation increases with gamification
How small changes in appliance usage can significantly reduce CO₂
Working with Python’s I/O, JSON handling, and plotting
A key learning:
\text{“Awareness = The first step toward climate action.”}
What's next for Green Meter Smart Carbon Footprint Tracker
📱 Android/iOS mobile app
🔌 IoT integration with smart plugs
🧠 AI-based forecasting of future CO₂
🎖 Advanced reward system (levels, badges, streaks)
🌍 Community leaderboard for green challenges
🏡 Smart daily routine suggestions
☁ Cloud-based dashboard
Built With
- and-ai-model)-development-platform:-google-colab-(for-coding
- and-ml-training)-libraries-&-frameworks:-pandas
- data-analysis
- machine-learning
- matplotlib
- numpy
- pandas
- programming-language:-python-(for-logic
- scikit-learn

Log in or sign up for Devpost to join the conversation.