-
-
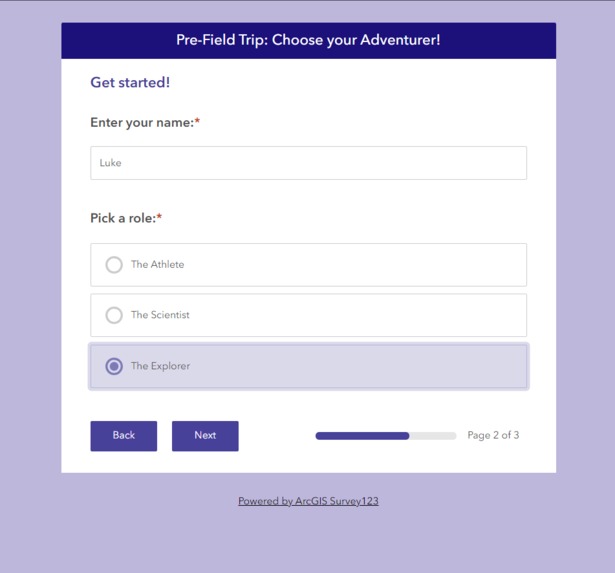
(1a) Pre-Field Trip Student Survey 1
-
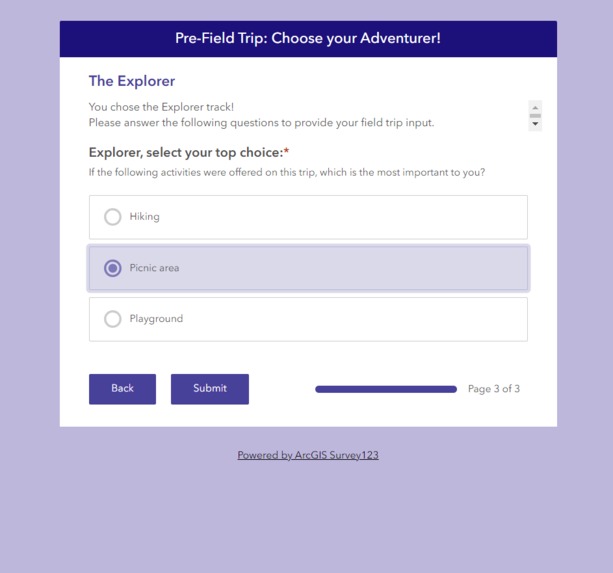
(1a) Pre-Field Trip Student Survey 2
-

(1b) Pre-Field Trip: Student Feedback Data: (Teacher Dashboard)
-
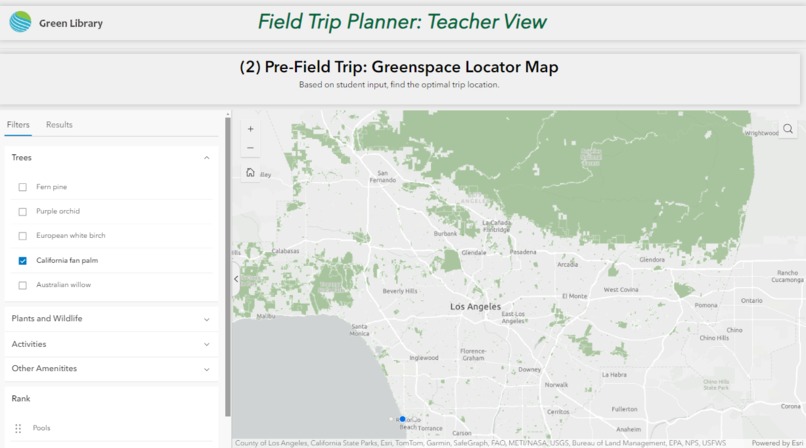
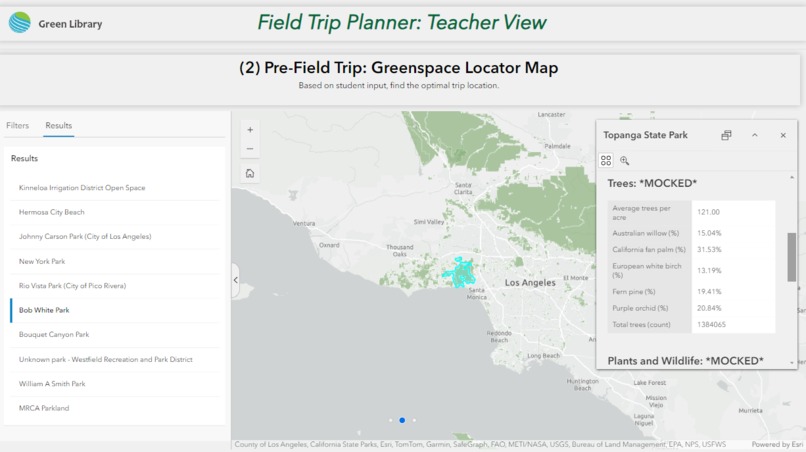
(2) Pre-Field Trip: Greenspace Locator Map 1
-
(2) Pre-Field Trip: Greenspace Locator Map 2
-
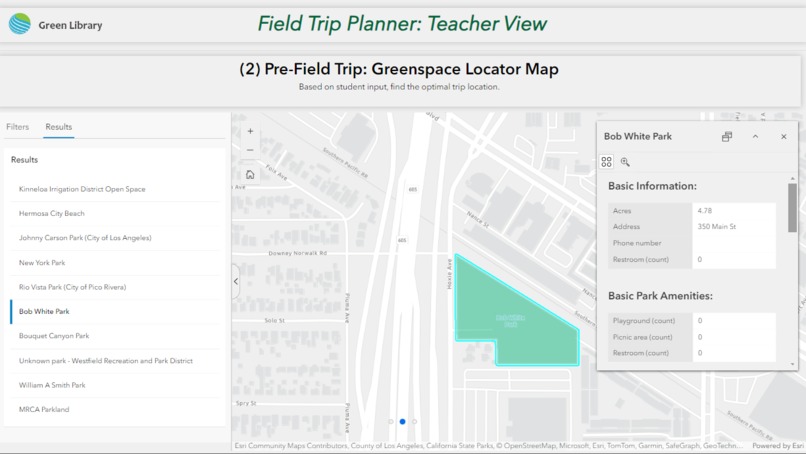
(2) Pre-Field Trip: Greenspace Locator Map 3
-
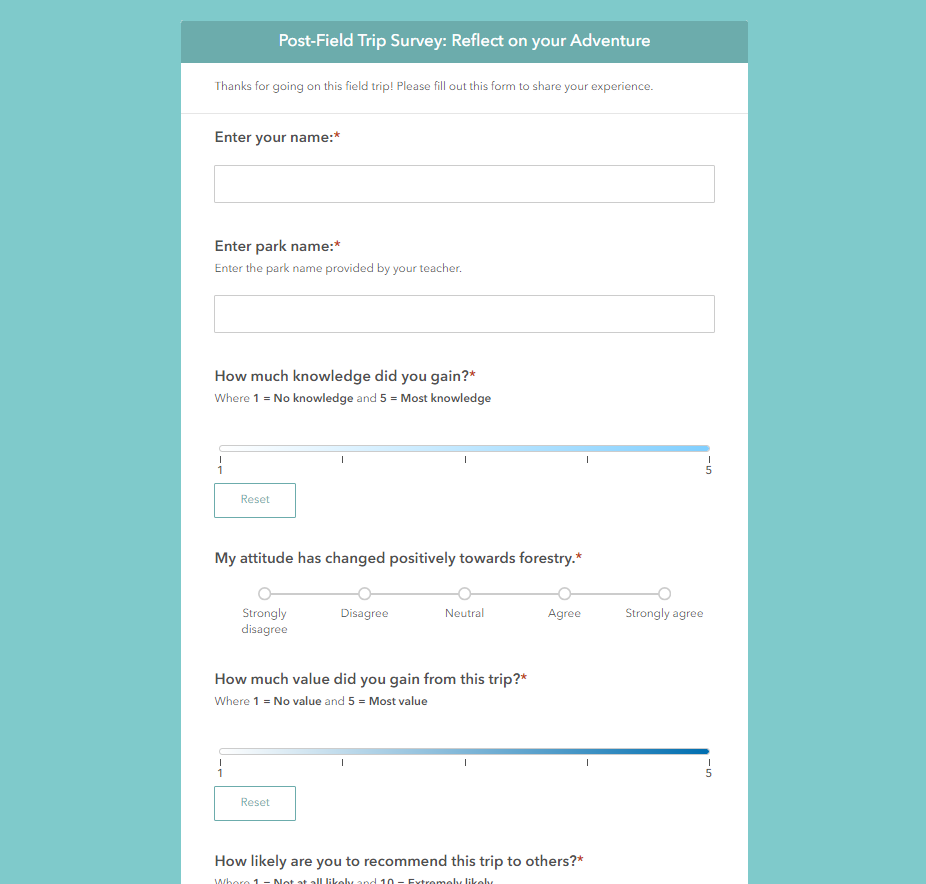
(3a) Post-Field Trip Student Survey:
-
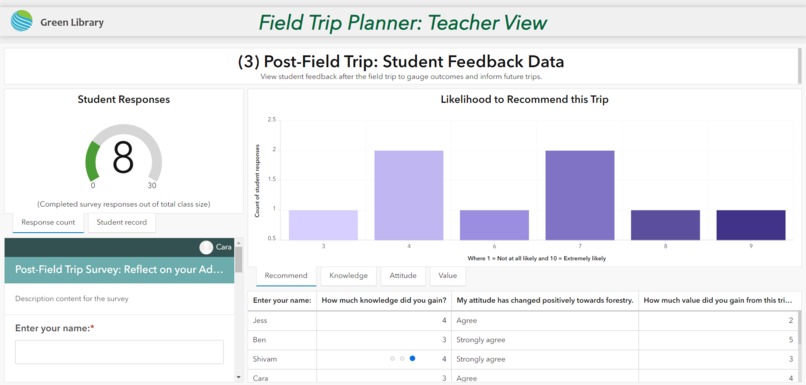
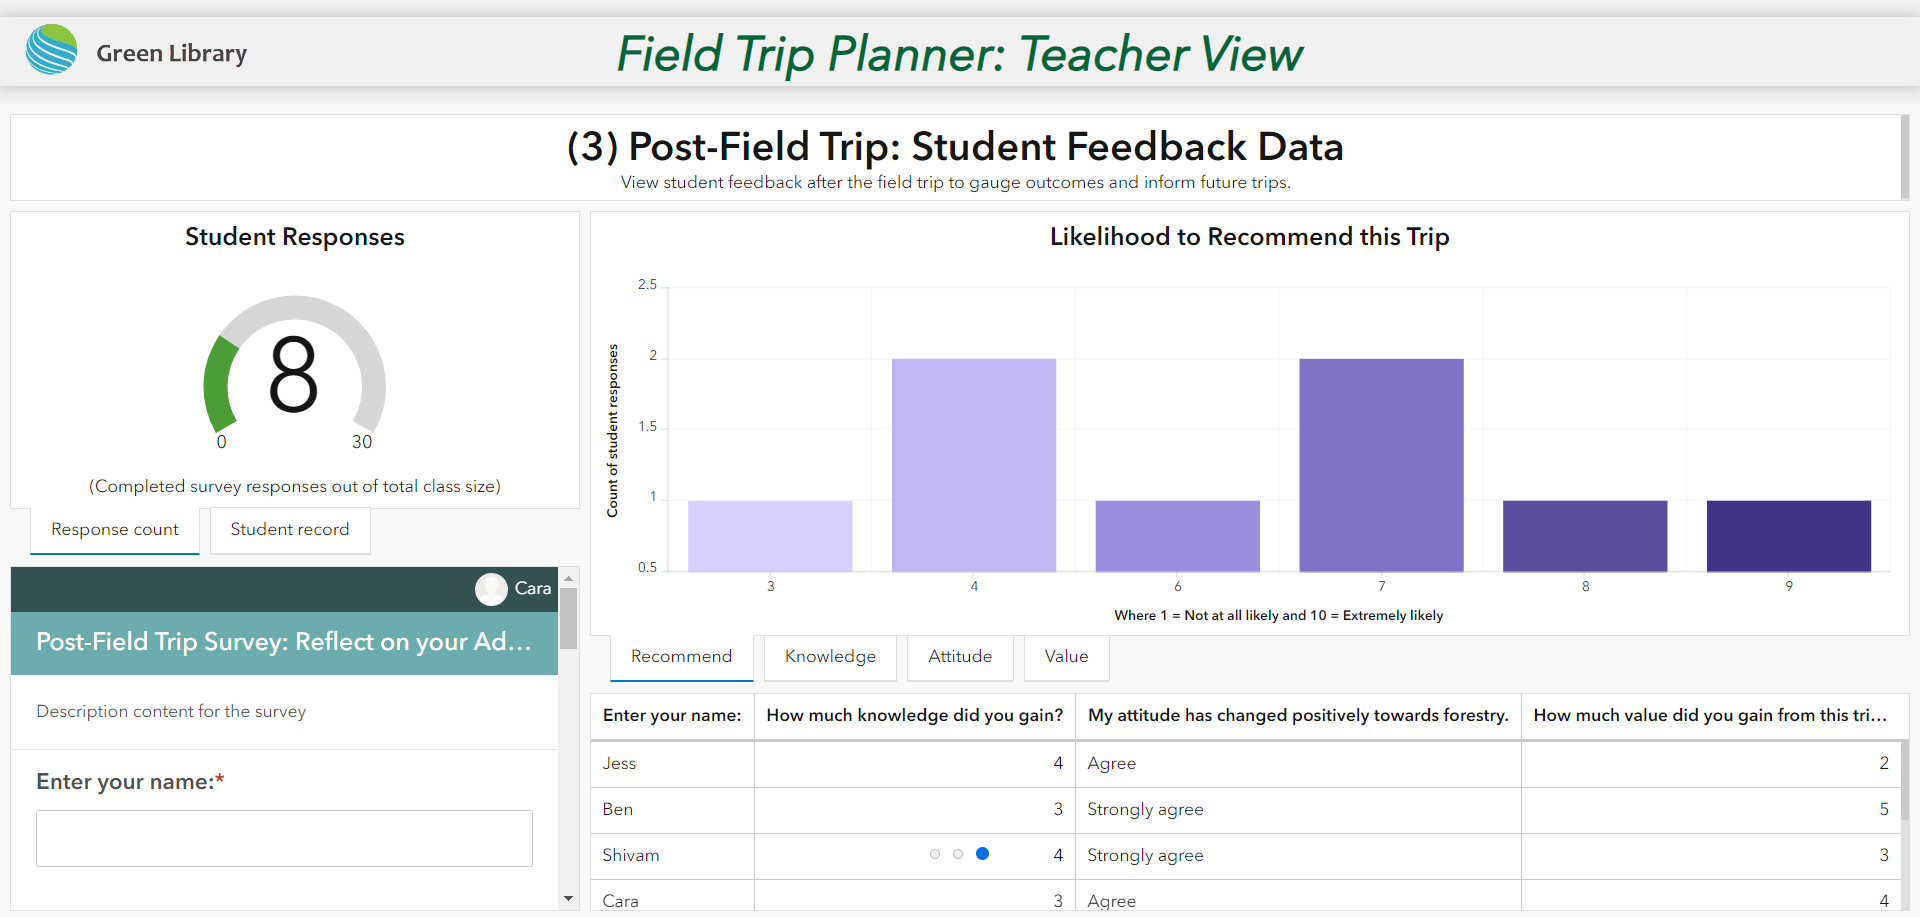
(3b) Post-Field Trip: Student Feedback Data: (Teacher Dashboard)
-

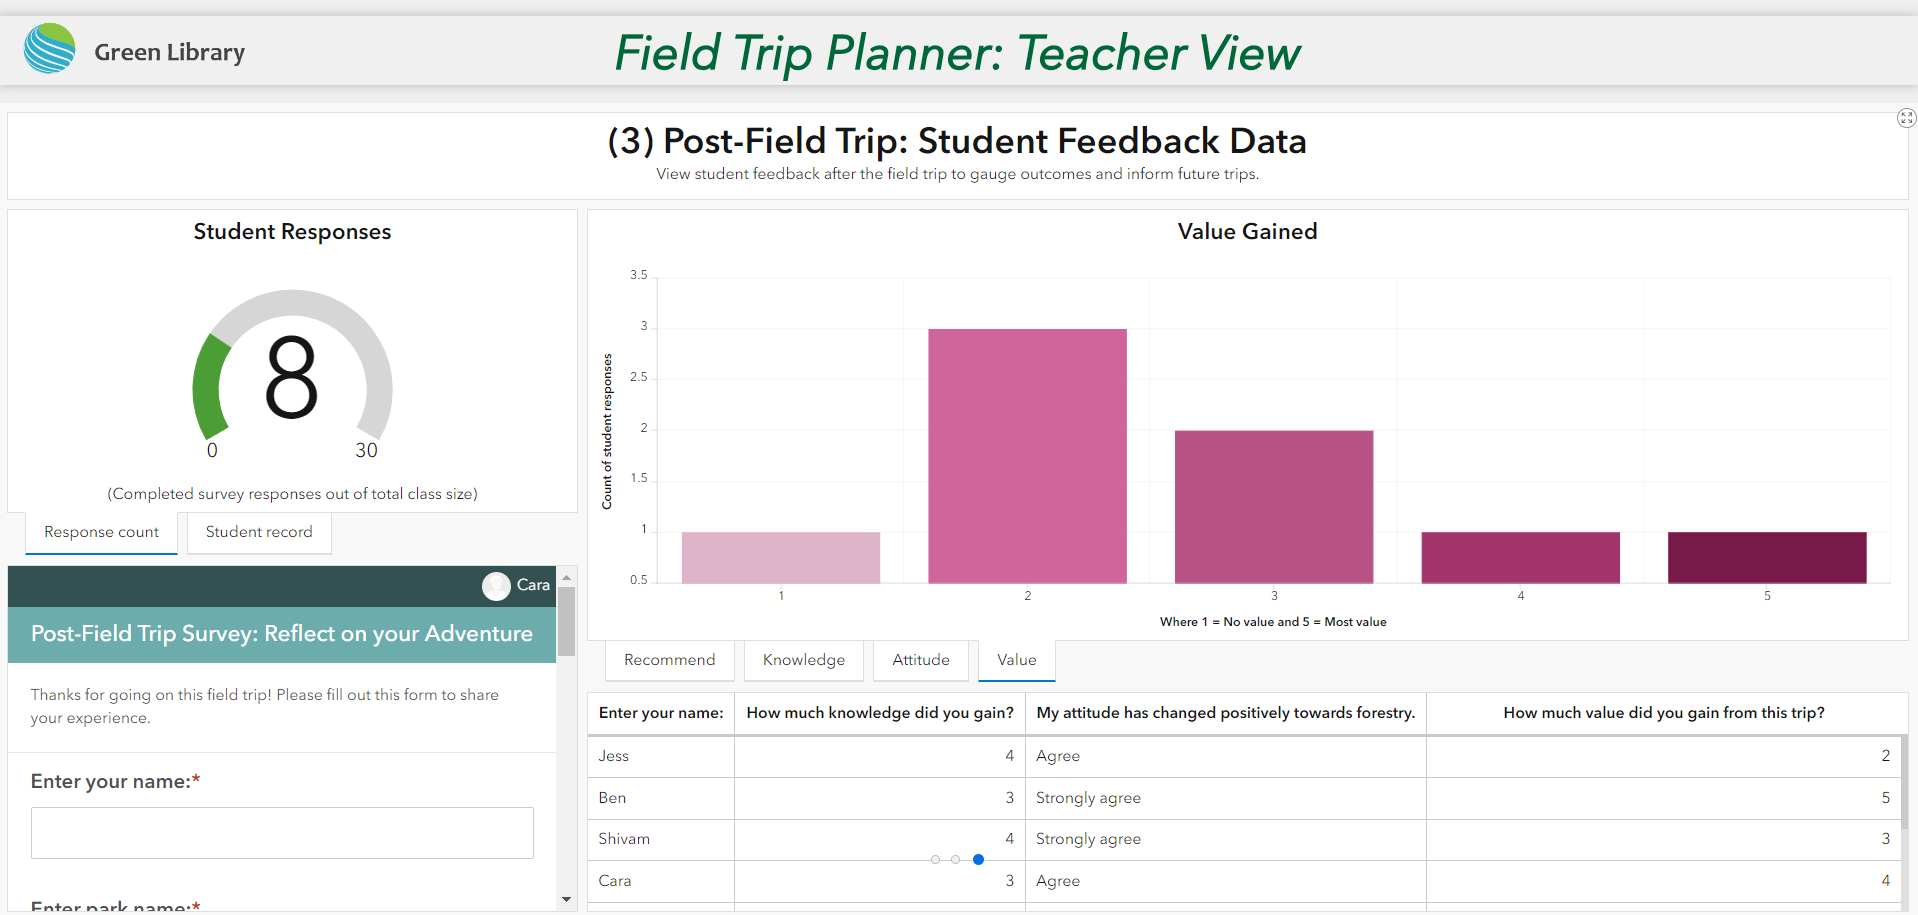
(3b) Post-Field Trip: Student Feedback Data: (Teacher Dashboard)

Inspiration
Education is a means to change. Teachers need tools to engage students and expose them to their environment effectively. Green Library equips teachers with the tools to plan effective, educational, student-tailored outdoor field trips. The Green Library pairs the power of data and user input to support informed decision-making for middle school teachers planning field trips.
Students want to spend more time outdoors, due to the increasingly digitalized world we live in. However, many students have a lack of awareness of their region's accessible, outdoor areas and activities—which results in a lack of exposure to the outdoors. When students spend less time outside, they have less knowledge and connection to their environment and their impact upon it. Teachers can aid in removing this barrier by planning engaging outdoor field trips. When students spend time outside doing activities they are about, they gain knowledge and familiarity with the environment. This comfort and connection to the planet may lead students to be conscious and passionate about their environmental impact.
What it does
The program is organized into 3 phases...
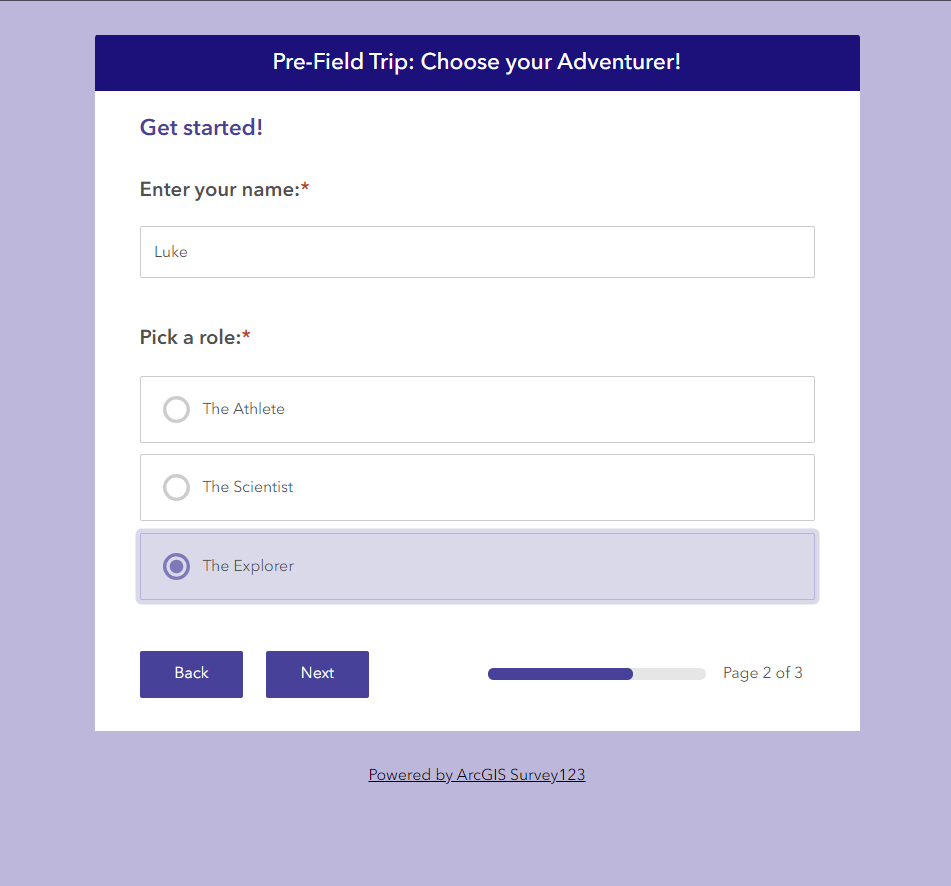
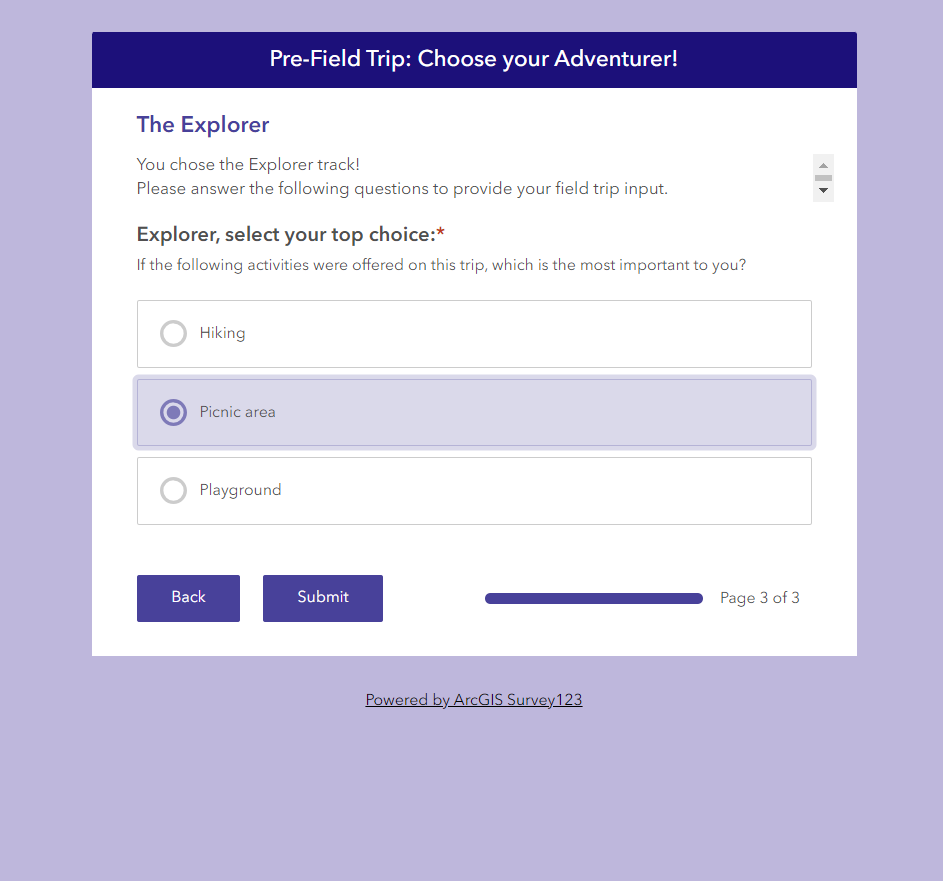
(1a) Pre-Field Trip Student Survey: To start the planning process, student interest and engagement is centered. This student-first approach prioritizes students' wants on their greenspace-centered field trips for a streamlined and engaging experience.
Students are prompted to choose a role type; currently supported roles include The Athlete, The Scientist, and The Explorer. After selecting an explorer role, the student is sent to a new question asking about their specific explorer's preference. Athletes are asked about sports facilities, scientists are asked about the ecosystem, and so on. From here the survey responses are recorded and we move on to the teacher view.
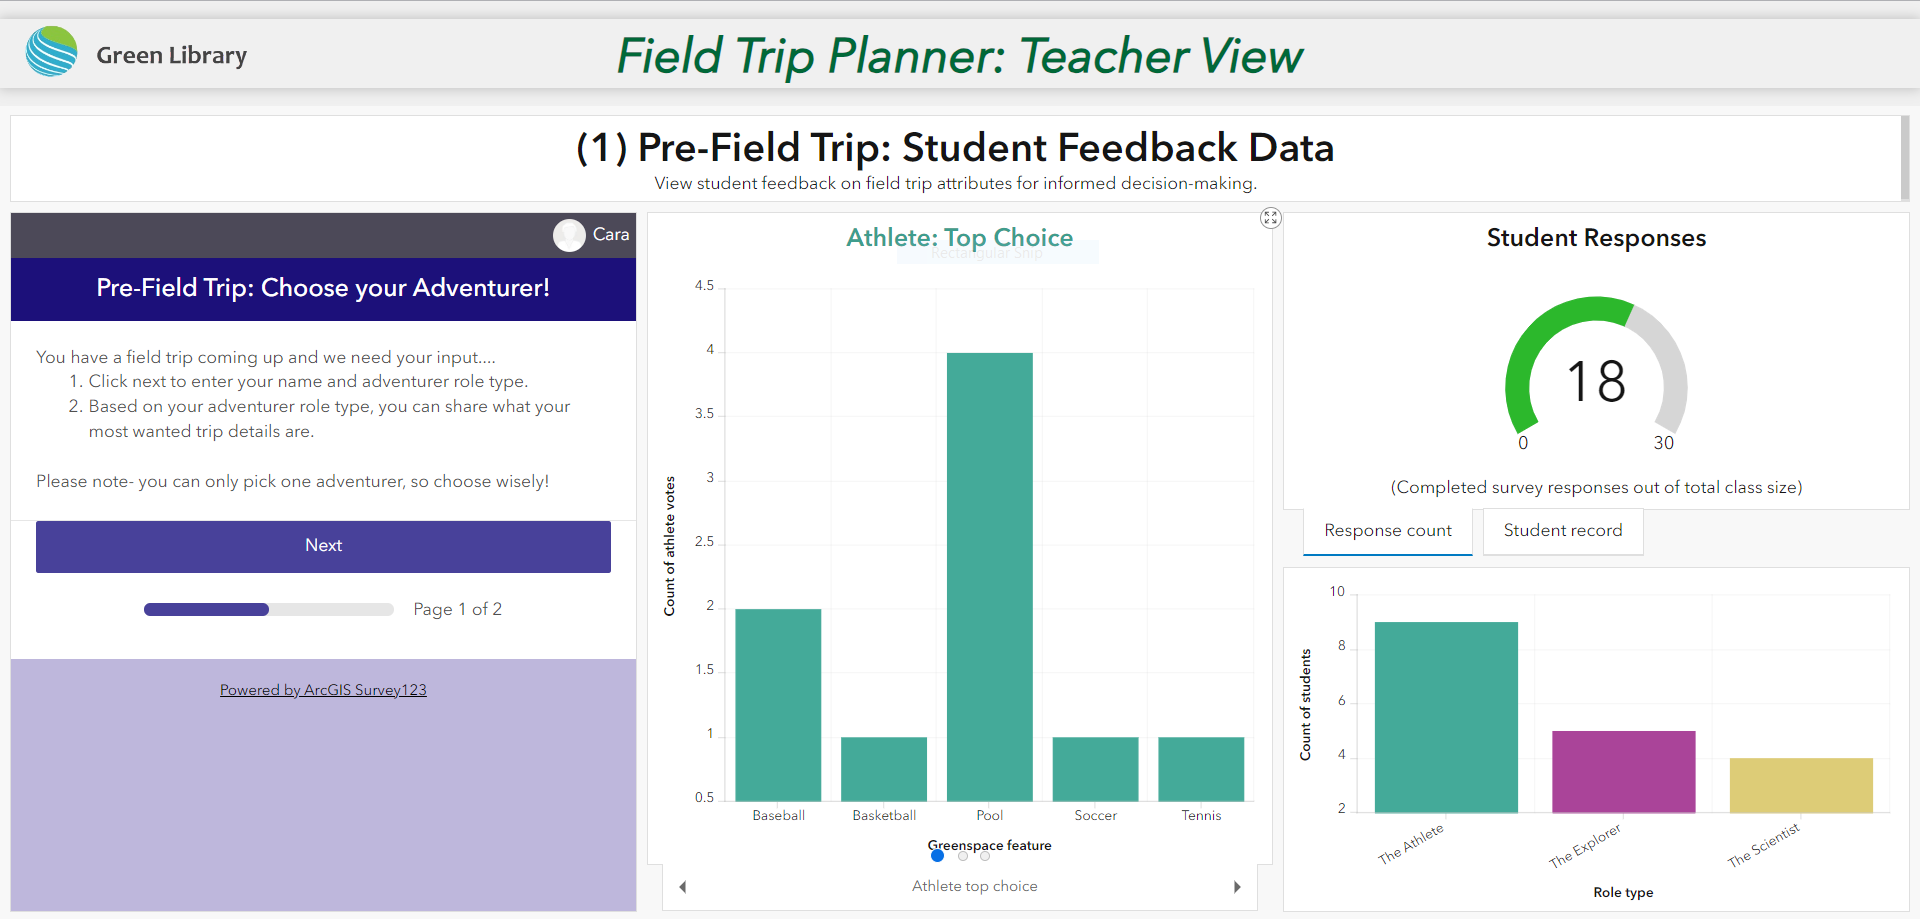
(1b) Pre-Field Trip: Student Feedback Data: (Teacher Dashboard) In real-time, teachers can view the "Pre-Field Trip: Student Feedback Data" Dashboard. This dashboard provides the foundation and visualization of student preferences. Understanding student preferences allows teachers to plan field trips that meet student expectations and are subsequently more successful. Likewise, clear visualizations allow teachers to quickly understand their entire class's preferences at a glance. This knowledge informs the teacher's criteria for the greenspace and proves student interest/value for funding applications and administration.
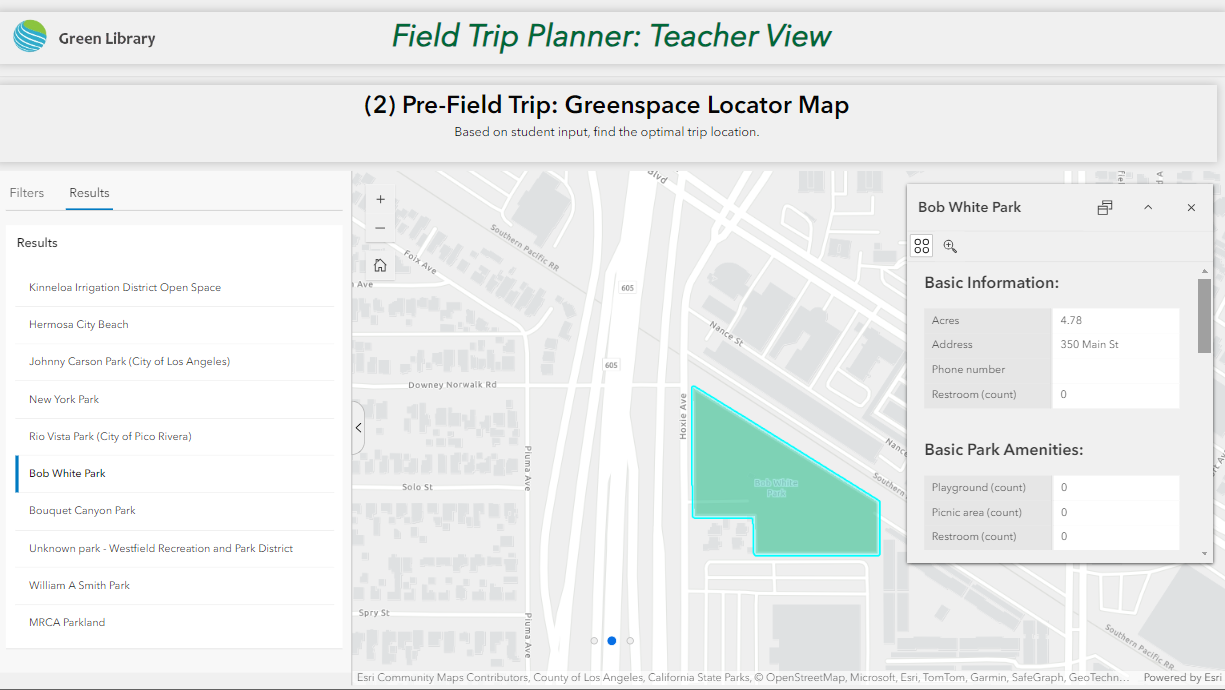
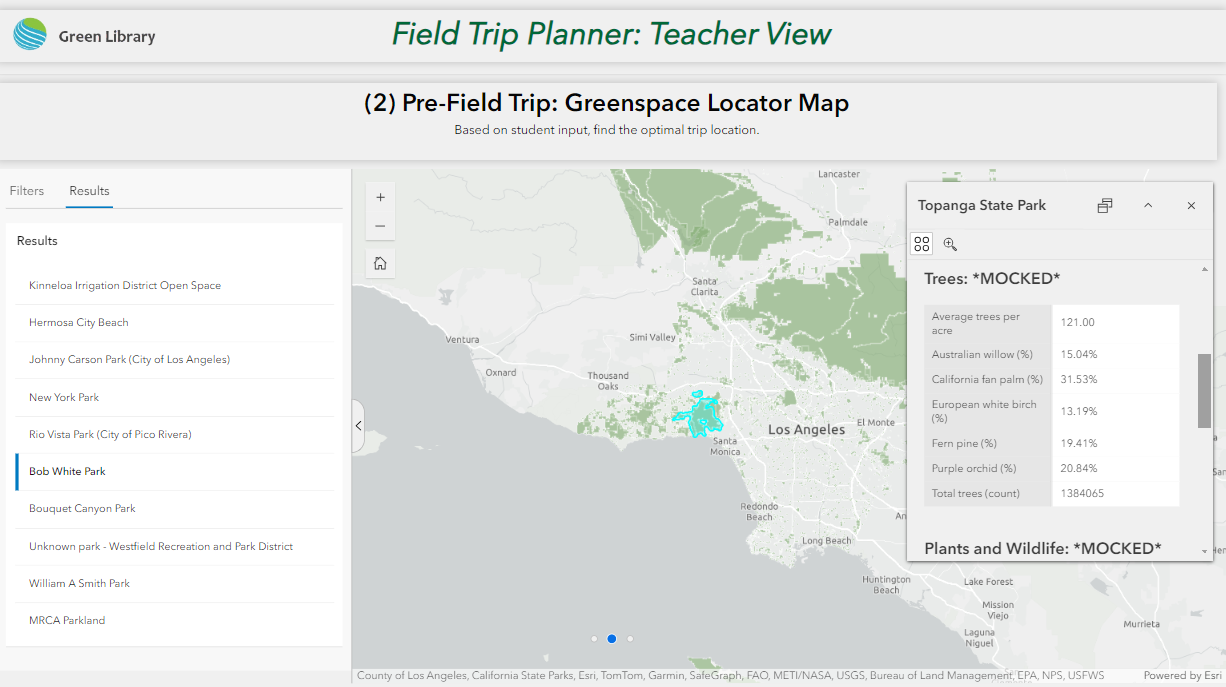
(2) Pre-Field Trip: Greenspace Locator Map Now that the teacher has gained insight into student preferences from the survey and dashboard, they can search for the best-suited greenspace in Los Angeles County. Using customized filtering and park feature ranking, teachers can quickly populate matching greenspaces for their field trip needs. In moments, the teacher can pick a greenspace that fits all of their needs and their students' wants. After picking a location, it's time for the trip!
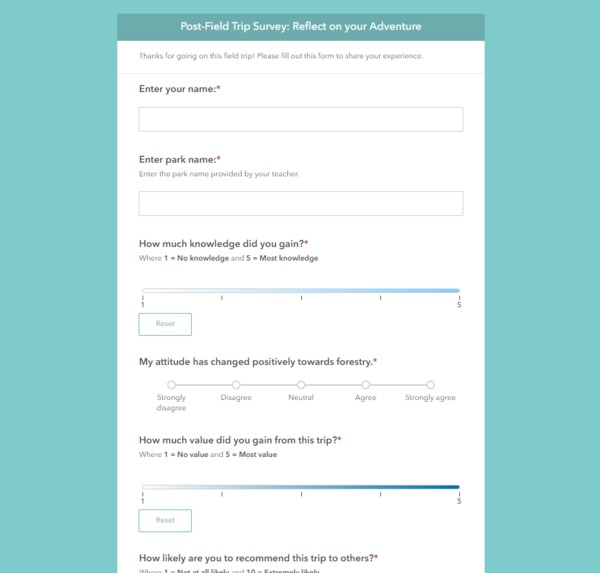
(3a) Post-Field Trip Student Survey: The Green Library doesn't stop when the field trip ends, students are sent a final survey about their perception of the trip. Students are asked 4 short questions about their experience and then it's sent to the teacher.
(3b) Post-Field Trip: Student Feedback Data: (Teacher Dashboard) Again, in real-time, teachers can view the "Post-Field Trip: Student Feedback Data" Dashboard. This data and concise visual summary provides a review of the greenspace and teacher lesson plan. This consideration provides vital real-world experiences to better inform and improve future field trips.
How we built it
All surveys were built using Survey123 and linked with Dashboards in ArcGIS Online. The Greenspace Locator Map was made in ArcGIS Pro, ArcGIS Online Map Viewer, and Microsoft Excel. Mocked data is noted in the program and all other information came from LA County's GIS portal. Custom Experience Builder widgets were configured using Typescript and ranking systems were defined for scoring destinations based on preference. All of this is tied together in Experience Builder by embedding the 2 dashboards and the map/filter page.
Challenges we ran into
Building our custom widget, we had issues with functionality due to feature layer problems.
Accomplishments that we're proud of
Real-time dashboards make understanding a vast amount of student preference information easy to understand. We are proud of the quick, dynamic interface designed for teachers. By taking the time to standardize and clean our greenspace attribute data, we were able to build a sophisticated sorting and ranking system. This provides a simple filter section that teachers can use to specify their needs and find results with ease and efficiency.
What we learned
Developers: "Working in tandem can be challenging. We learned that we really had to have a clear vision for what we wanted to develop so we could efficiently communicate what we were building when we split up the workflow. From rendering issues with Experience Builder with our custom widget to figuring out how to grab graphic information for having zoom to features where parts of the map are moved to based off of widget actions we had our hands full." Geographer: "Building data from the ground up using Survey123 was challenging. I had to keep a big picture view of the data visuals I wanted to produce and what would best inform the teacher. Overall, this ability to 'see the forest' instead of 'being in the trees' was an important perspective to keep in mind. Especially in such a short time frame, the goal and functionality needed to be prioritized so getting stuck in the weeds was sometimes needed but time-consuming."
What's next for Green Library
- More customizable presets for adventurer roles to suit student needs: this may include The Historian or The Environmentalist. This would also expand greenspace attributes to include other information. Historians may be interested in Indigenous reserves and other historical contexts related to the space. Environmentalists may be interested in Urban Heat Islands, biodiversity, and more. In the wake of climate change and social justice, an interdisciplinary approach to education is vital. Field trips that cover these topics give students experiences and connections to their world and the real-world problems we face.
- Export dashboard content into a funding/trip request application to send to school administrators. Automating this experience can save teachers a significant amount of time and allow for more trips to be approved and supported.
- Routing information for teachers to organize transportation and other travel logistics. This would speed up the process of picking a greenspace by providing a distance and travel time parameter.
Data Links
https://data.lacounty.gov/datasets/638250cc420a45f7ac1c8f0e1f66a2e1_0/explore?location=34.098769%2C-118.229720%2C8.97
https://egis-lacounty.hub.arcgis.com/datasets/lacounty::countywide-multi-use-trails-hosted-public/explore?filters=eyJoaWtpbmciOlsieWVzIl19
Built With
- calcite
- esri
- react
- typescript


Log in or sign up for Devpost to join the conversation.