-
-

-
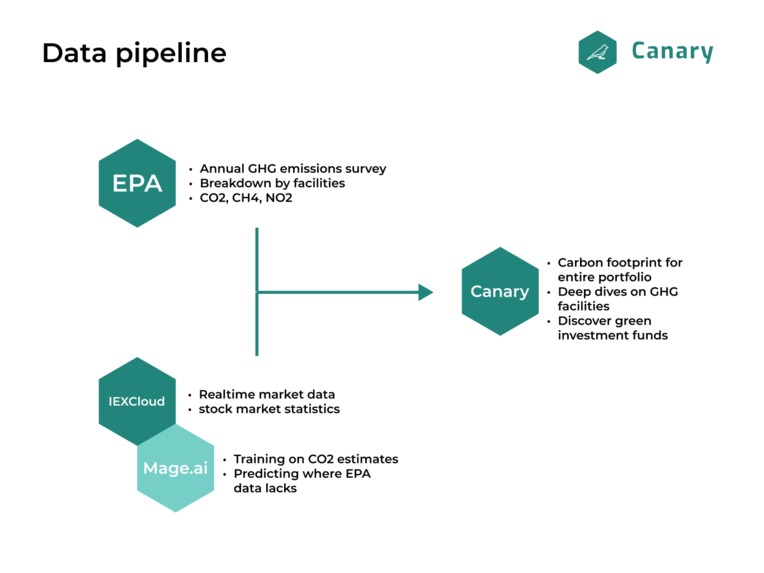
A brief overview of our data pipeline
-
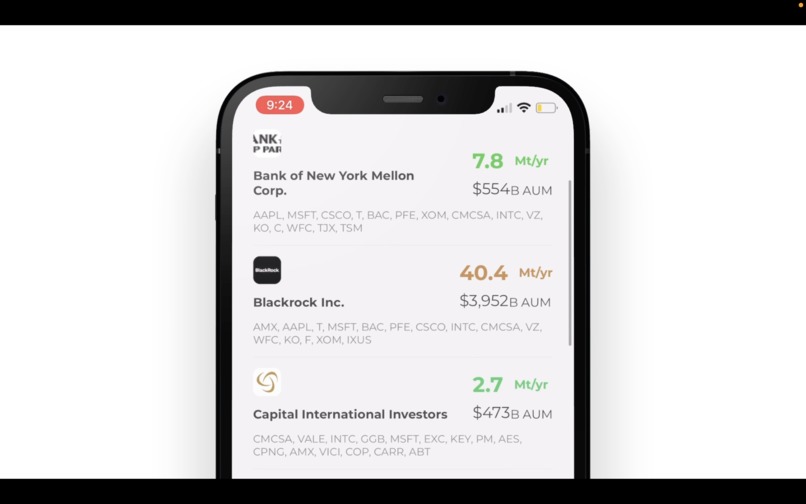
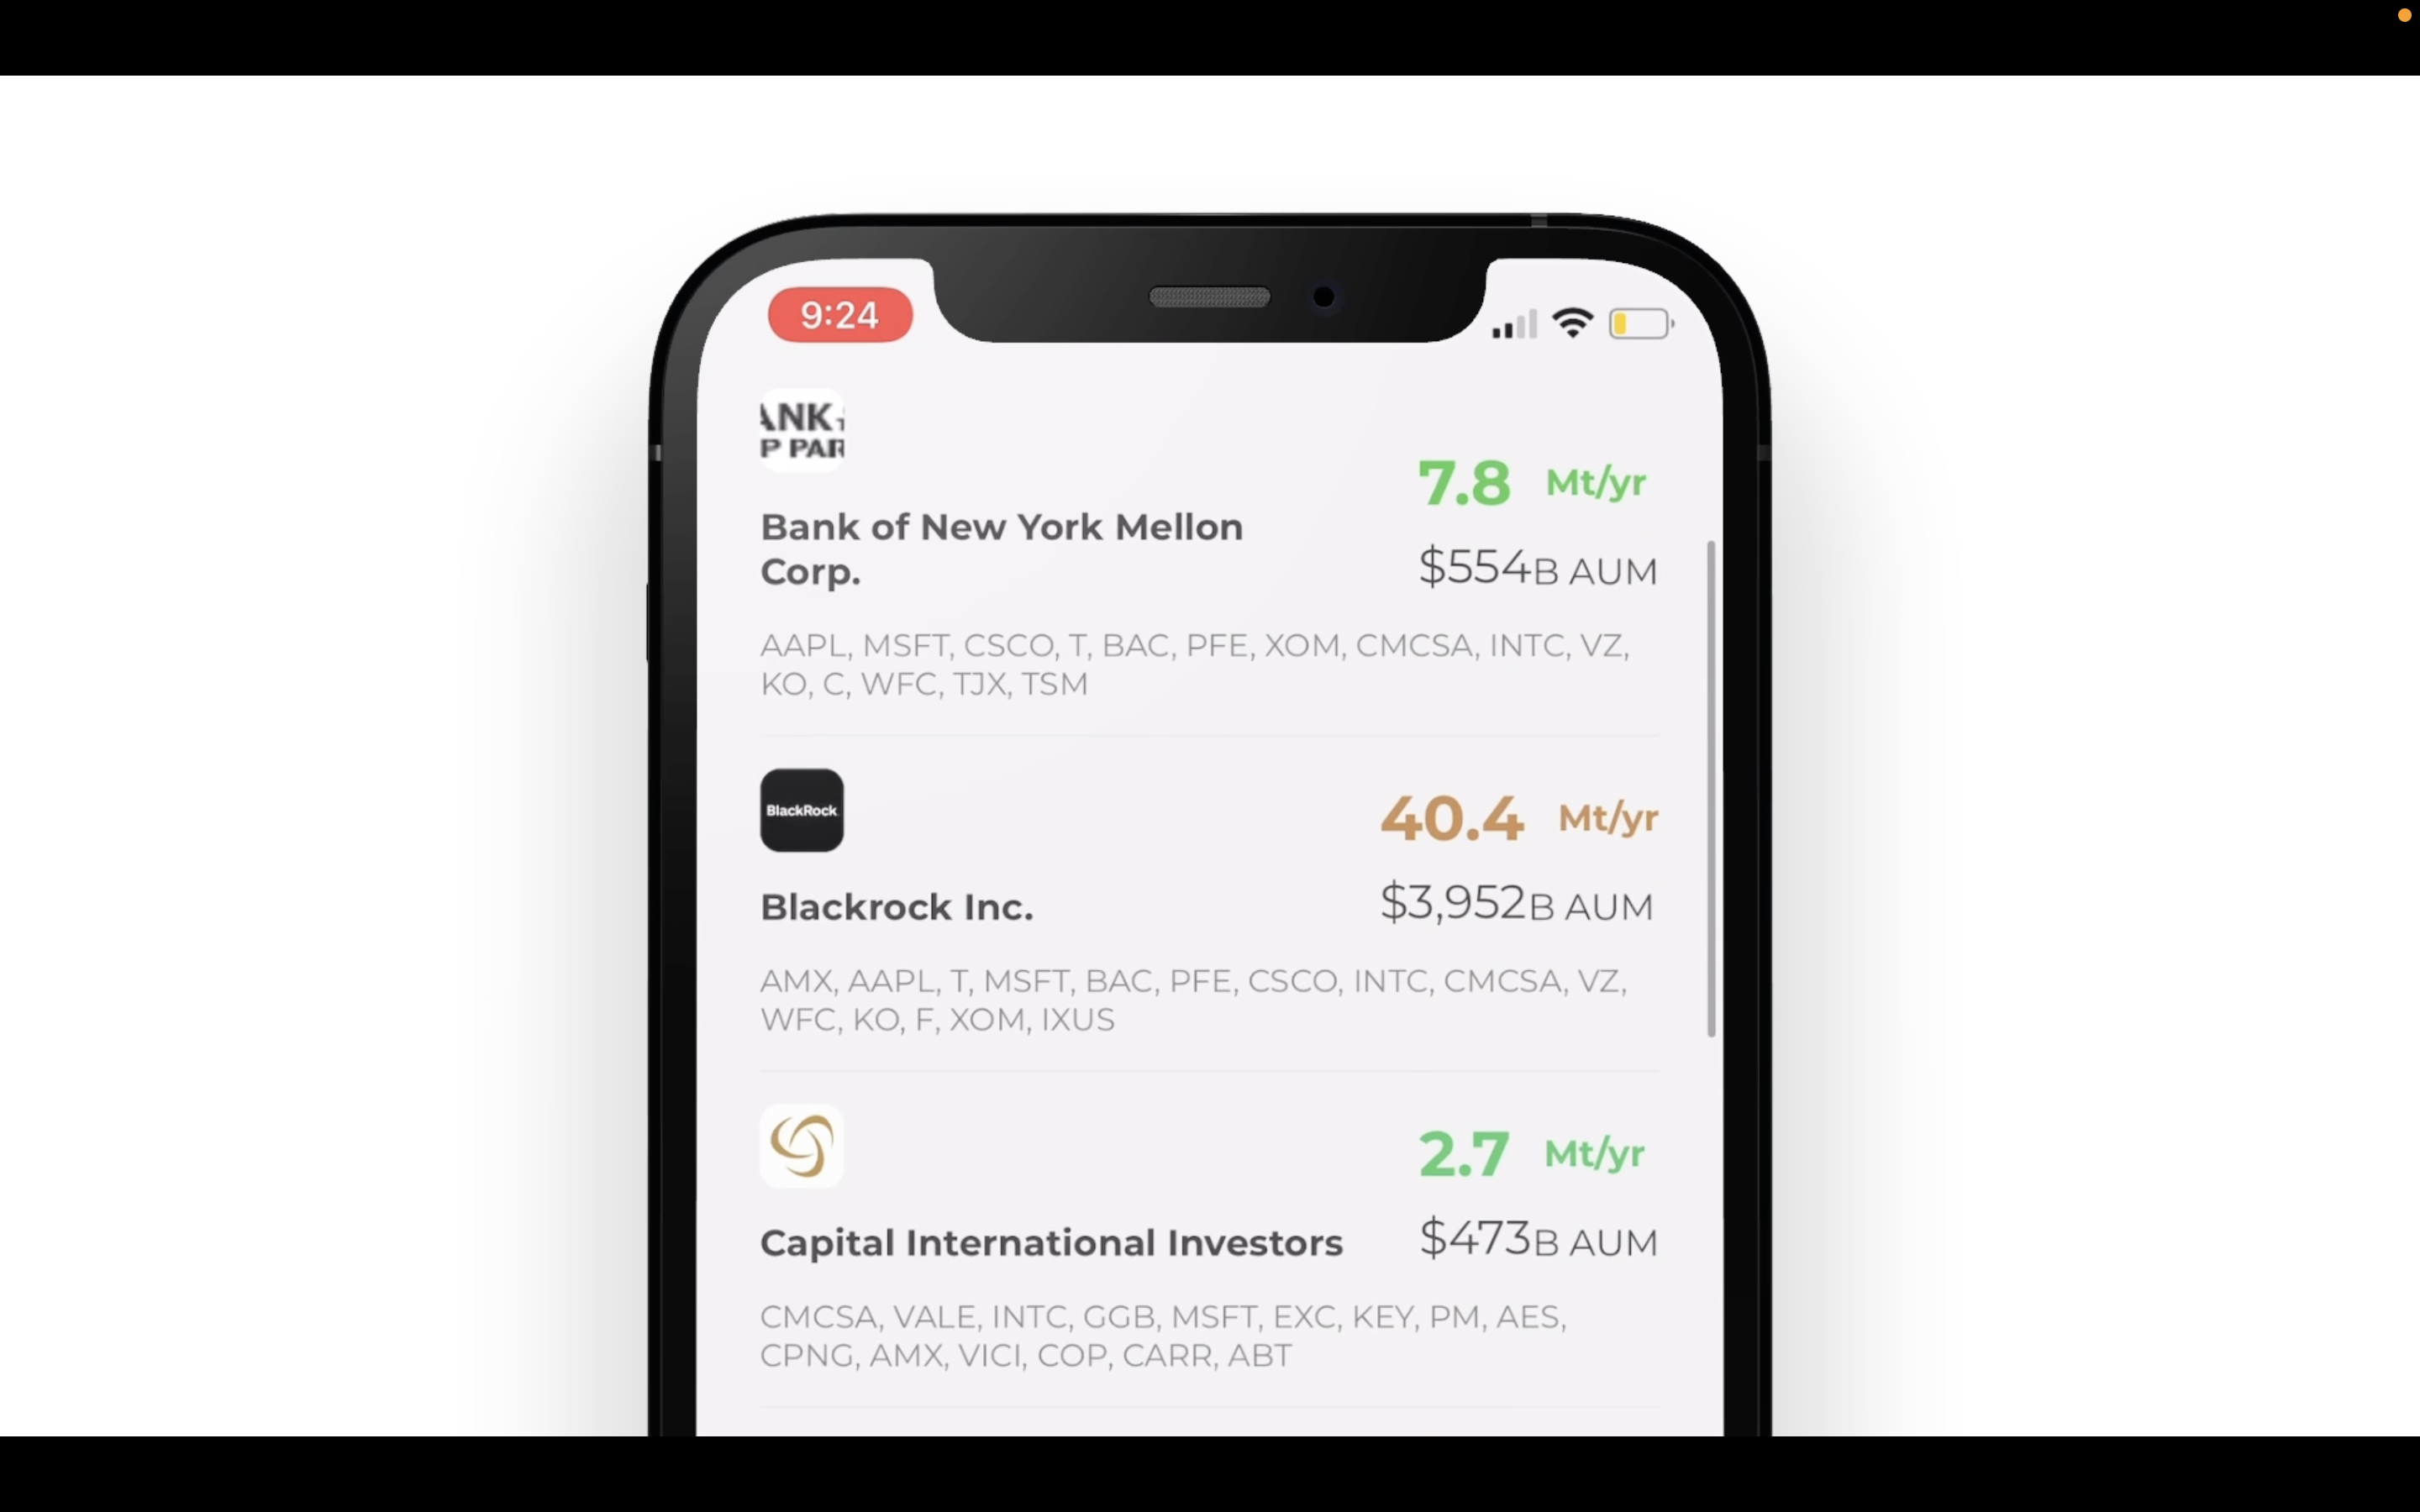
Summaries of the carbon footprint of top asset managers
-

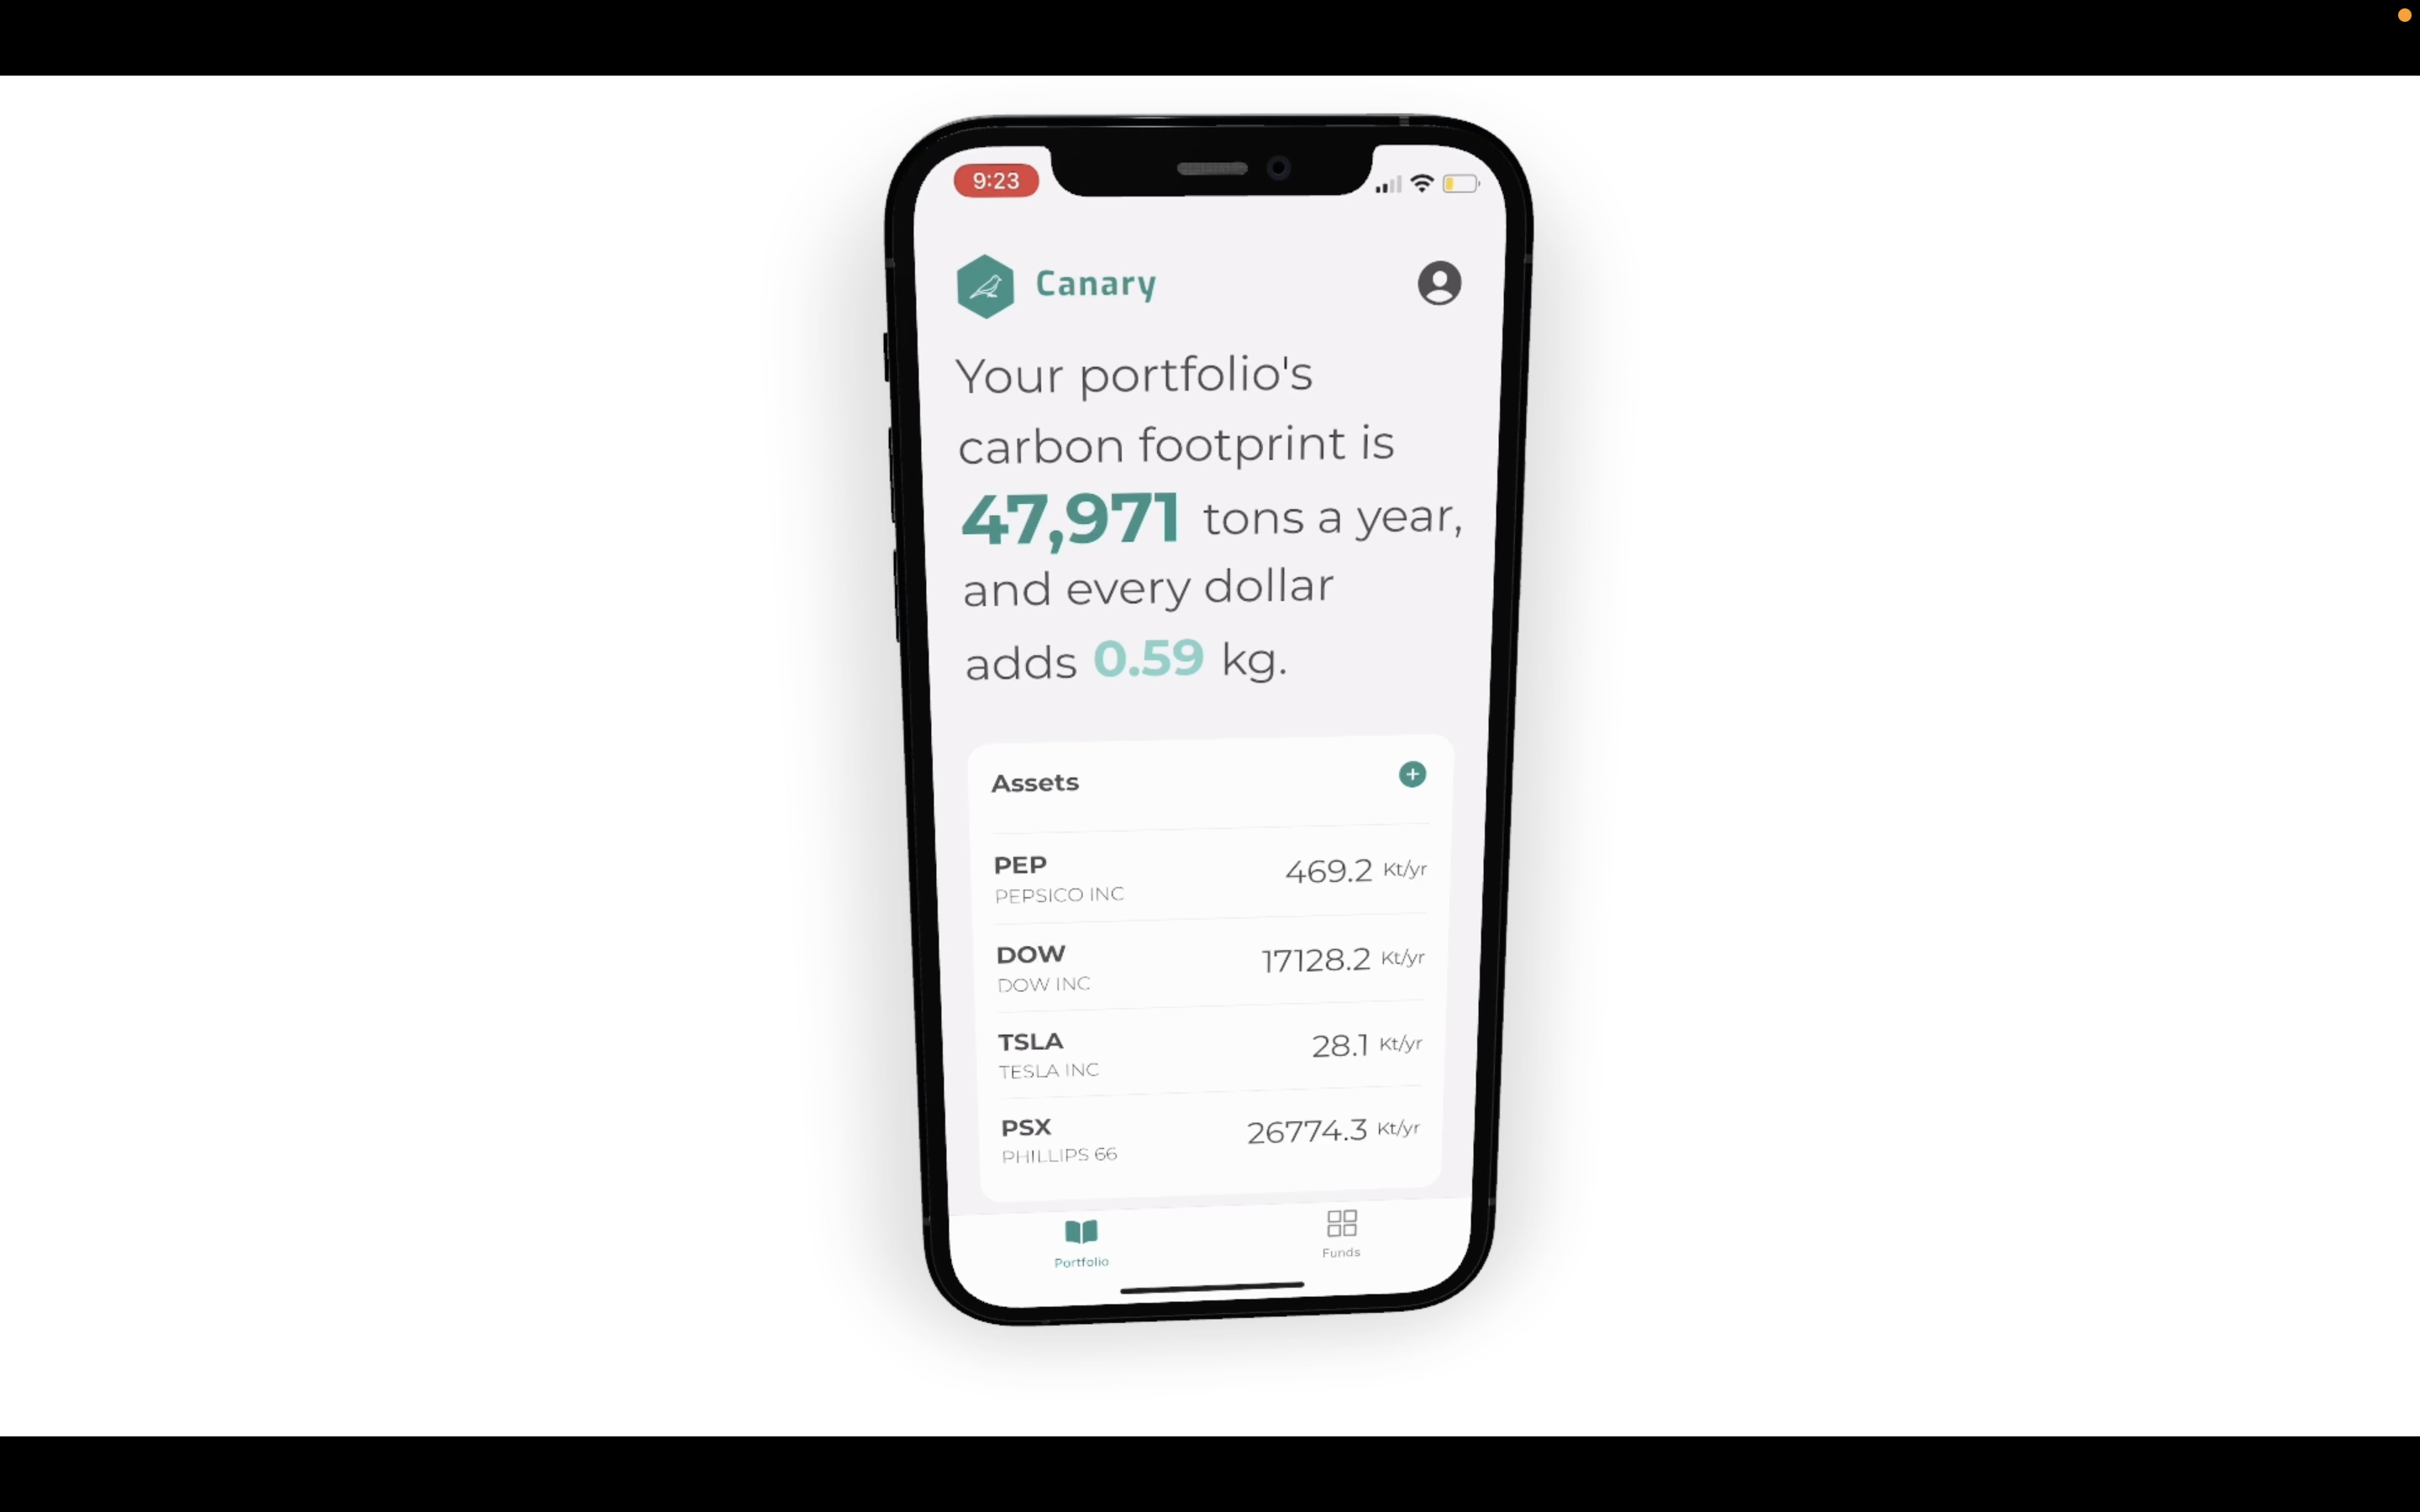
A user's carbon footprint based on their portfolio
-
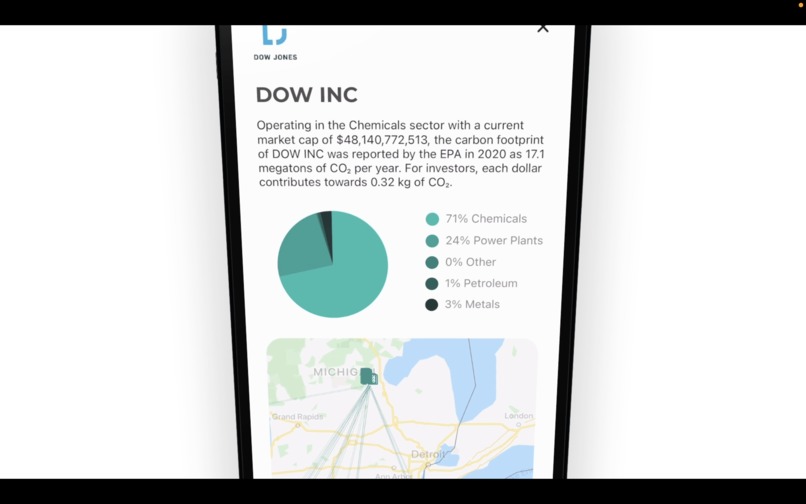
The breakdown of asset's carbon footprint based on its subsidiaries


Inspiration
A (probably fabricated, but still insightful) story about a famous mathematician turned quantitative hedge fund manager talks about how he wishes that stock tickers and all of the data that goes along with them were disconnected from any underlying asset or real company, so he could just play the game of predicting future share prices for profit without a concern for the real world.
The reality is that the numbers associated with these stock tickers have very real impacts on the world, and the way your portfolio is composed has consequences that go beyond your annualized return. Figures like annual carbon emissions can't and shouldn't be abstracted away.
On the other hand, current social impact investing can be more story-driven than traditional quantitative trading. We wanted to see if we could take a quantitative approach to understanding the carbon intensity and greenhouse emission of commonly traded shares and ETFs. It's critical for retail investors to understand the impact of their portfolios, and to more clearly shine a light on the carbon intensity of the portfolios of the largest asset managers, like BlackRock and Goldman Sachs.
To summarize the linked report, there are three levels at which we can think about the carbon footprint of a portfolio. The first level entails only the direct emissions of a particular asset; they are directly attributable. The second level includes emissions from things like electricity, which are often purchased by the company to facilitate their business (i.e. running data centers or producing products).Finally, the third level allocates the emissions of subsidiaries and critical supply chain companies to the parent asset. Performing this third level allocation is understood as a particularly challenging problem due to the complexity of modern supply chains and scarcity of the data required.
What it does
Canary has several related functions. When a user inputs their investment portfolio, they are given a clear visualization of the greenhouse gas emissions that their portfolio is responsible for at the third scope, and what underlying subsidiary assets contribute the most to that figure. Canary also visualizes the carbon intensity of large asset managers and hedge funds based on SEC filing data. We hope that Canary can be the push or warning that some investors need to change the way their portfolio is allocated.
How we built it
Canary aggregates data reported to the EPA at the level of individual facilities, and traces this emissions data up the supply chain to exchange traded parent companies.
We also use a machine learning estimation algorithm built with Mage.ai to (roughly) approximate carbon intensity based on industry, market capitalization, and numerous other features for assets where EPA emissions data was not feasible to acquire.
The mobile app which the users interacted with was built using React Native, with a Google Map API integration to display the breakdown of parent and subsidiary companies.
Challenges we ran into
Trying to access real financial and stock data without access to Bloomberg terminals or paying for expensive SaaS licenses was quite challenging. We ended up finding and utilizing the free tiers of several APIs. Because we had many disparate data sources, we had to find efficient ways to join the data from differently formatted sources.
Some of our data sources were:
- the EPA
- U.S. Census Data
- IexCloud
- Whalewisdom
- Alphavantage
Accomplishments that we're proud of
To the best of our knowledge, this is the first time the EPA's data has been used to attribute subsidiary company carbon emissions to parent companies in a programatic and easily visualized way in an attempt to elucidate third scope emissions of exchange traded securities. While we have no doubts that these sorts of analyses have likely taken place as one-off reports at various financial and environmental institutions, we believe that the data set we composed to power our application, as well as the insights we deliver, are novel.
We are also proud of the fact that this tool can drive socially-conscious investors to make better informed decisions about where they are allocating their livelihood, improving the well-being and longevity of our planet.
What we learned
One of our largest bottlenecks for this project was assembling the dataset in a coherent and correct way. We believe it is import for us to integrate with a Market Data API that provides up to date pricing and Market Capitalizations, as we want to provide as accurate a picture as possible, but we found that working with financial asset data without the support of a large company to be very challenging. We also learned how heavily invested in non-renewable energy shares some famous conglomerates, such as Berkshire Hathaway, are.
What's next for Canary
We believe there are several directions we can explore with our quantitative approach to green investing. First, we believe it would be an important public service to expand our offering to be able to provide up-to-date emissions data for all exchange traded assets. As we collect more data on the carbon emissions of various companies, our machine learning algorithm would also have more training data and could be increasingly accurate.
We believe that we could use our approach to power an investment portfolio seeking to maximize annualized returns while maintaining a threshold of maximum tons of greenhouse emissions per dollar deployed, amongst other strategies. As stated earlier, a lot of impact driving investing is carried out based primarily on stories and other less quantitative approaches. We believe that there is an optimization problem to be solved between returns and environmental impact. Our dataset could allow for an investor to optimize their portfolio given their desired carbon output threshold.
Built With
- alphavantage
- google-cloud
- iexcloud
- jupyter
- mage
- pandas
- python
- react-native


Log in or sign up for Devpost to join the conversation.