-
-
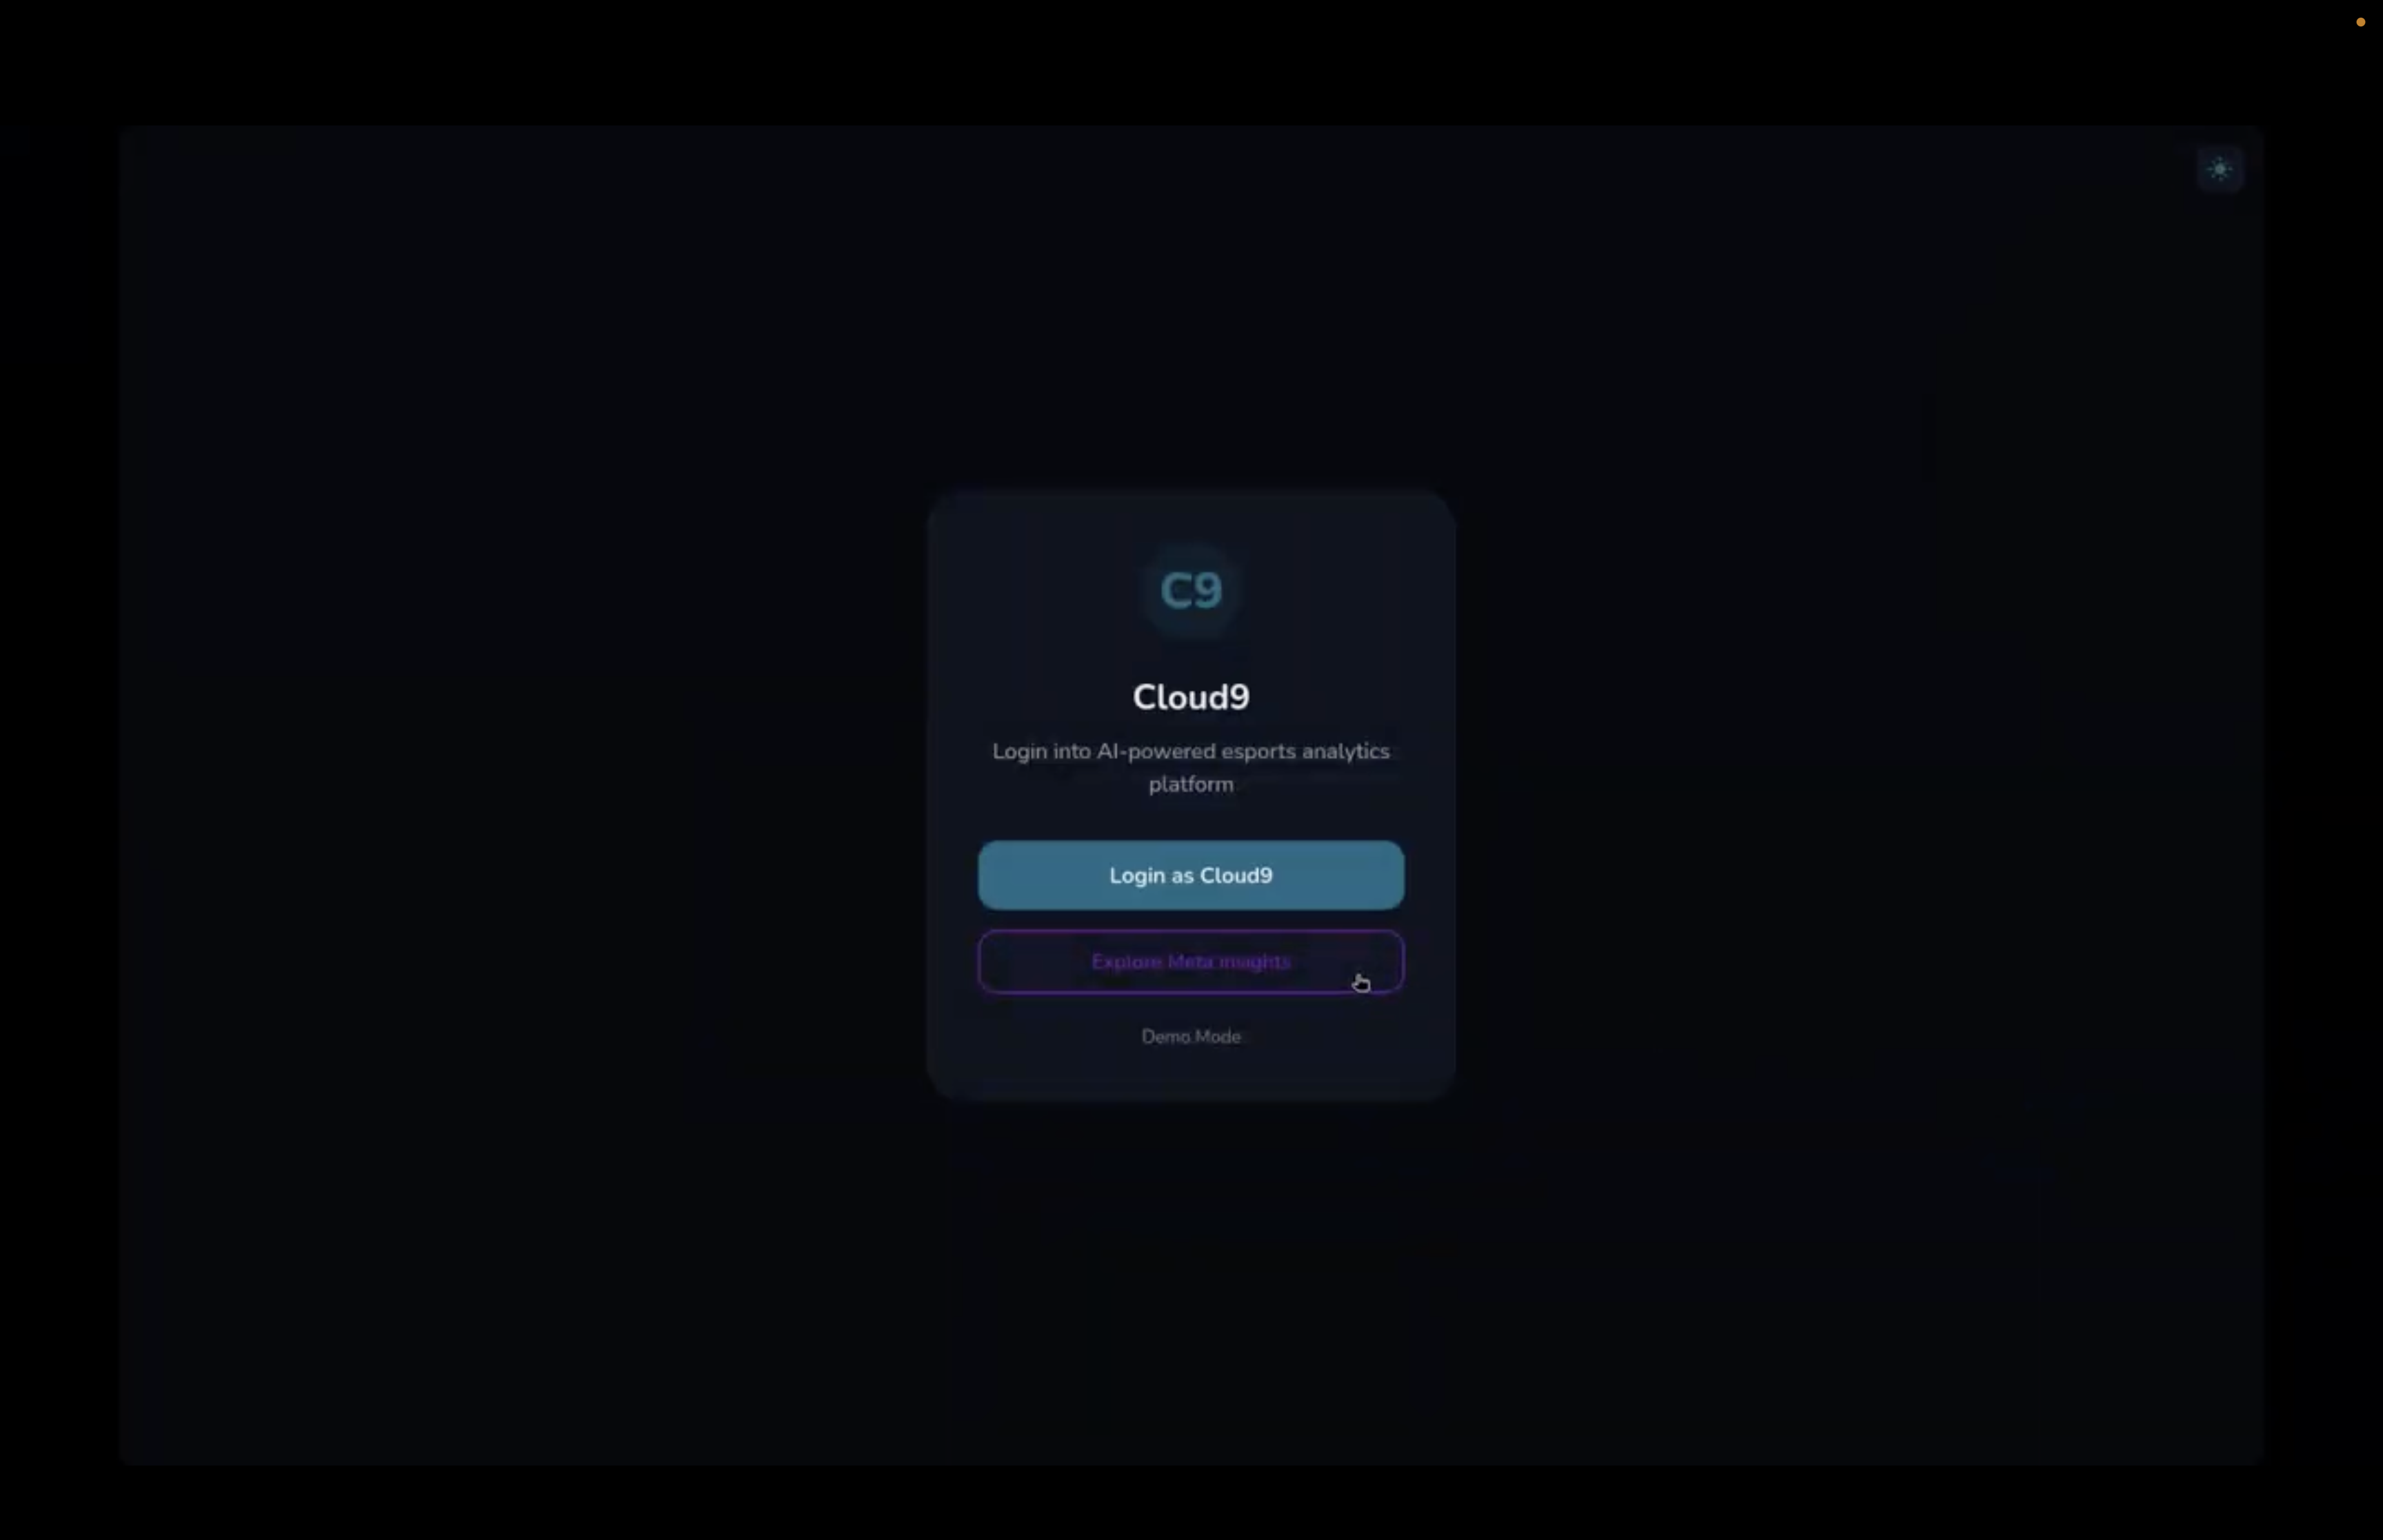
Login screen
-

Loading screen
-
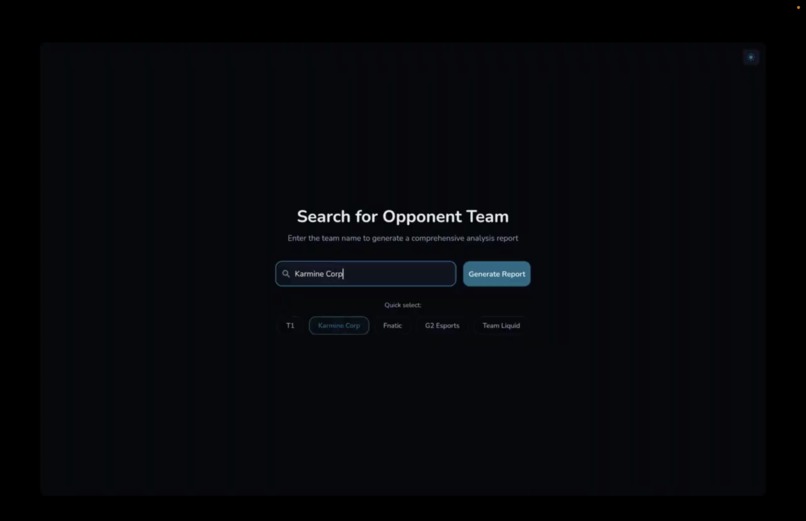
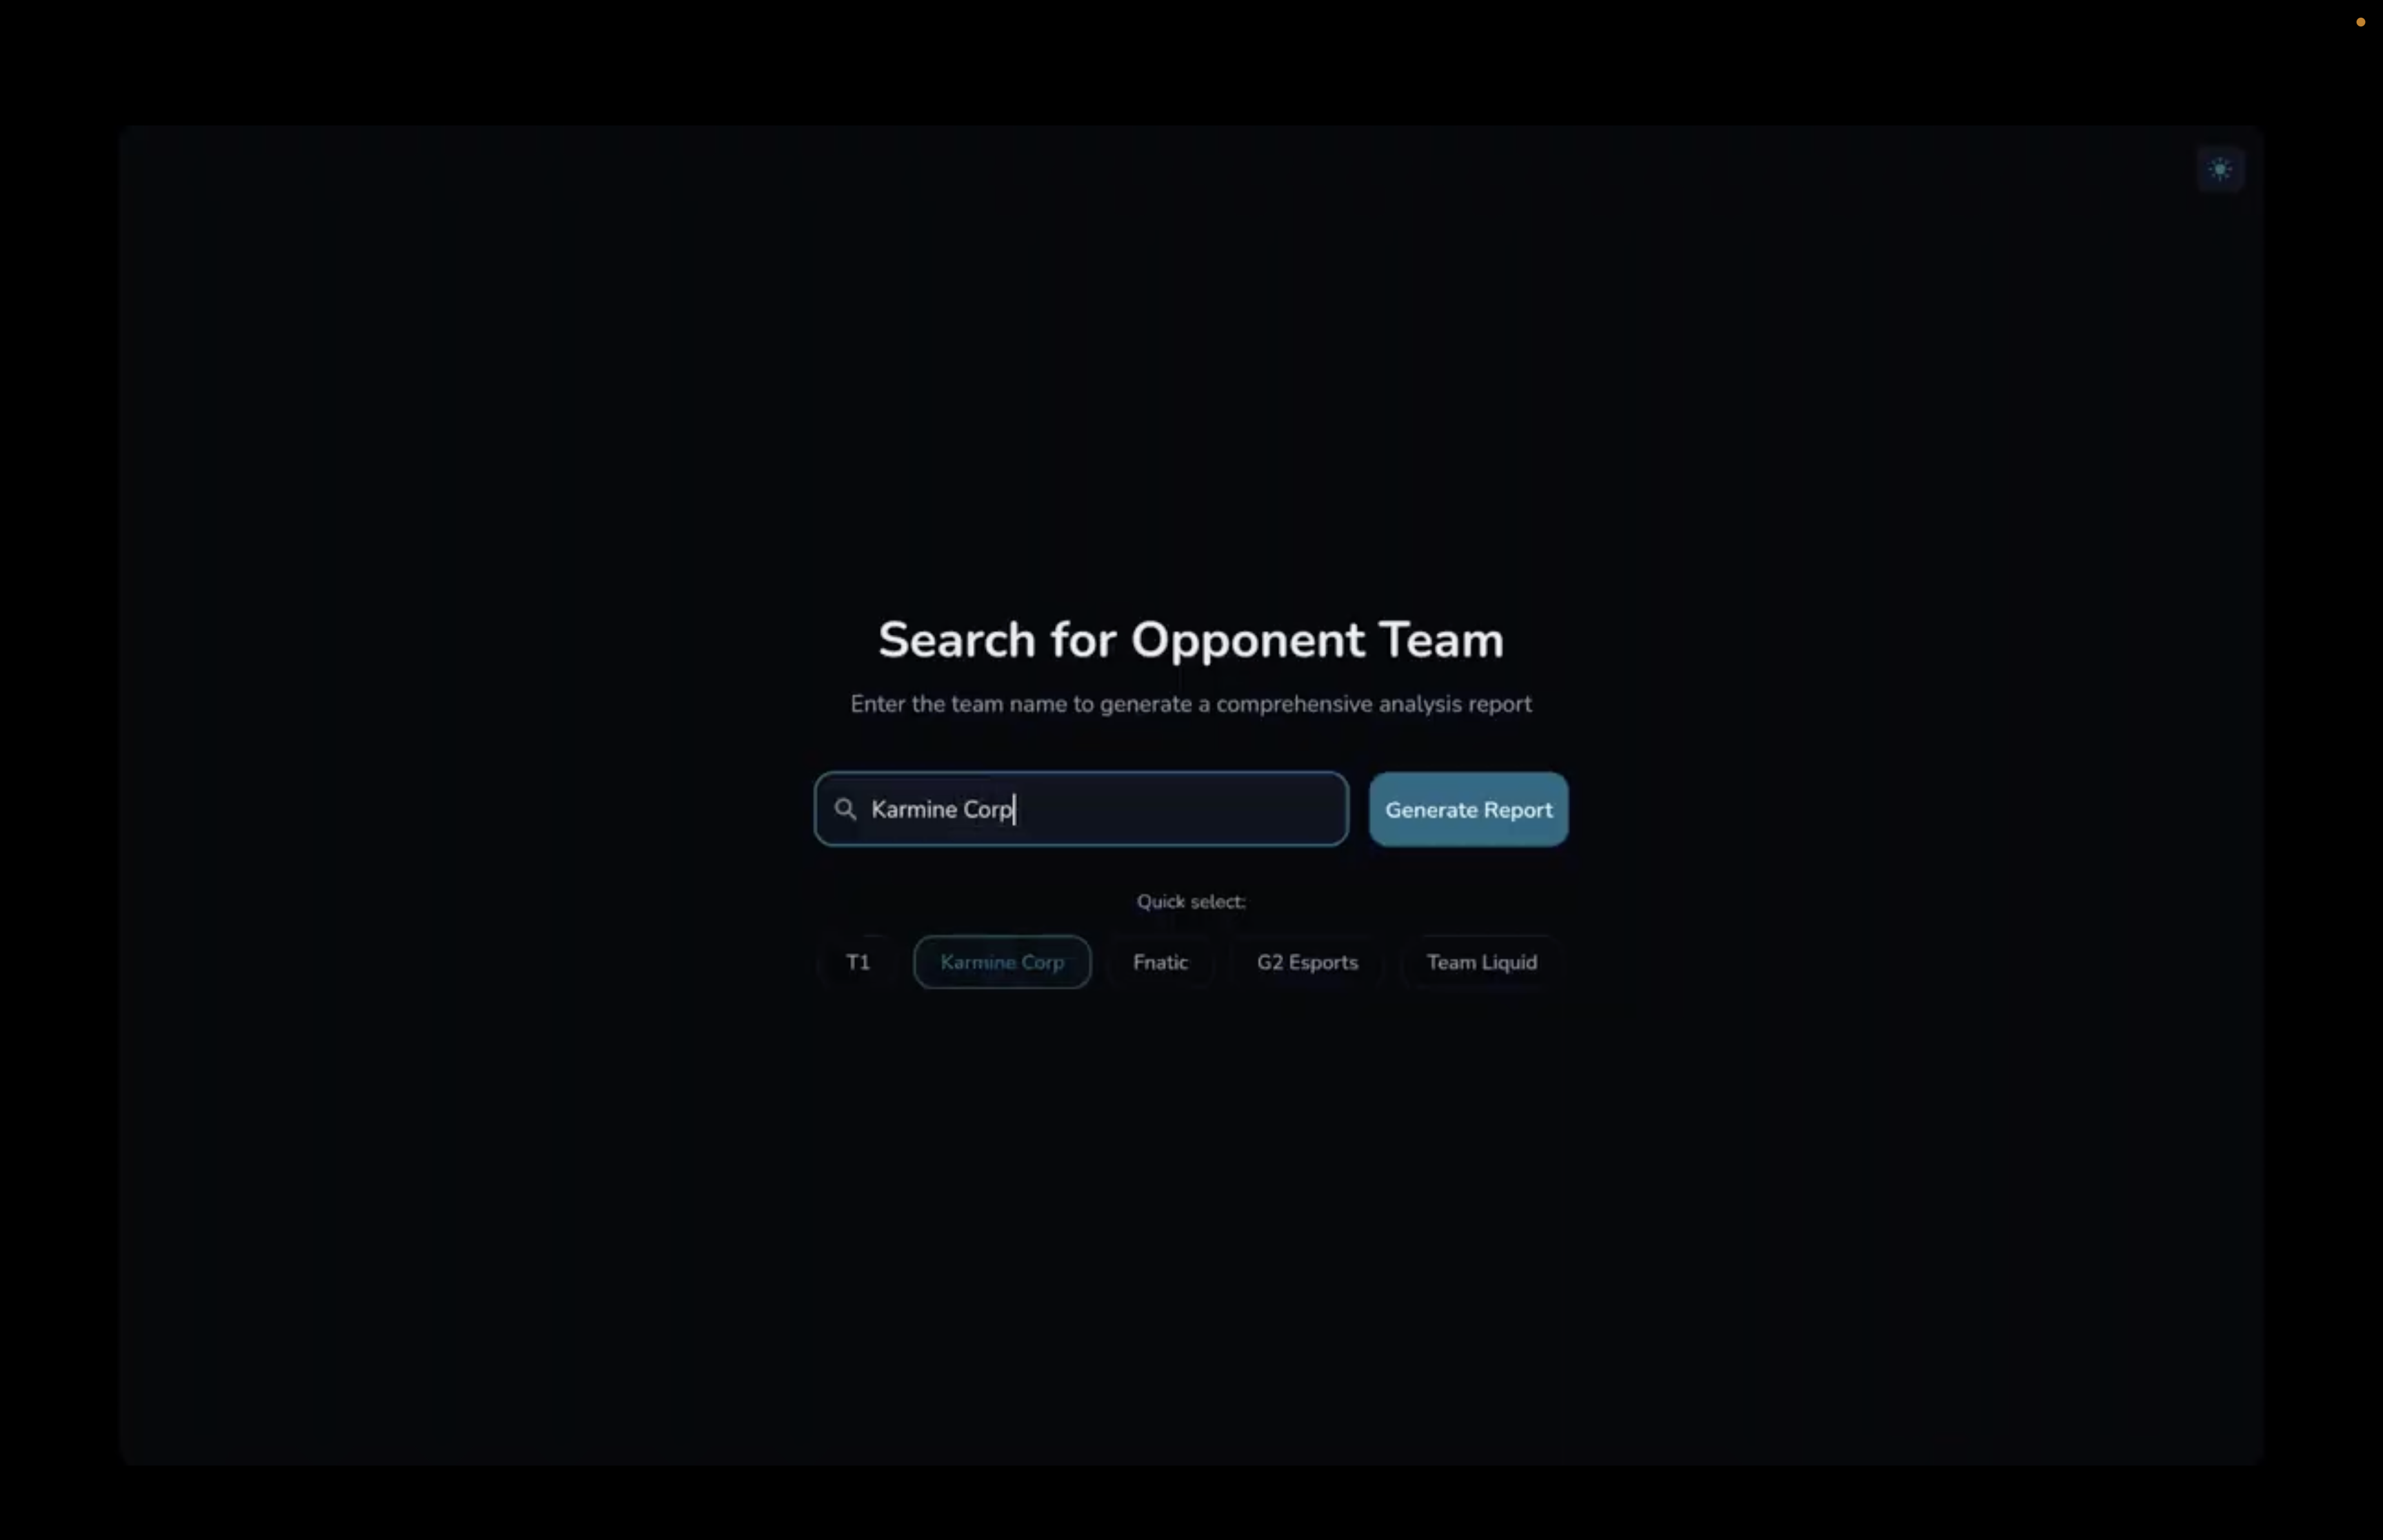
Searching for opponent team
-
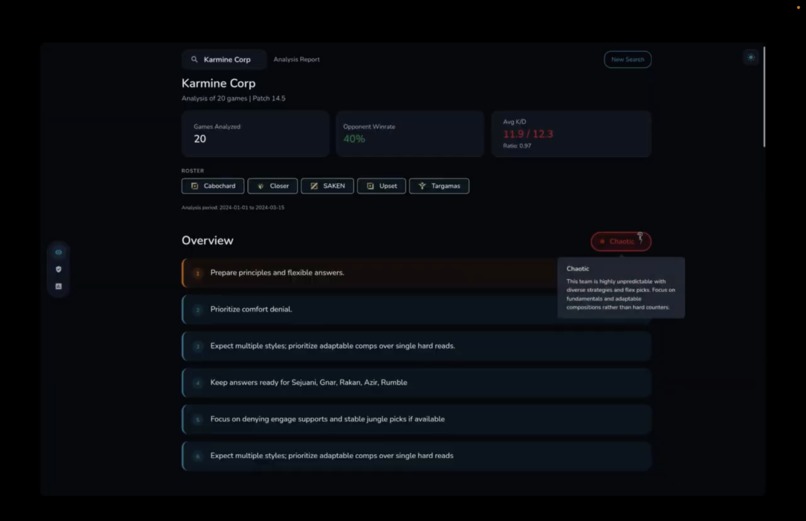
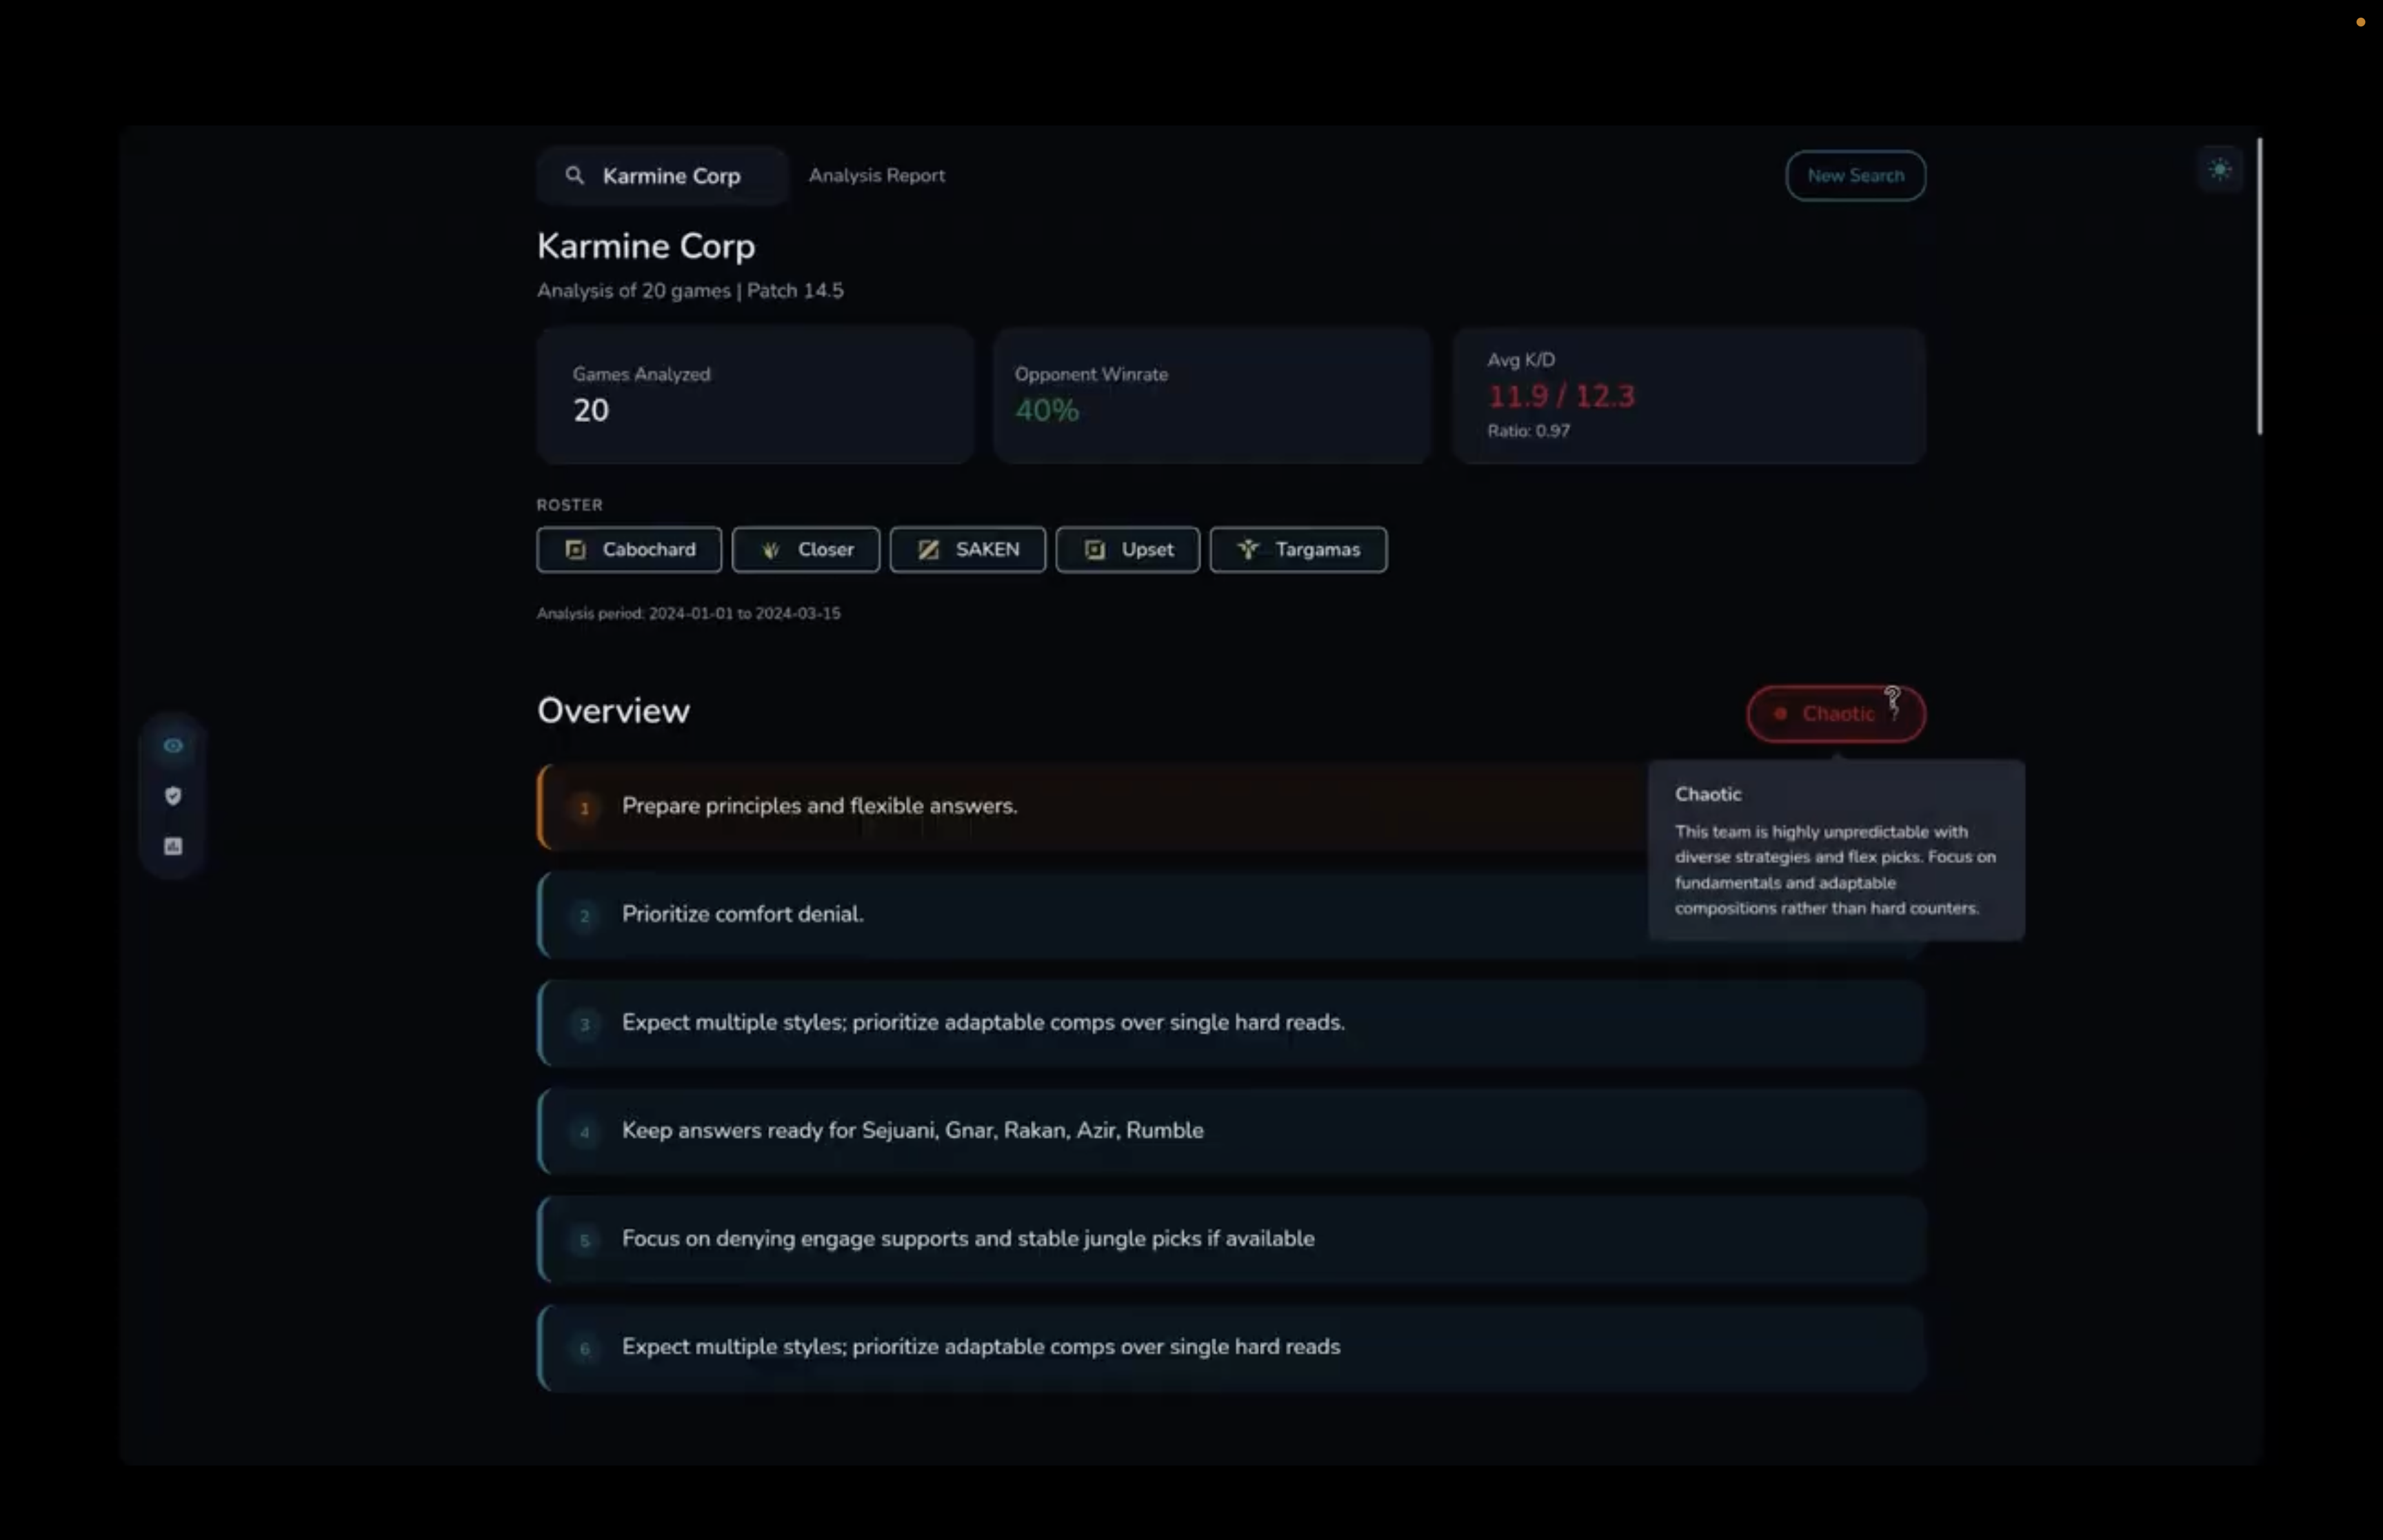
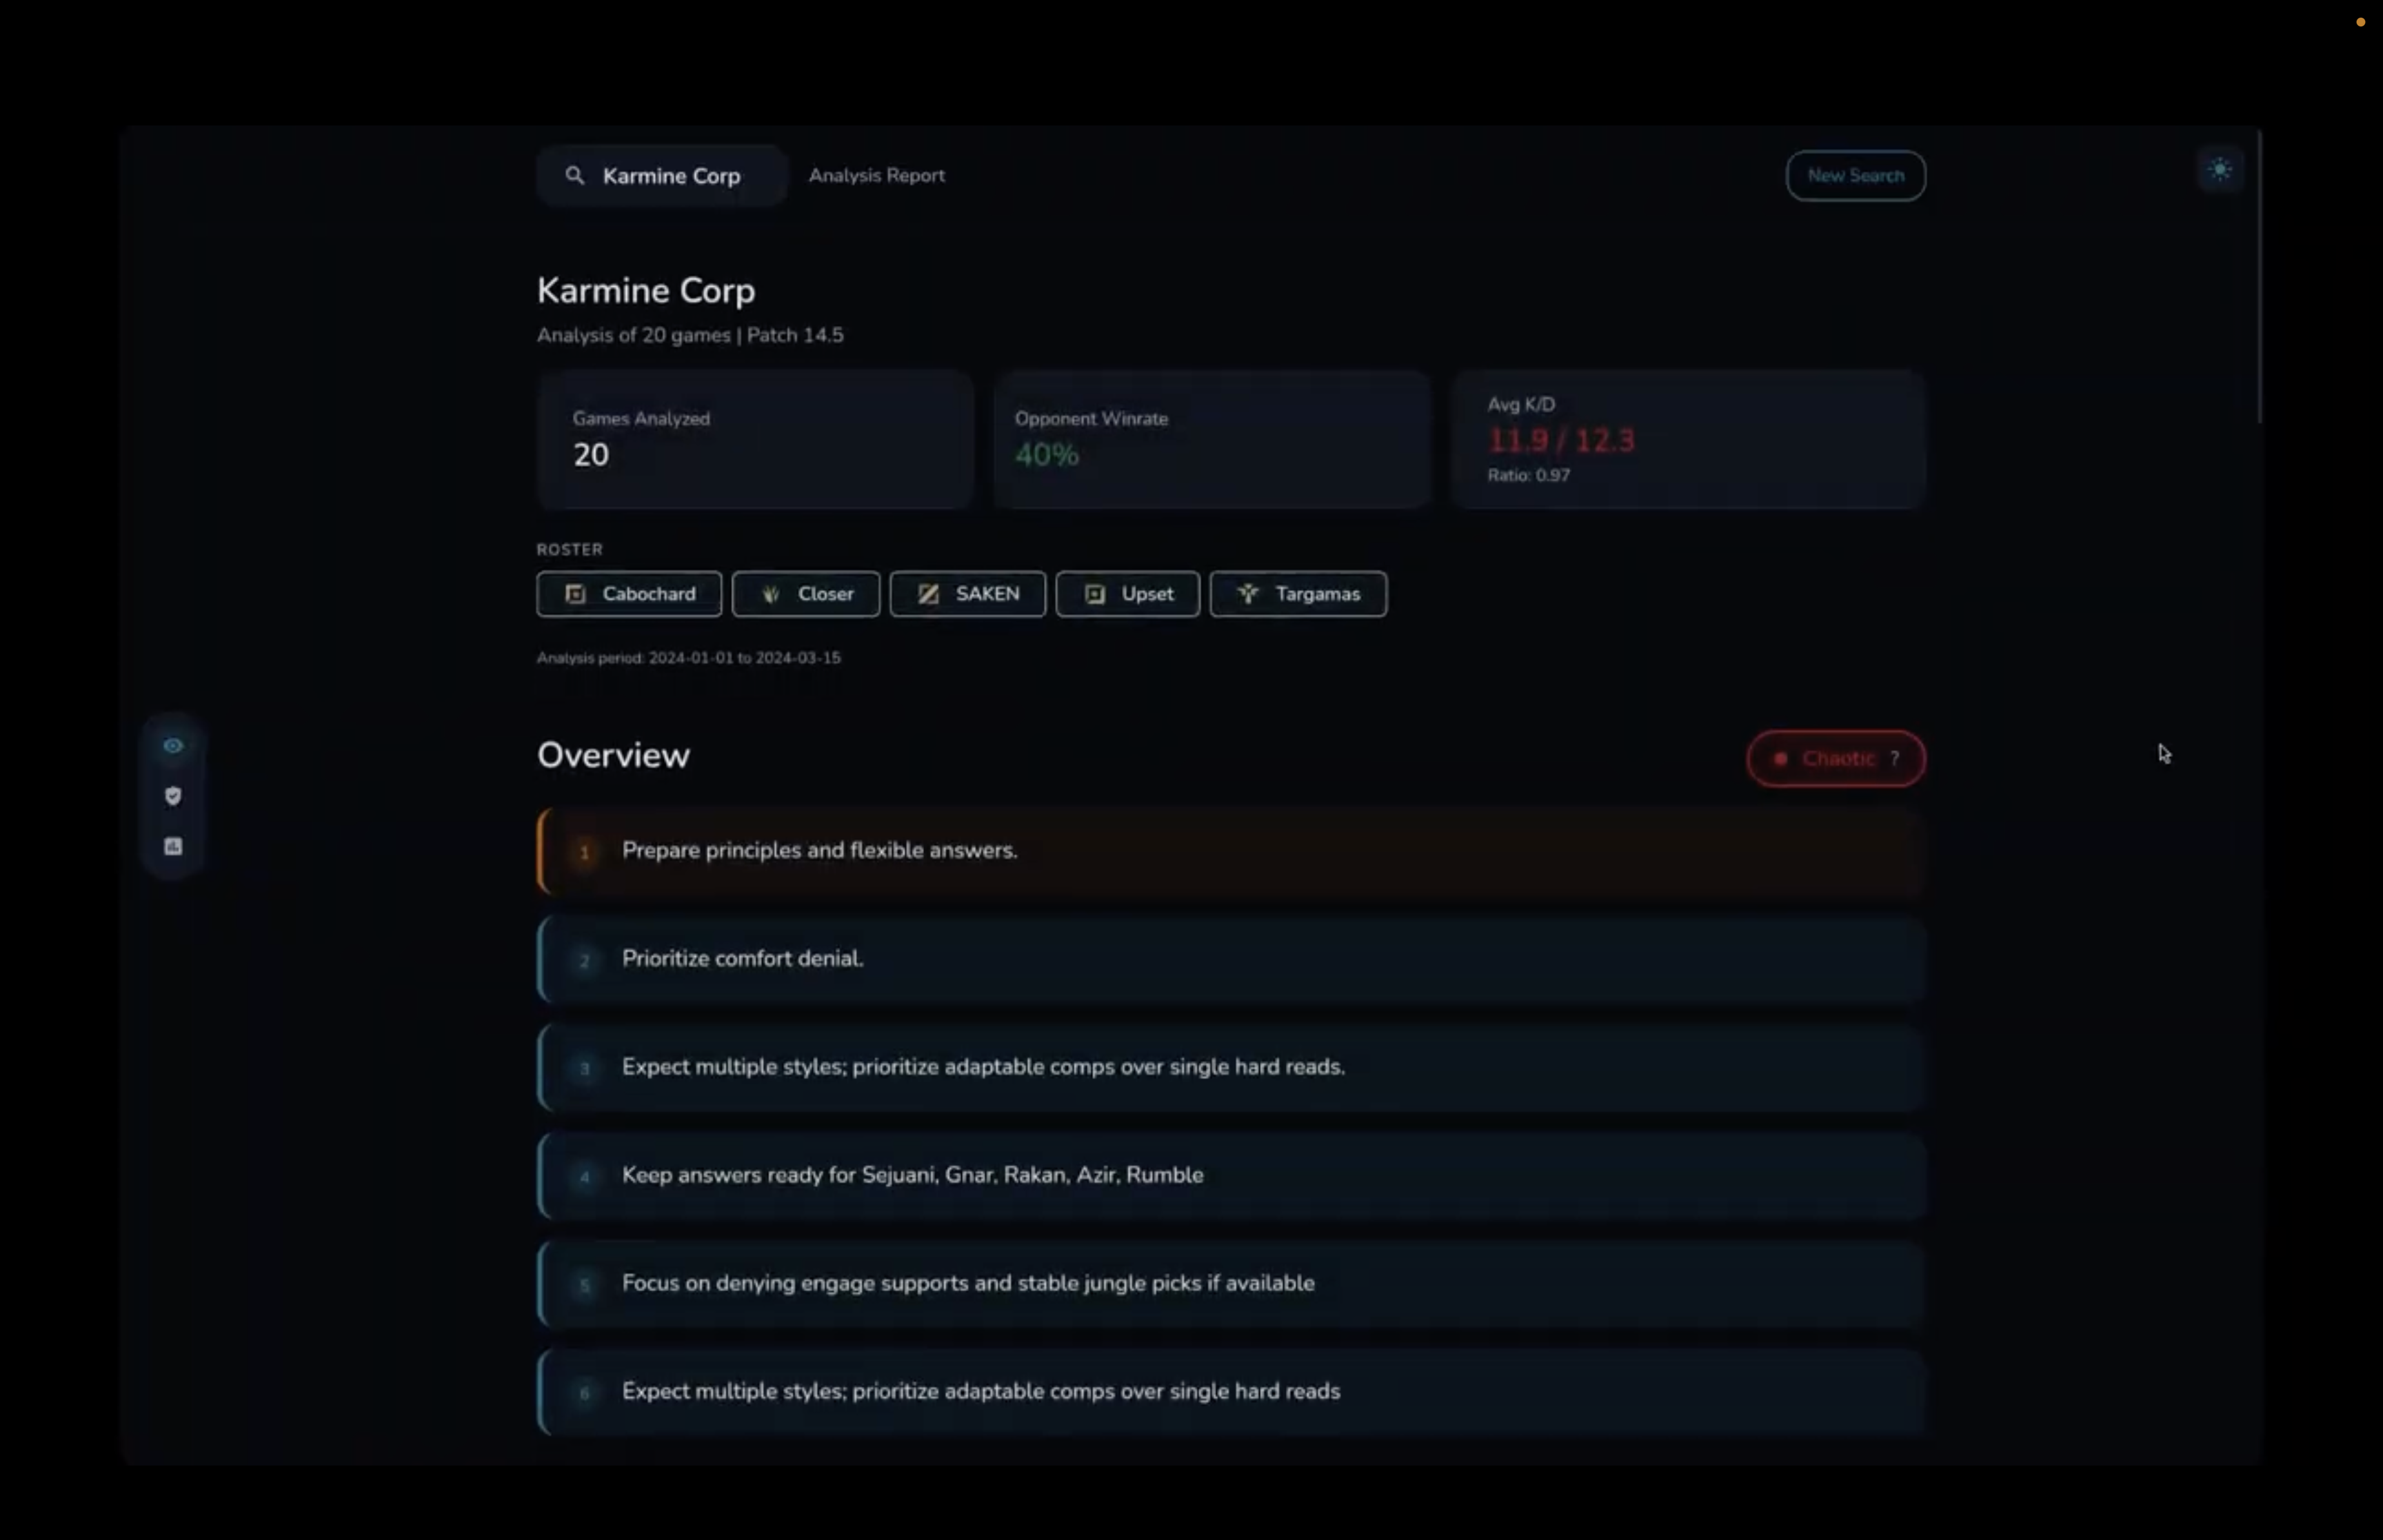
Type of team (chaotic in this case)
-
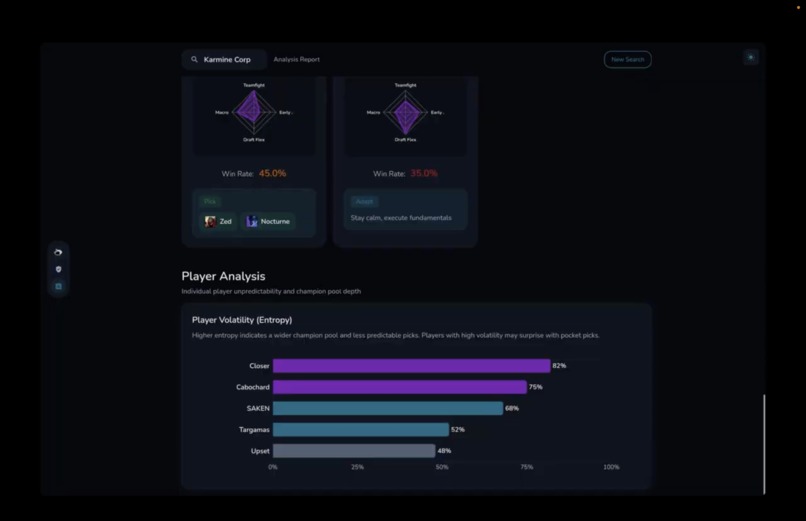
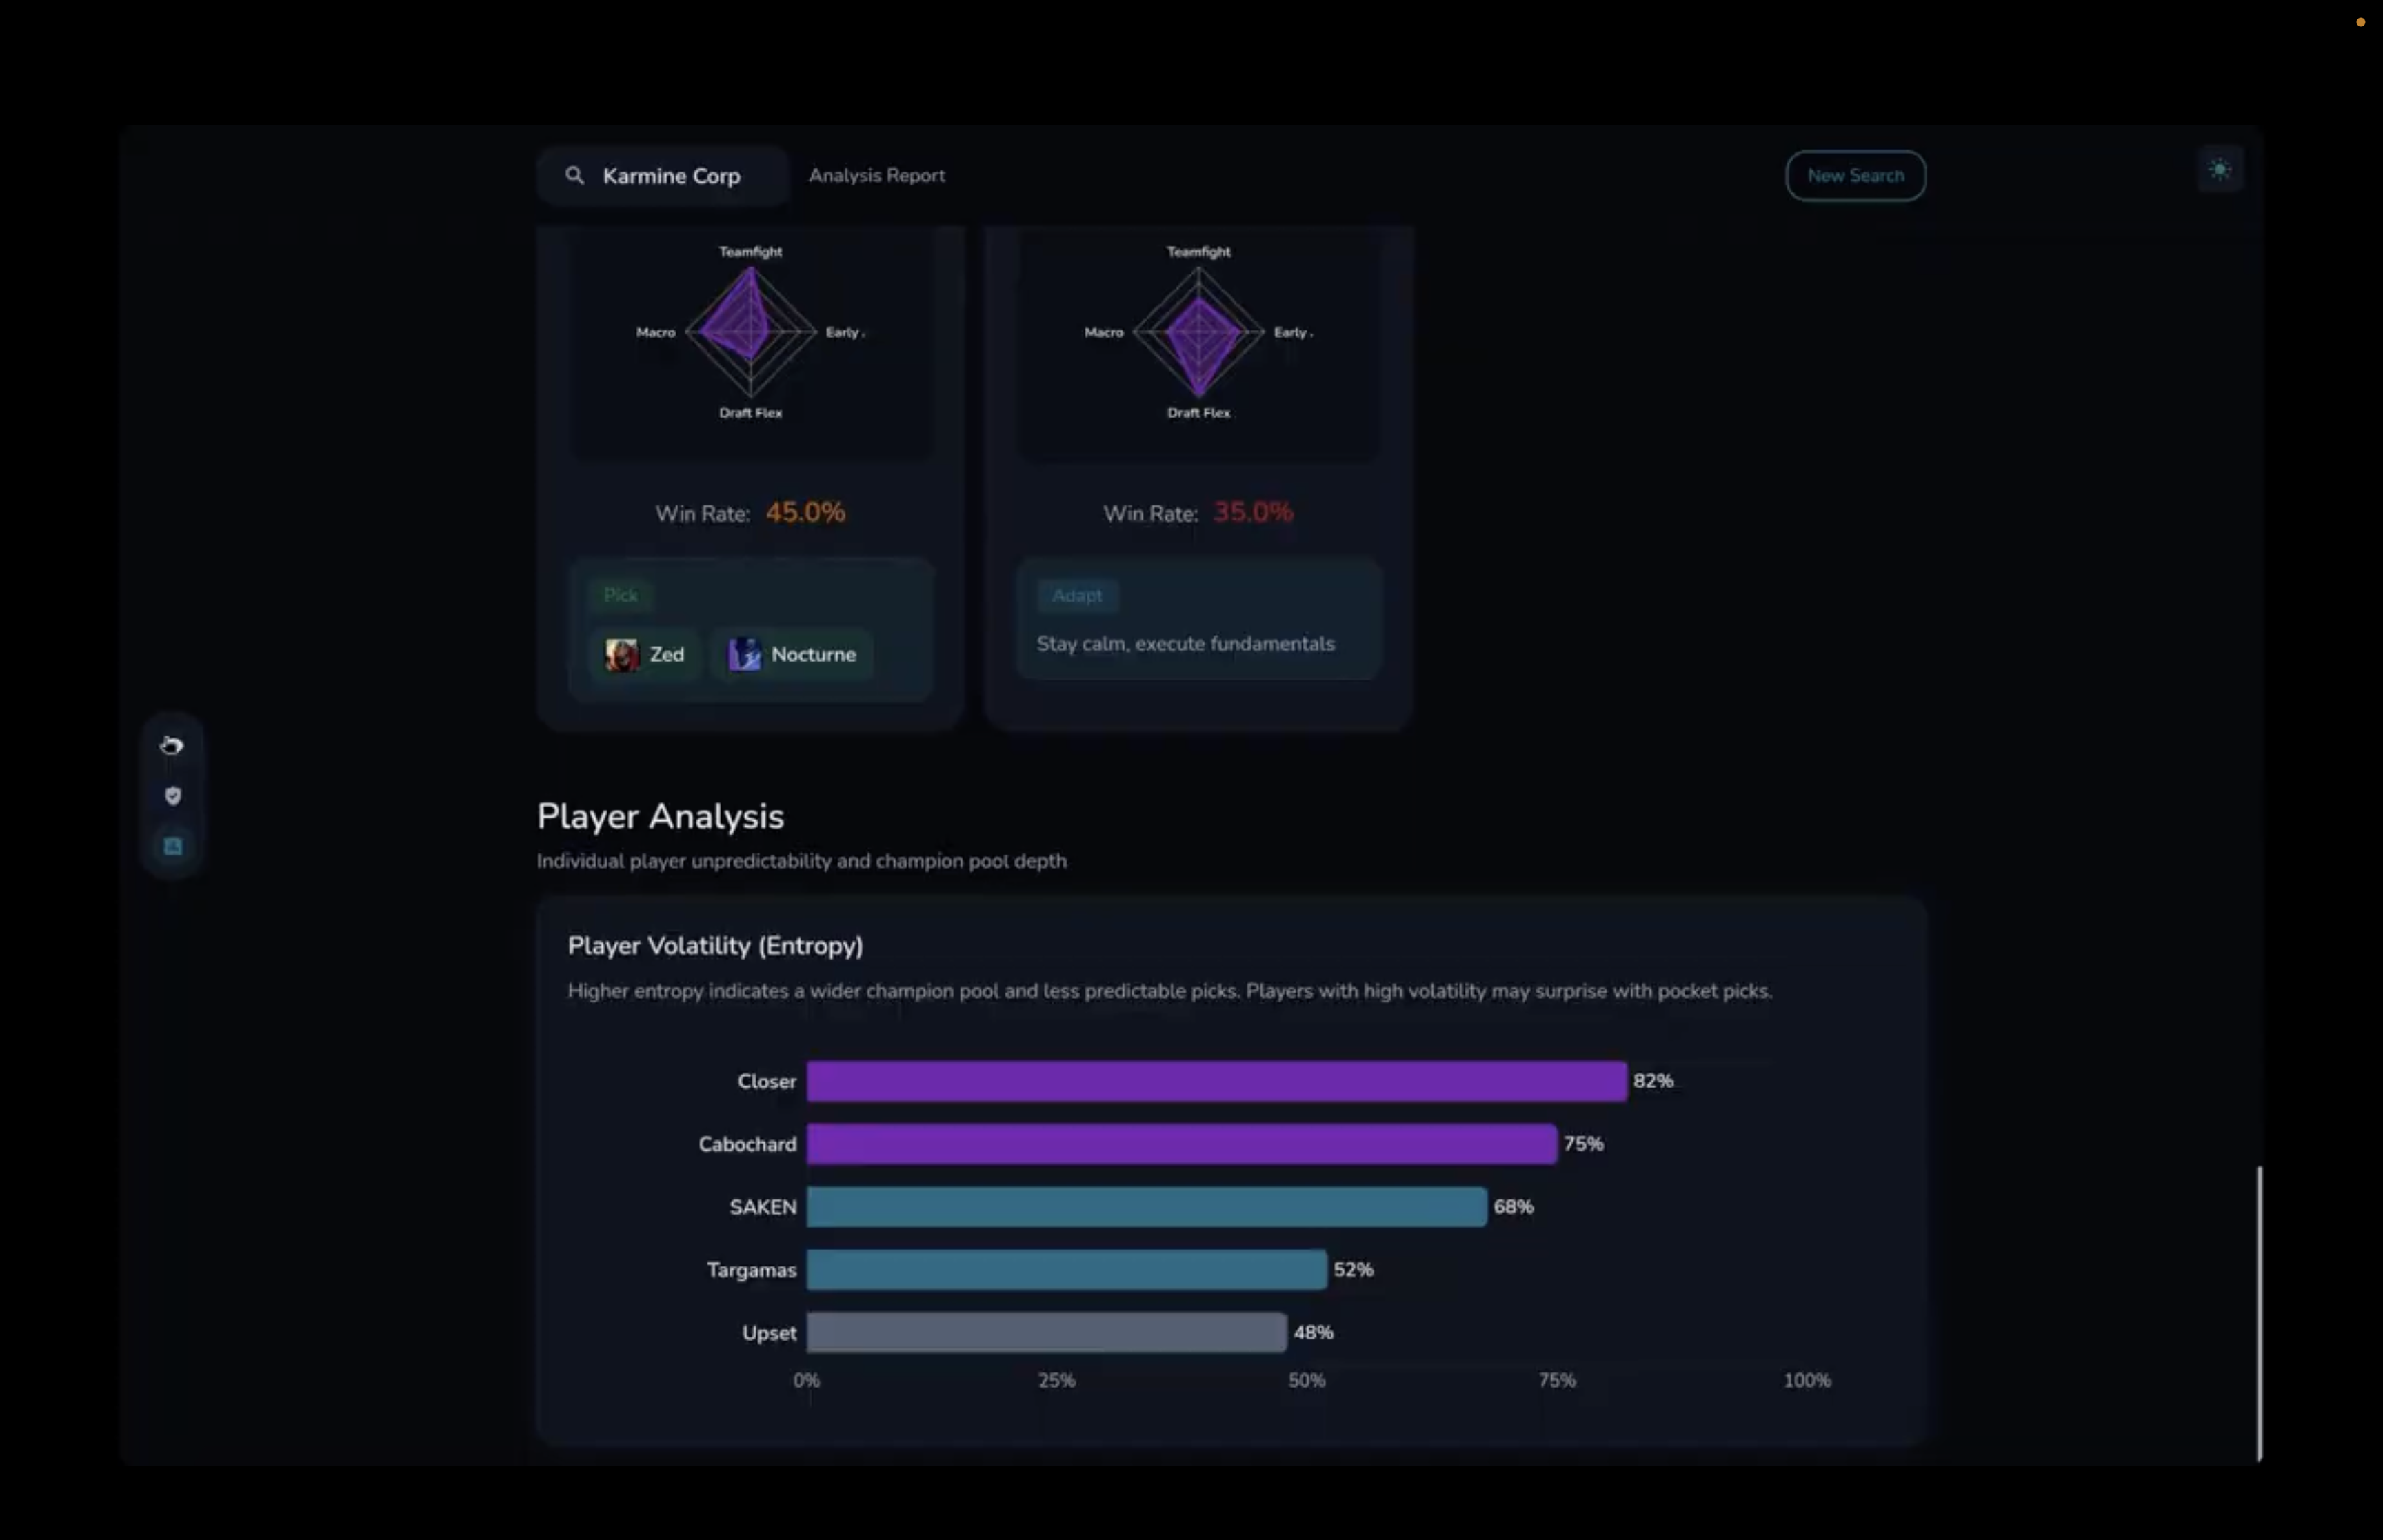
Per player analysis
-
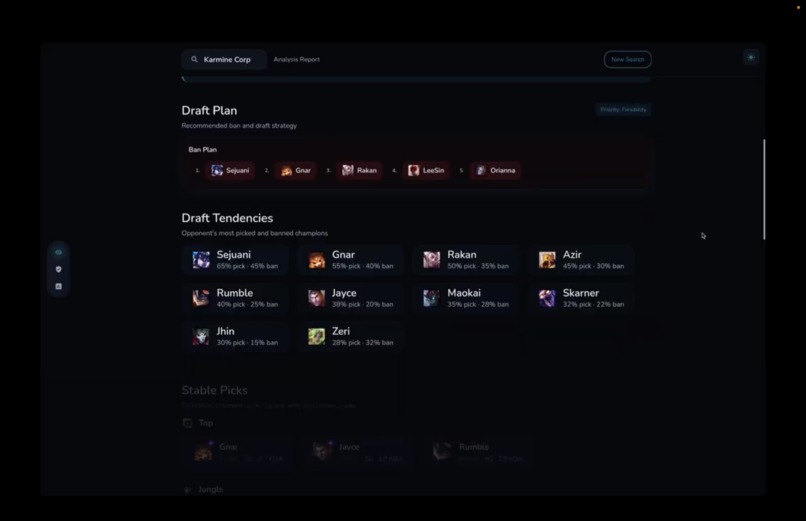
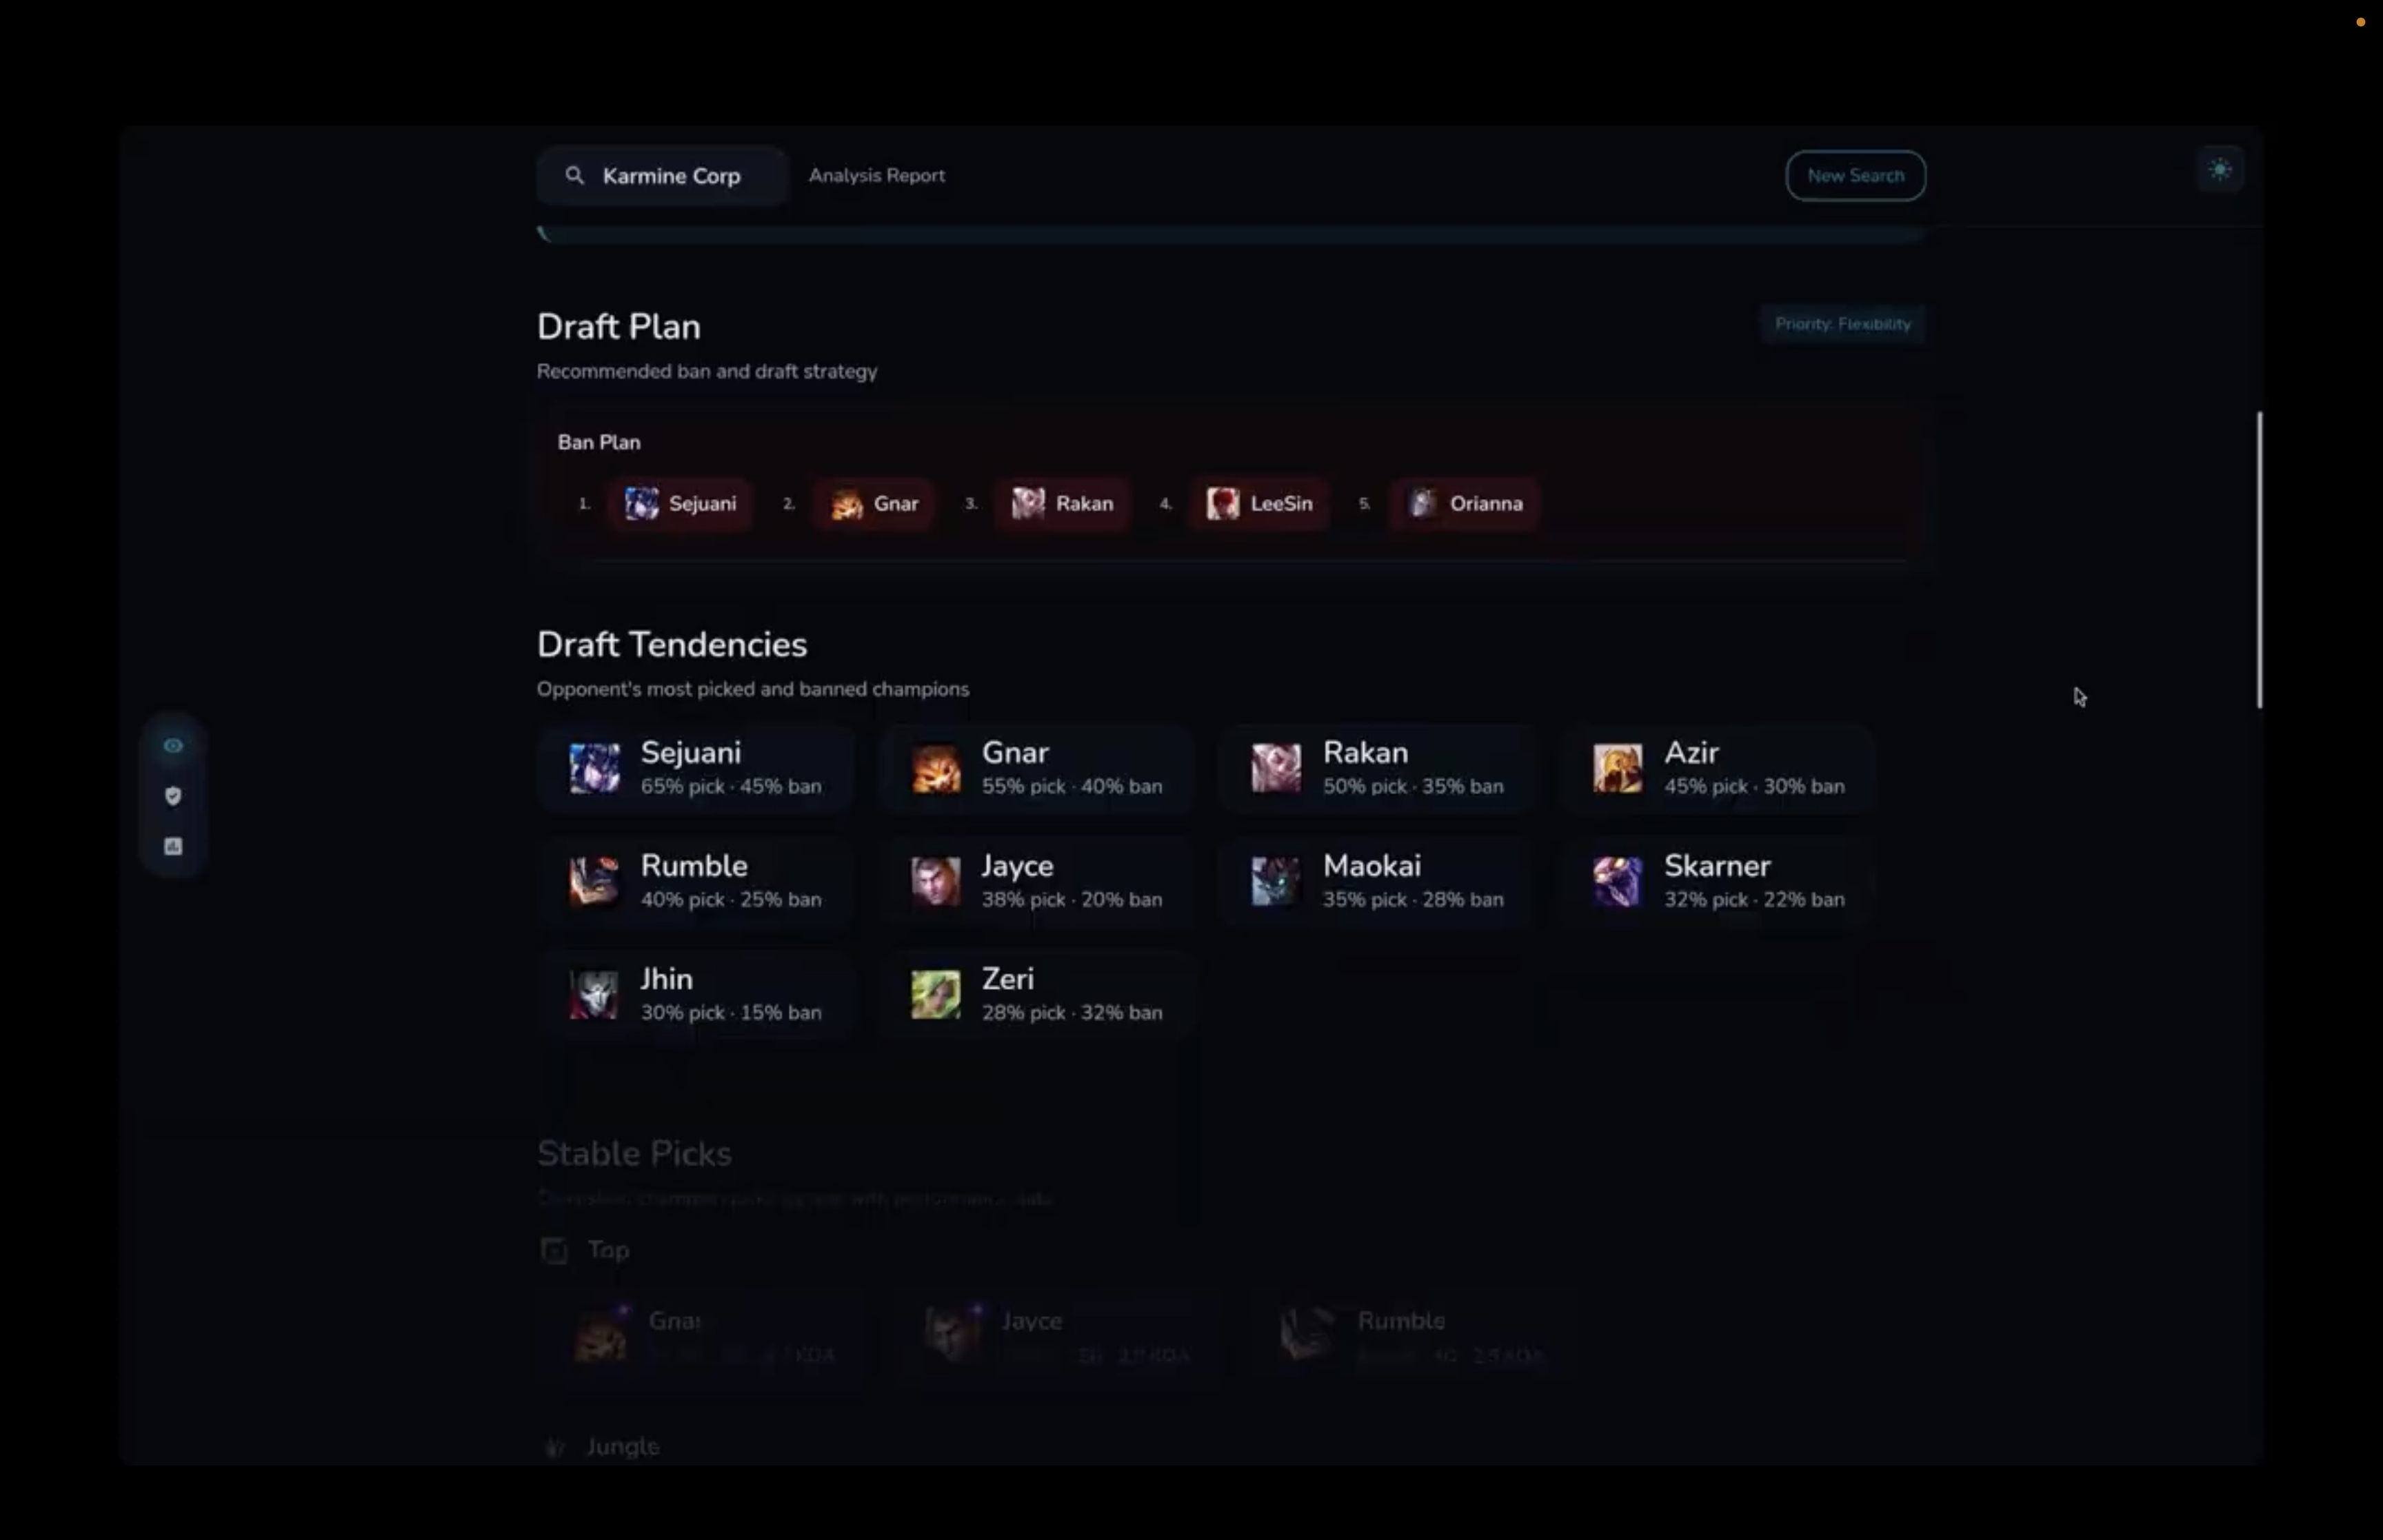
Draft plan + tendencies
-
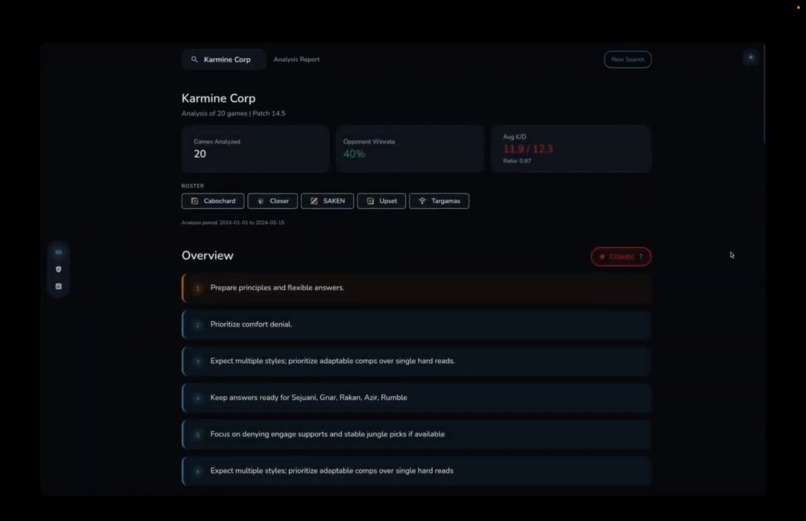
Report overview
-
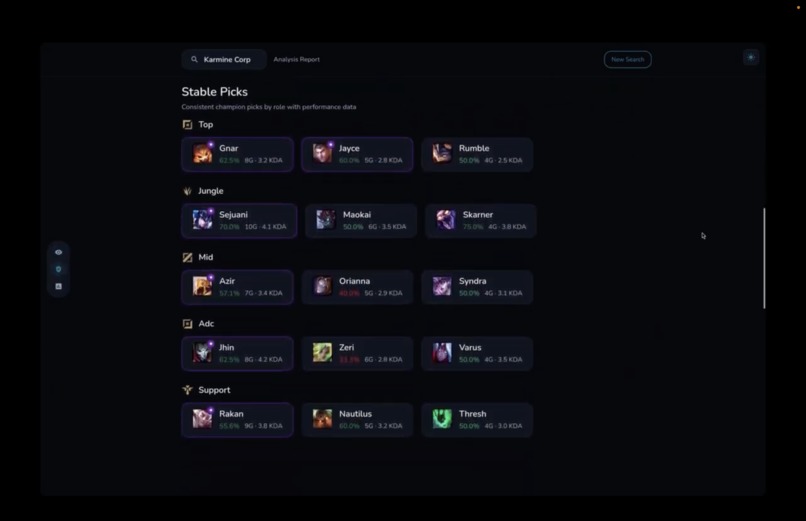
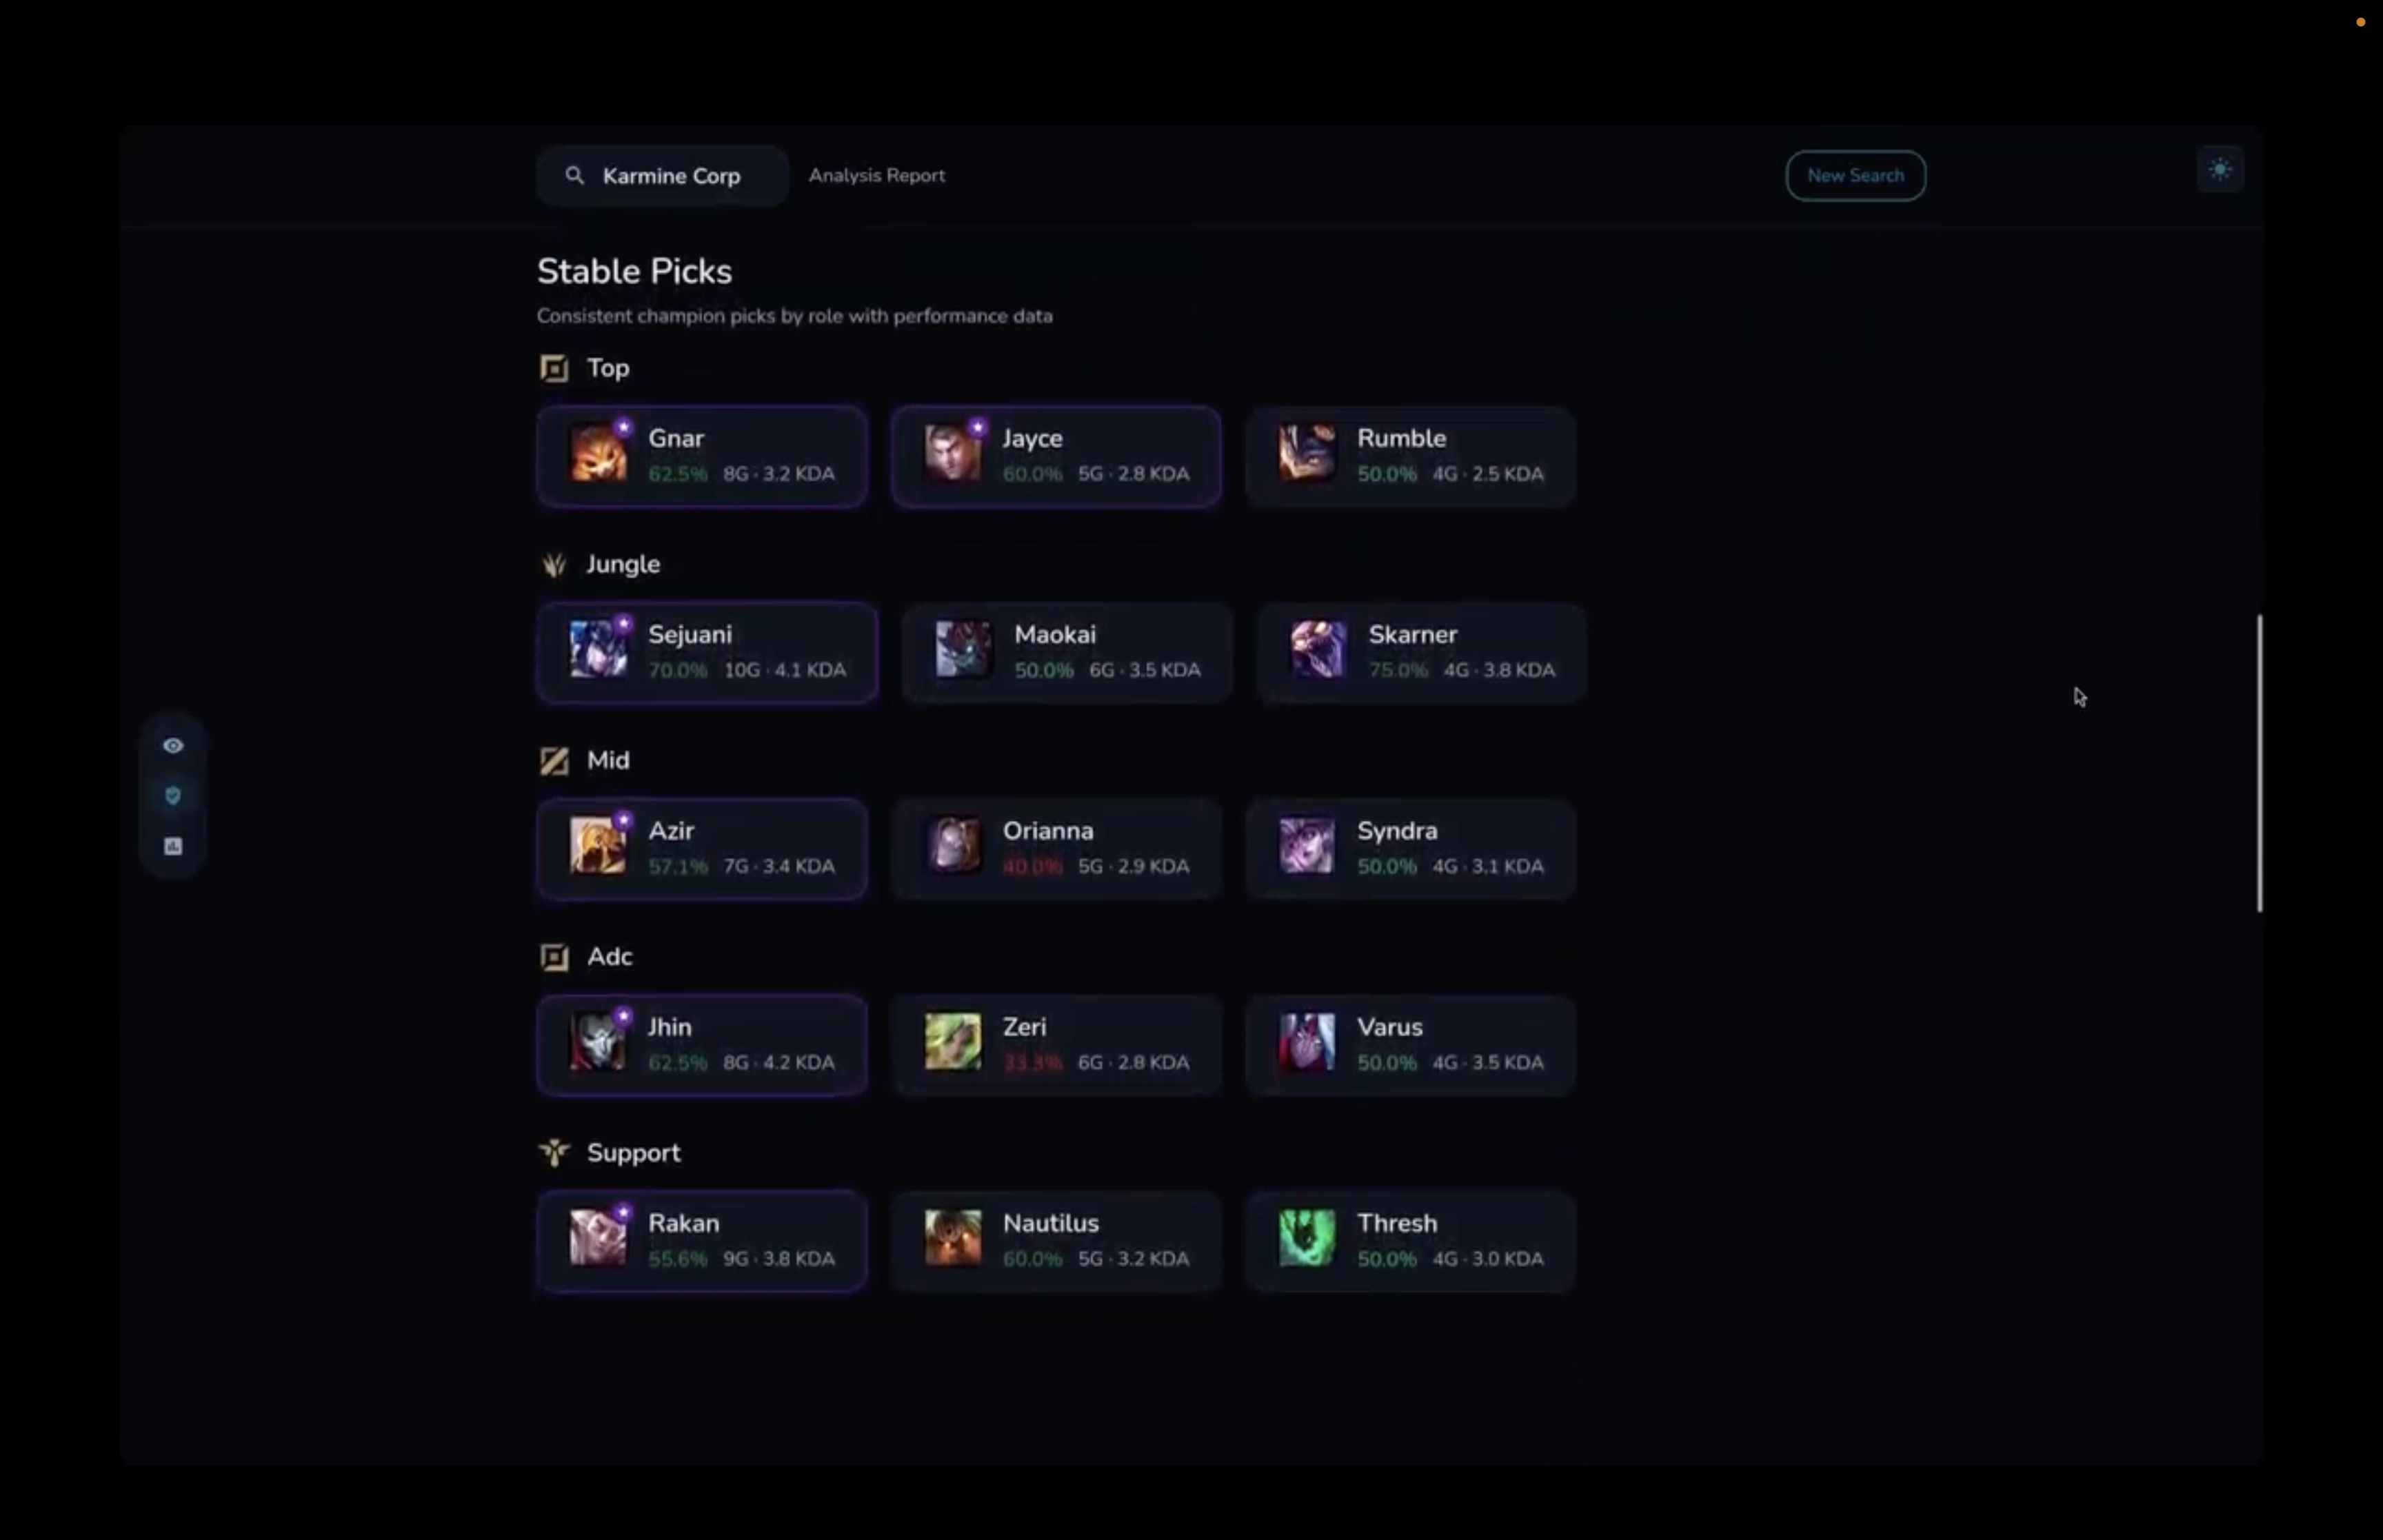
Stable picks for each lane
-
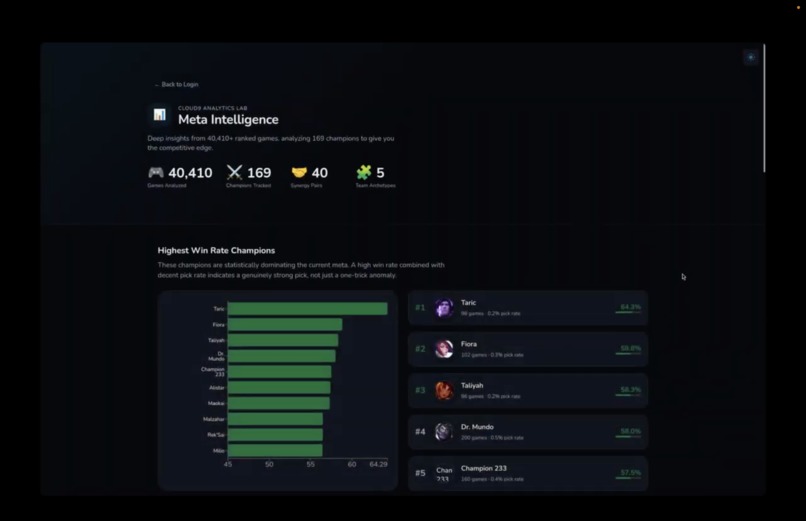
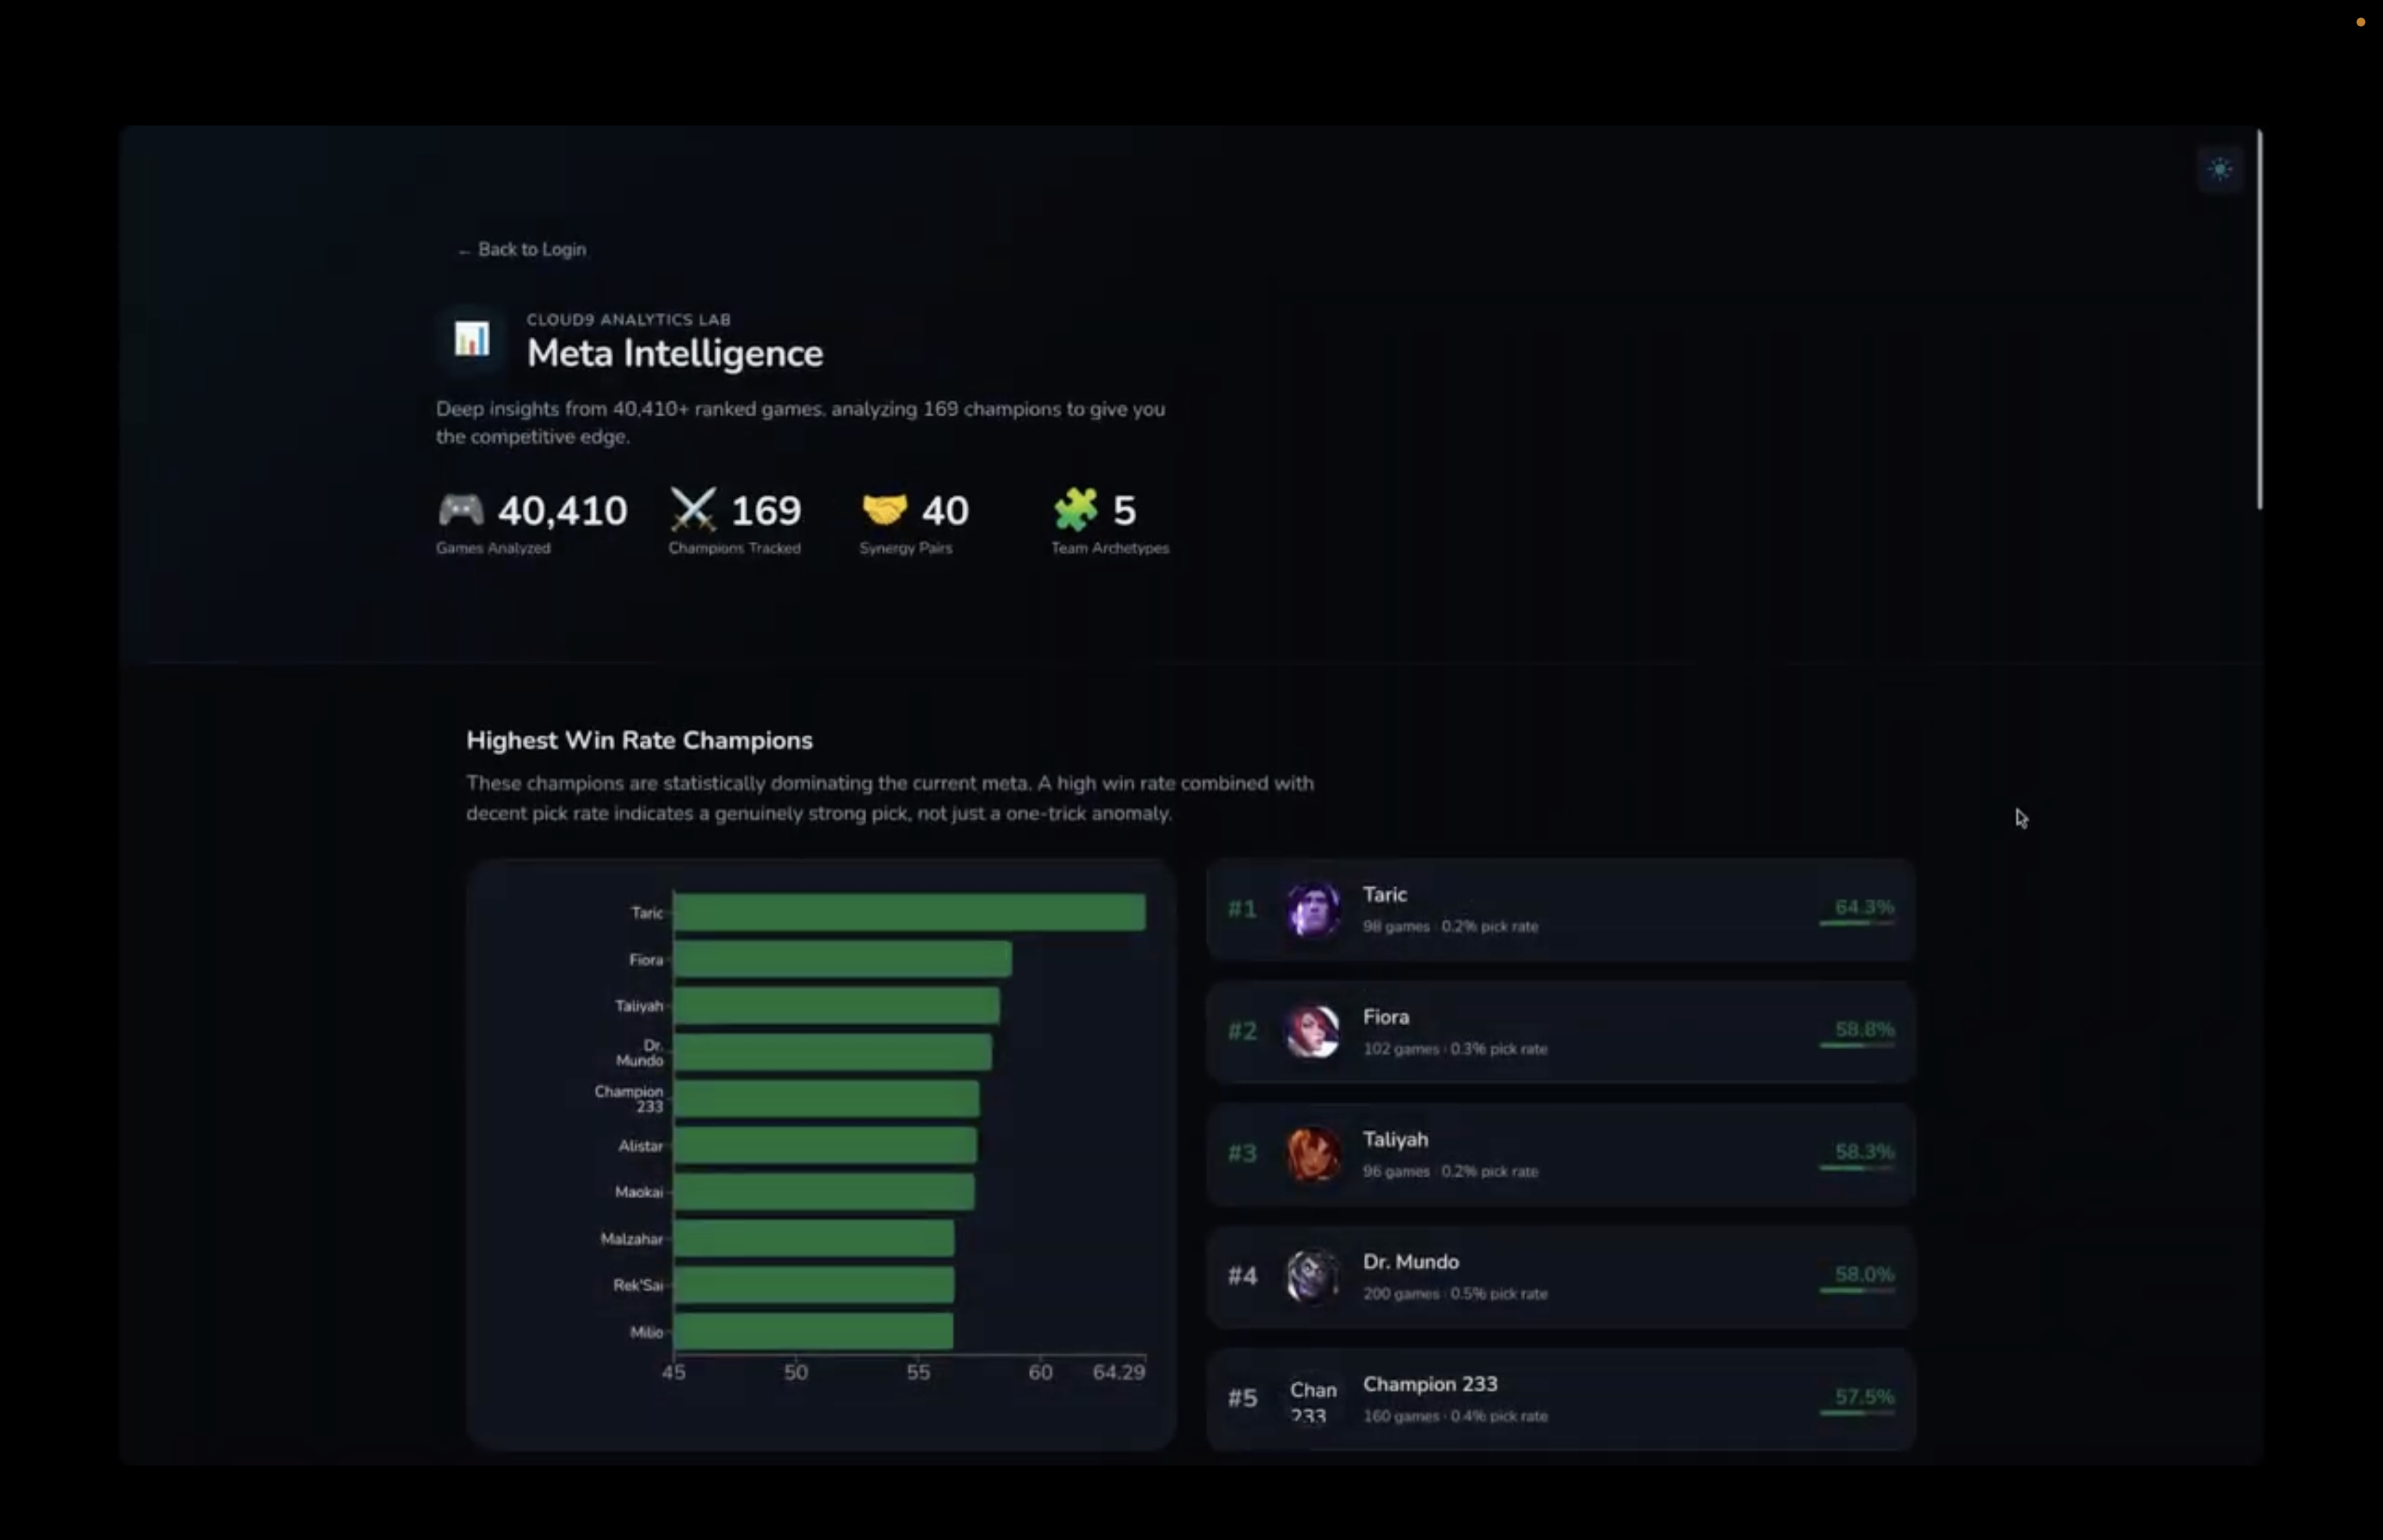
Meta intelligence
-
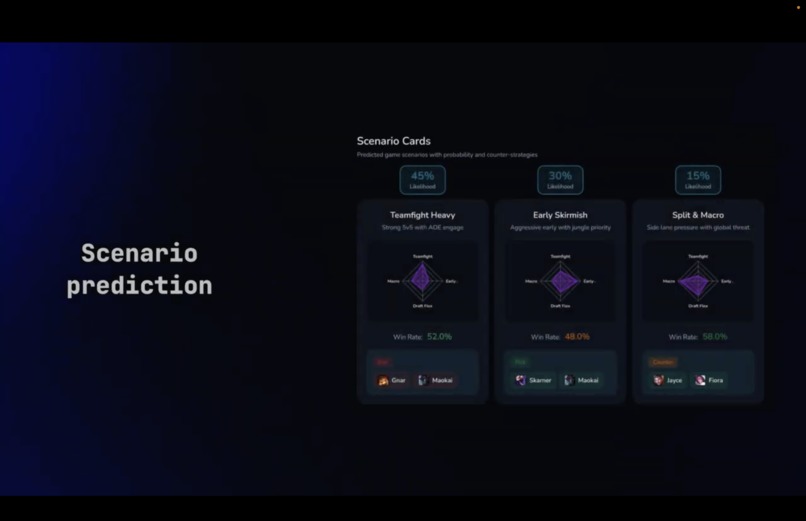
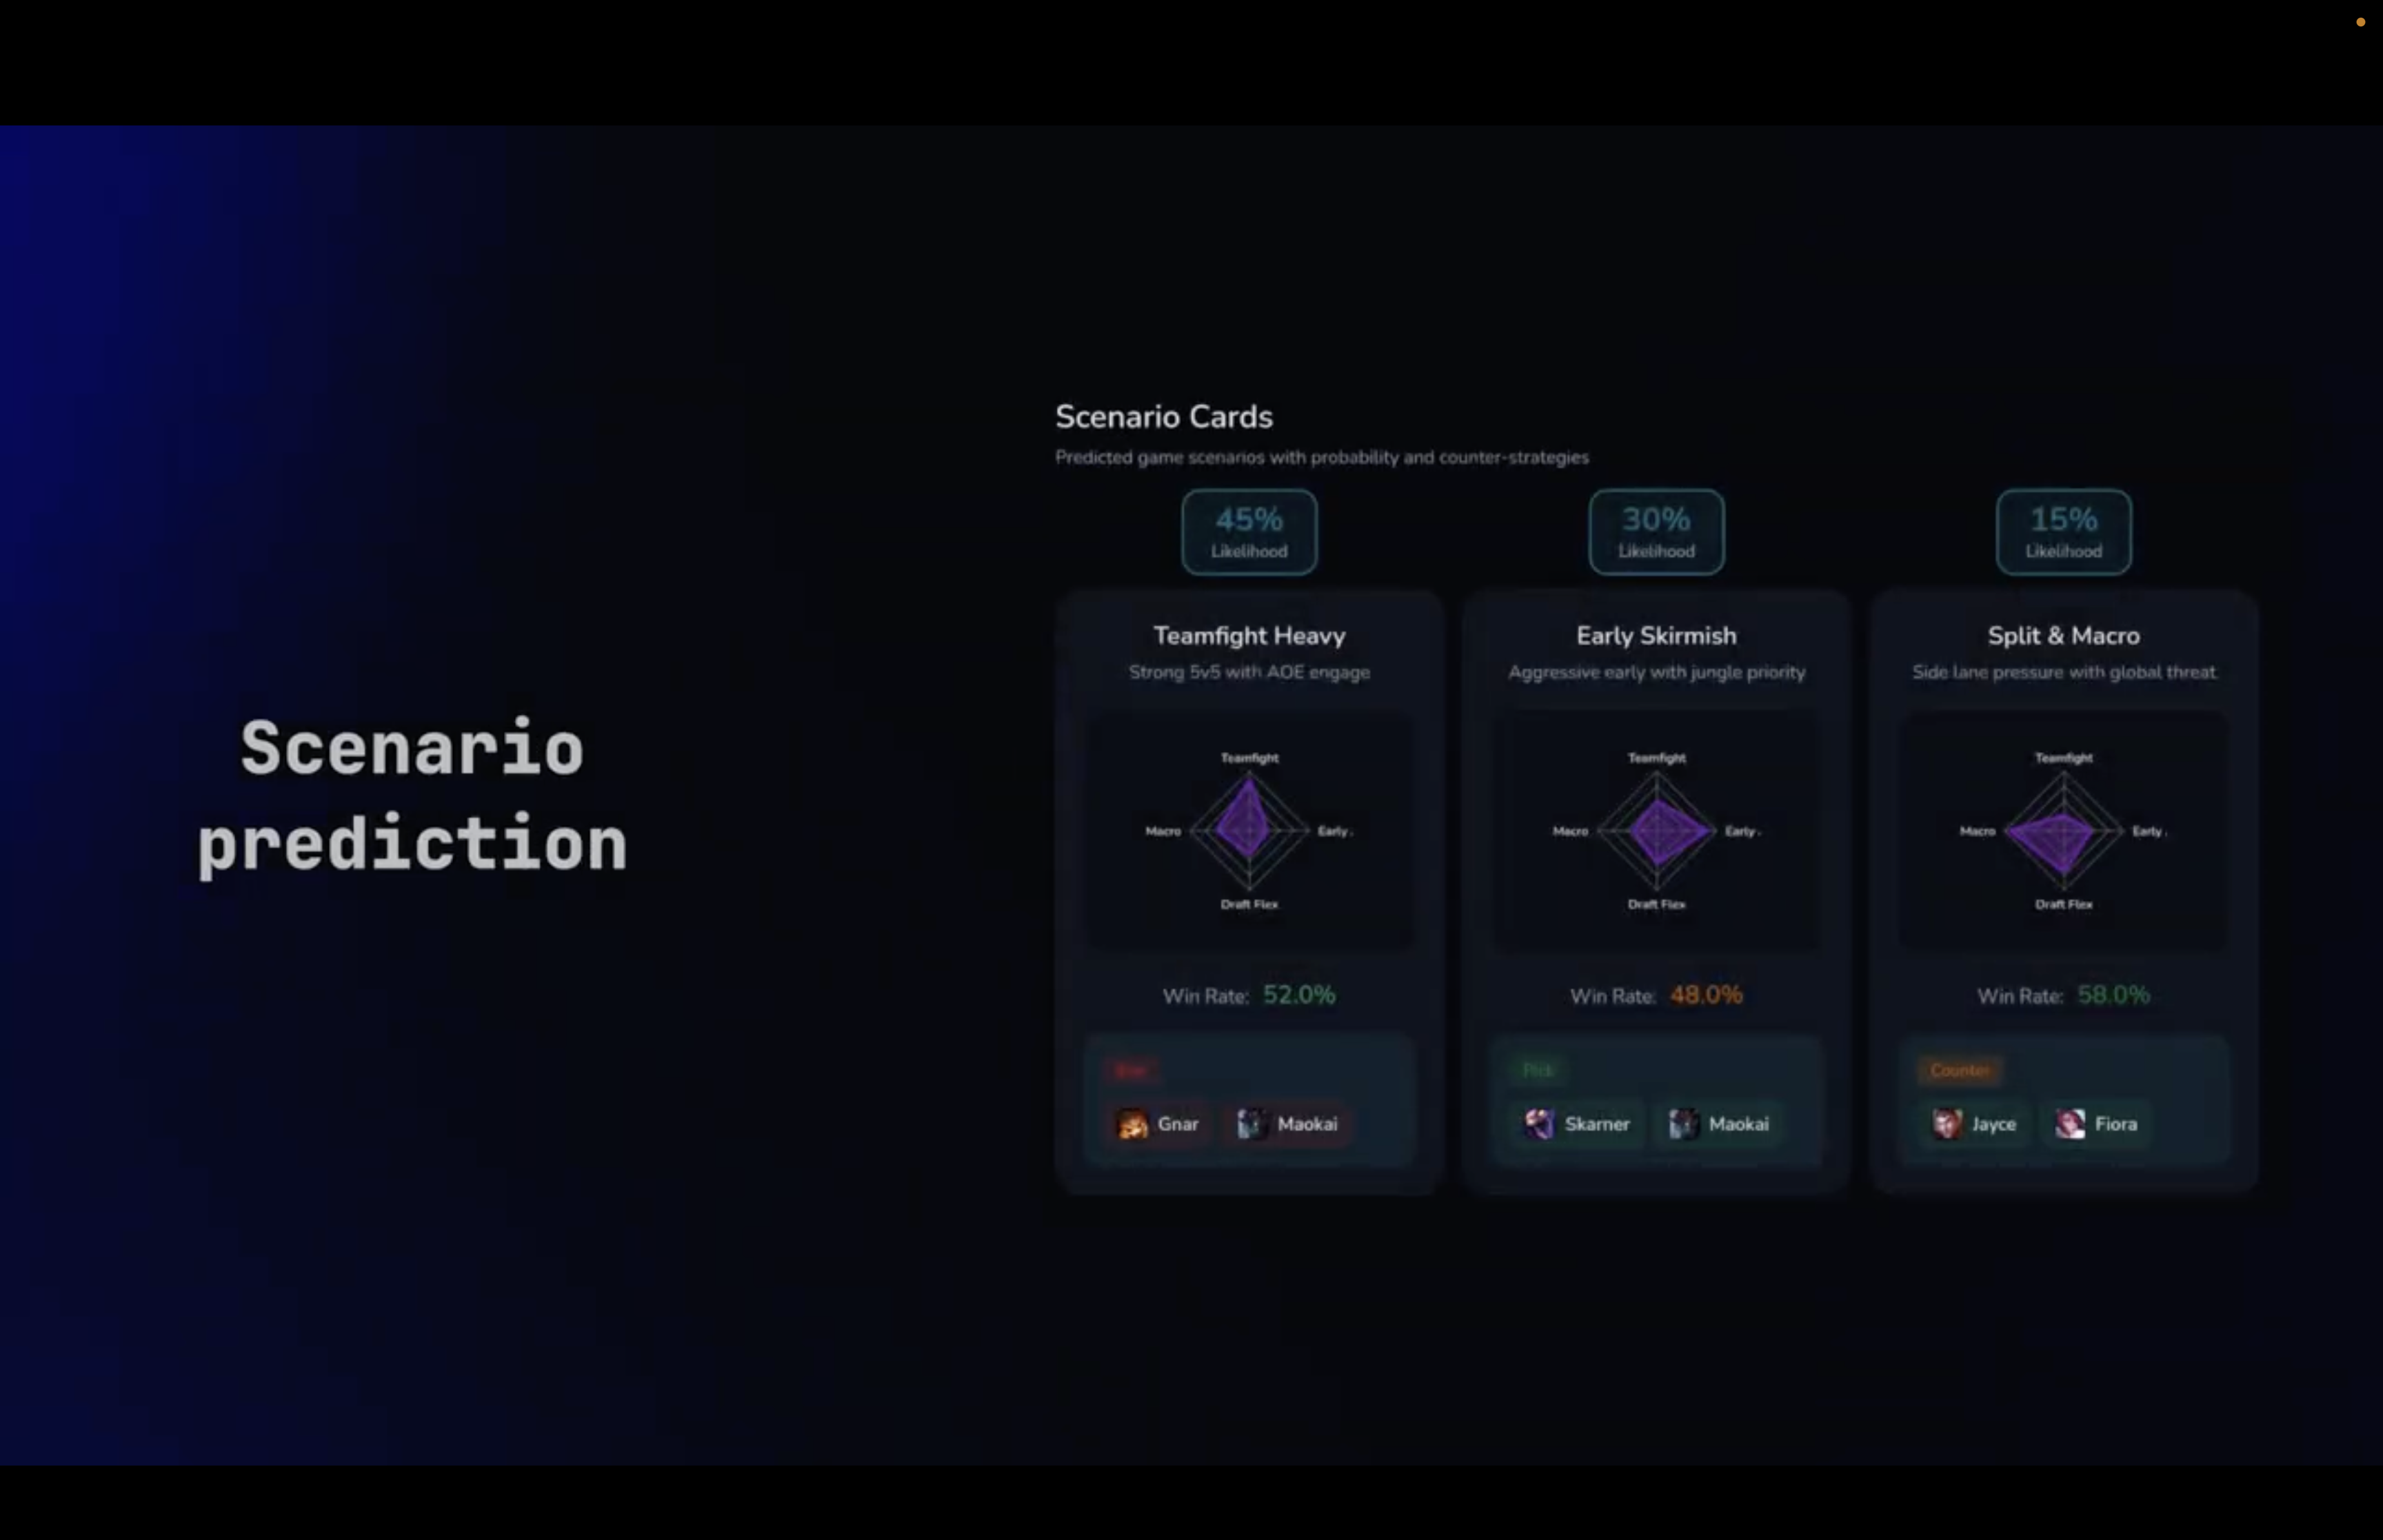
Scenario prediction
-
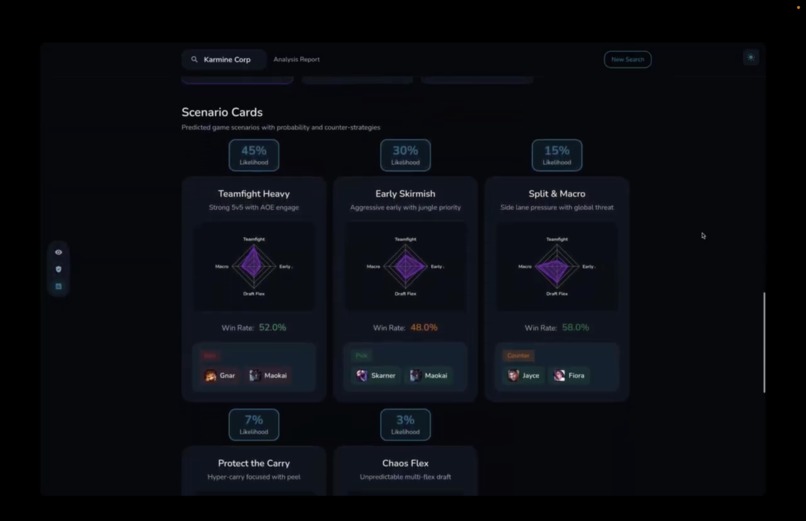
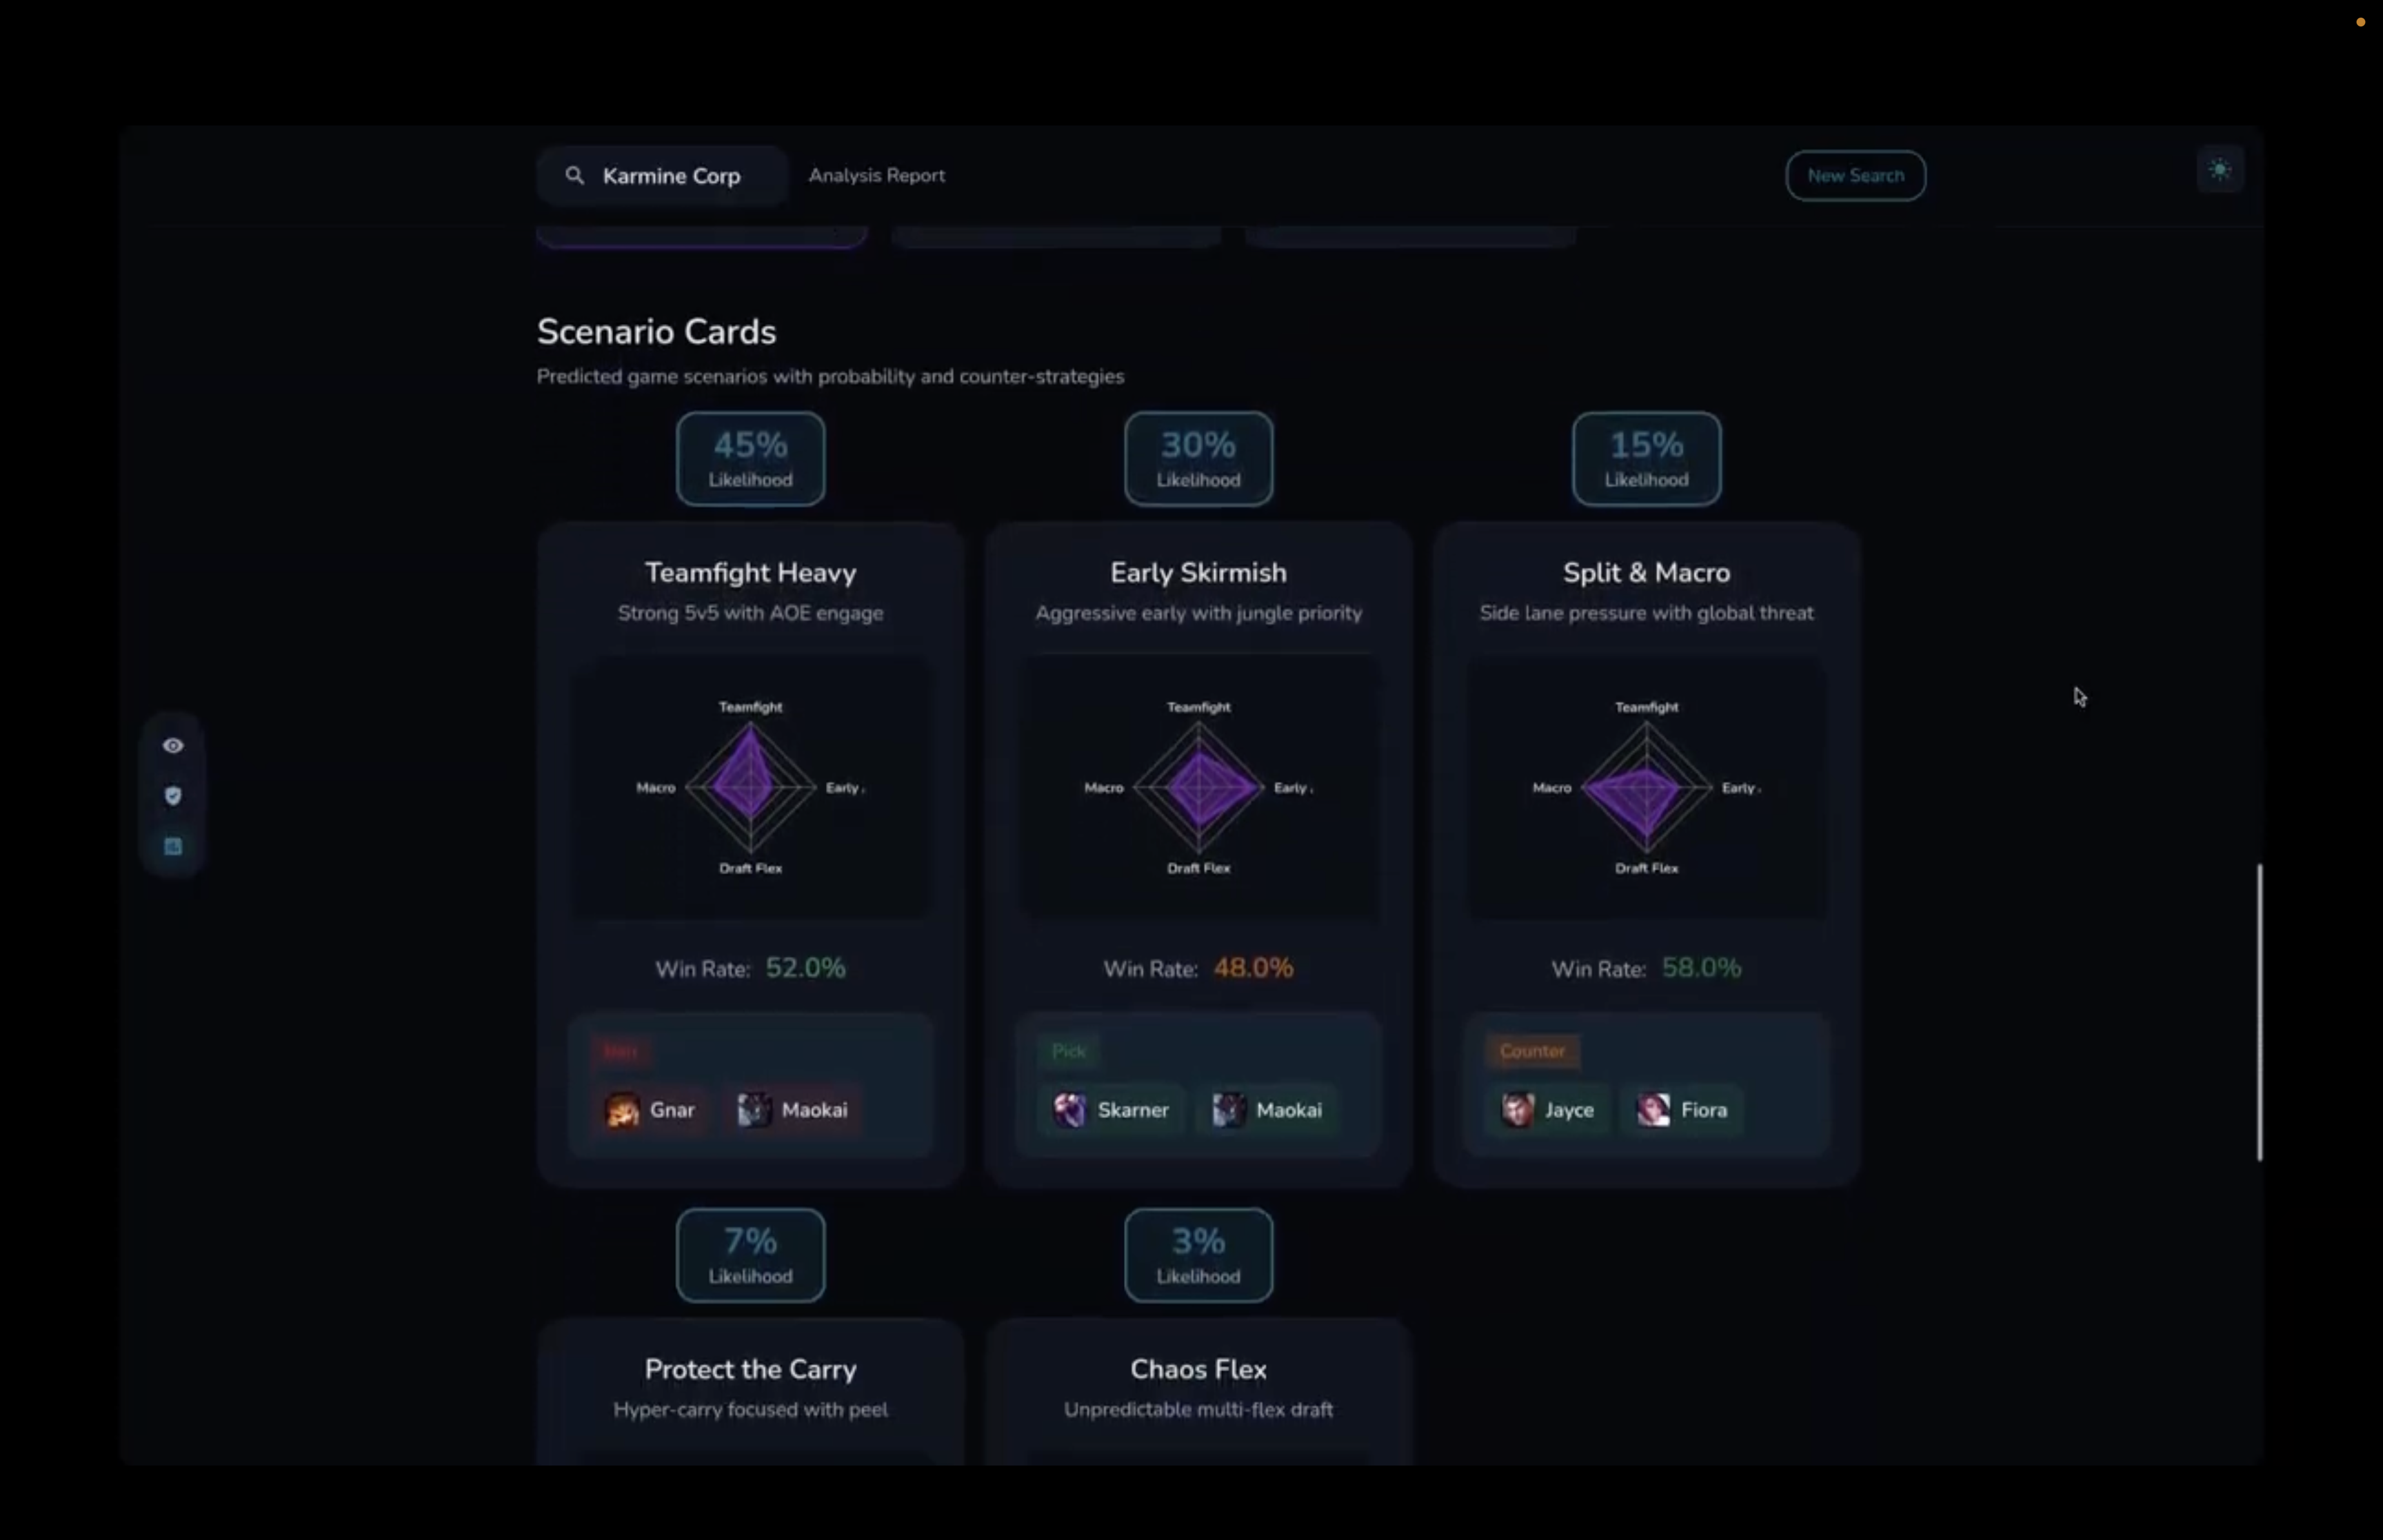
Scenario cards
-
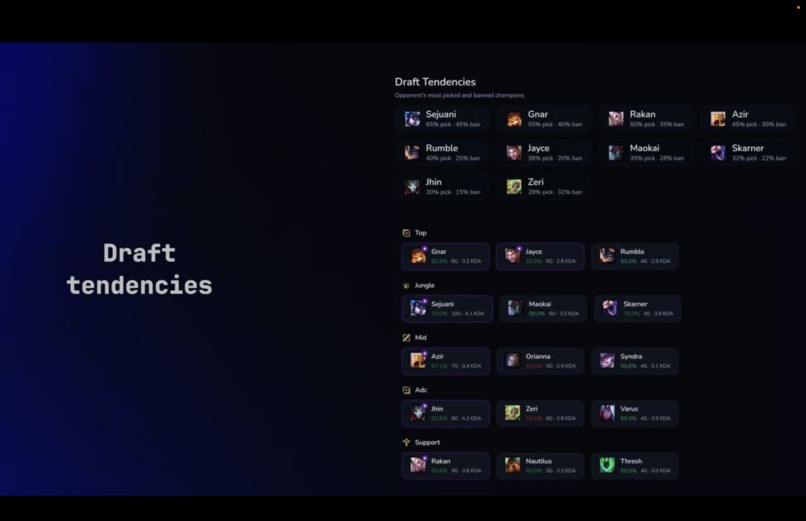
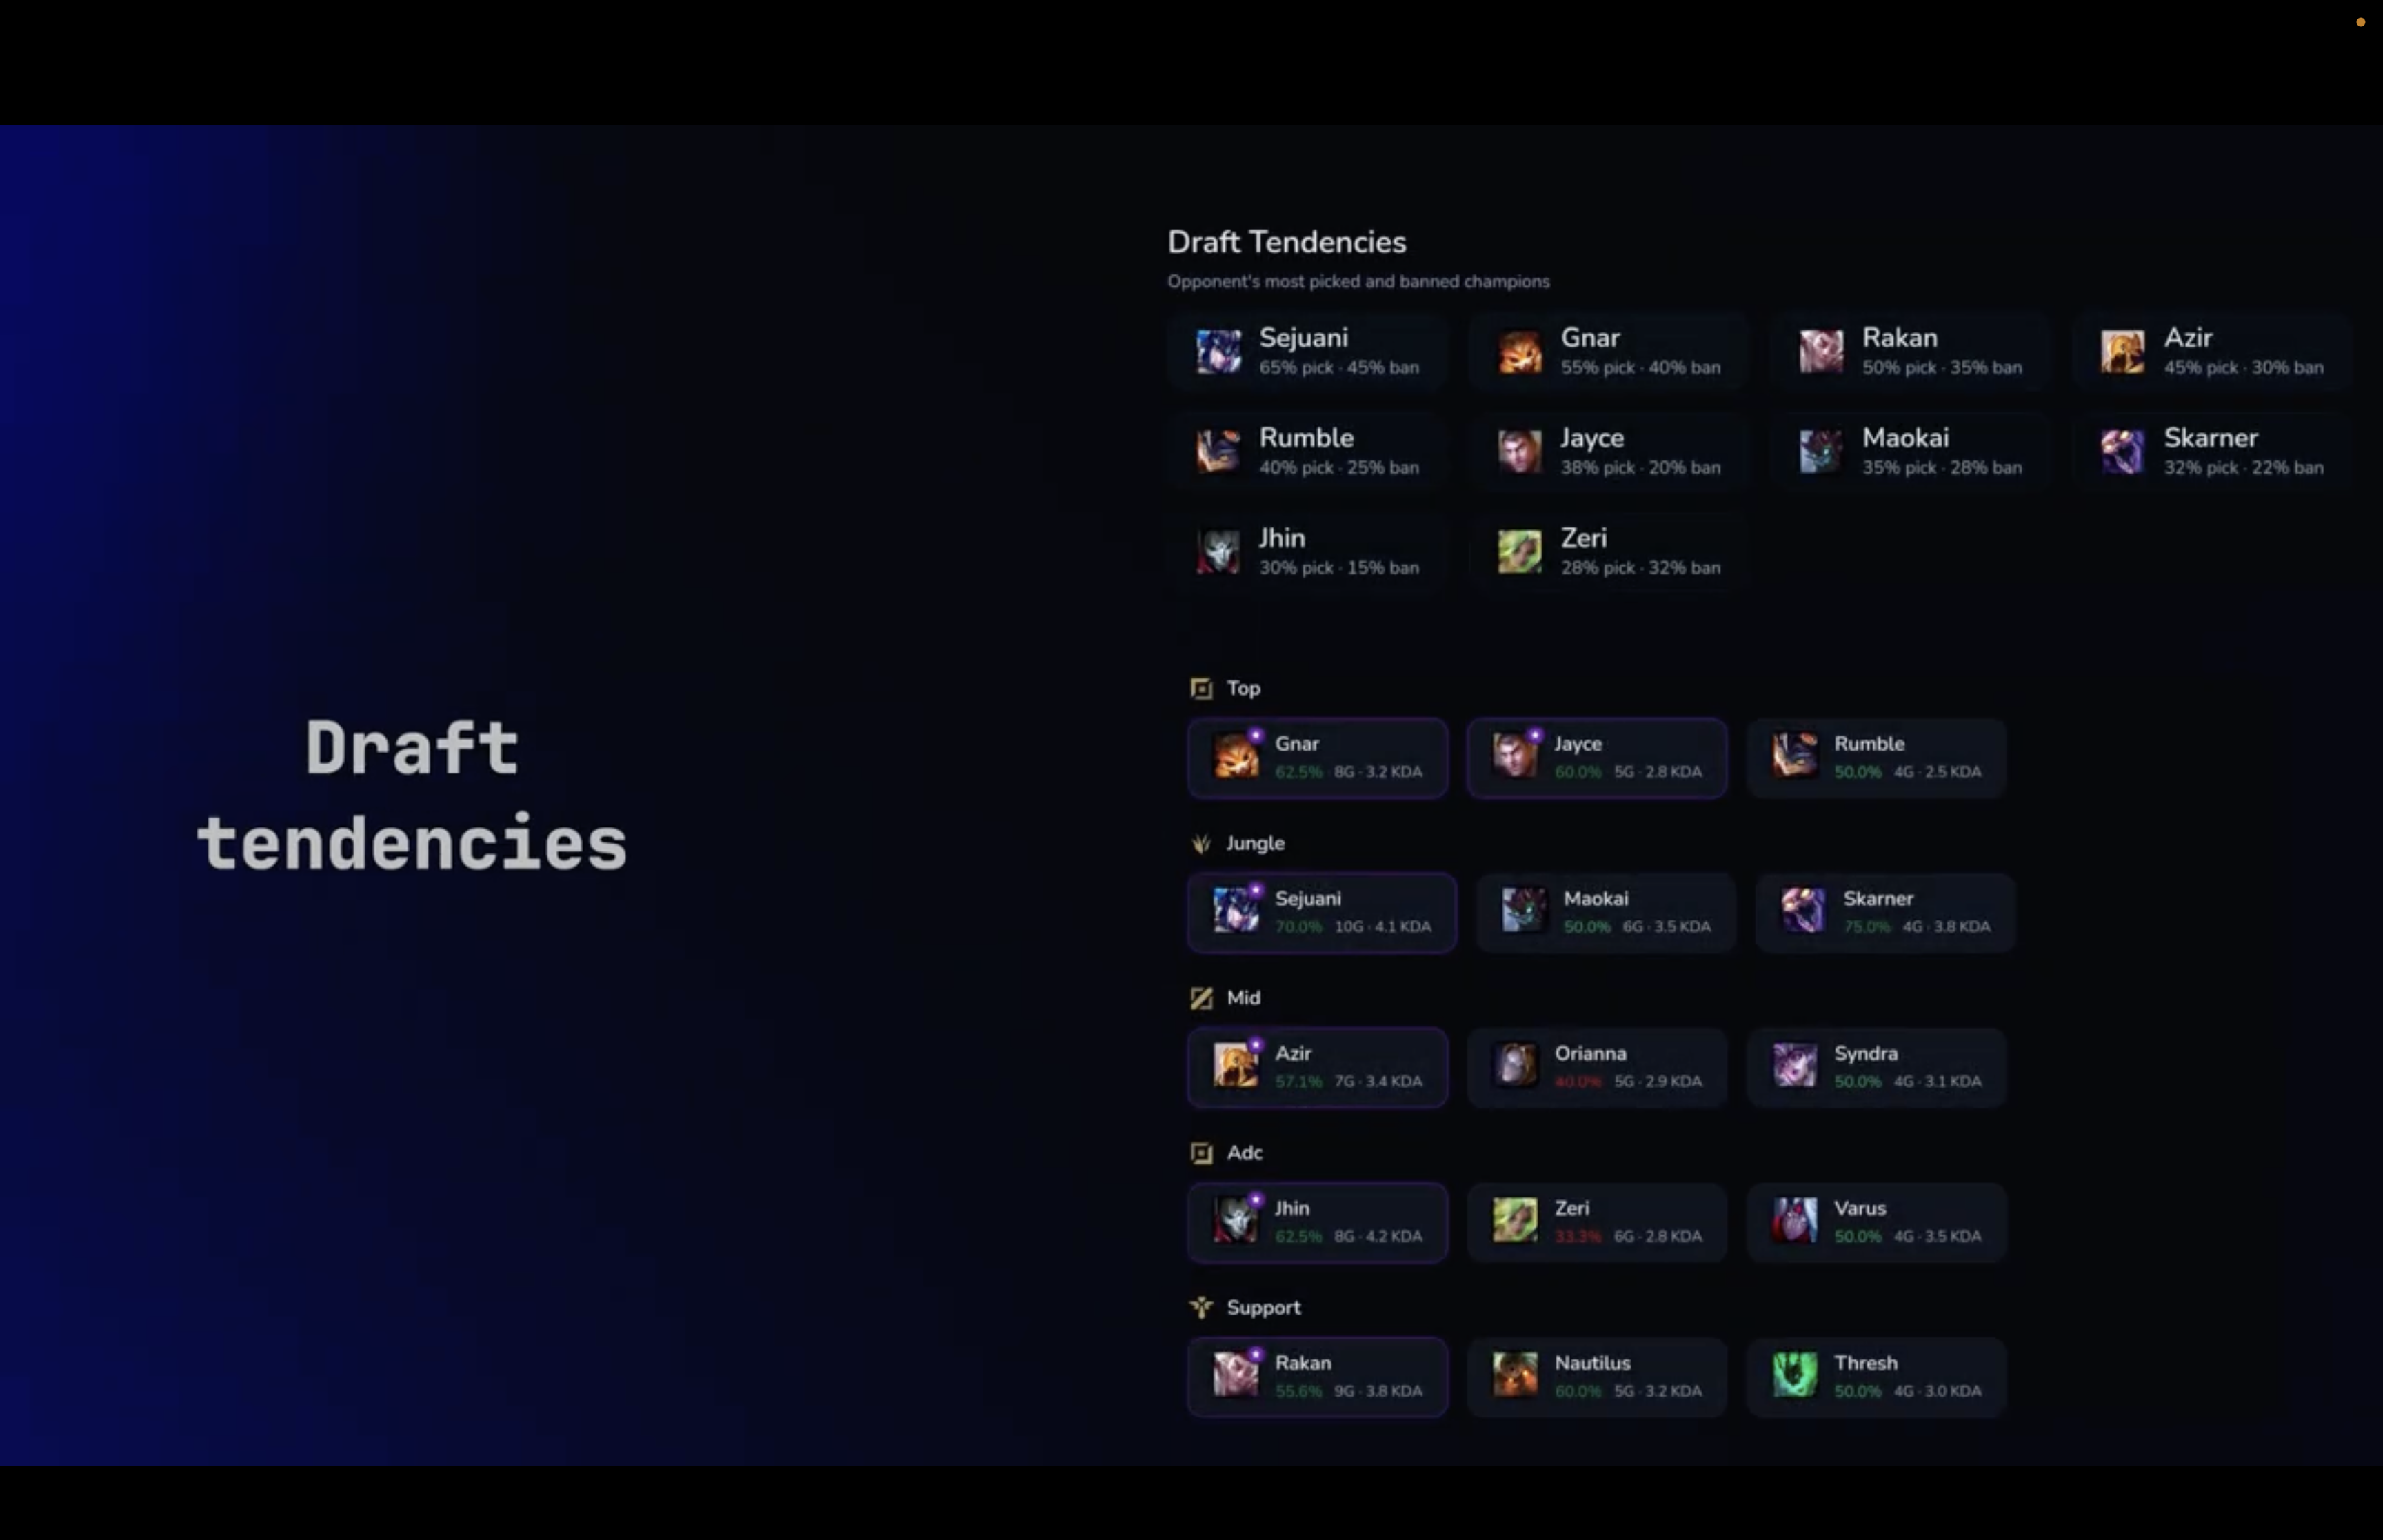
Draft tendencies
-
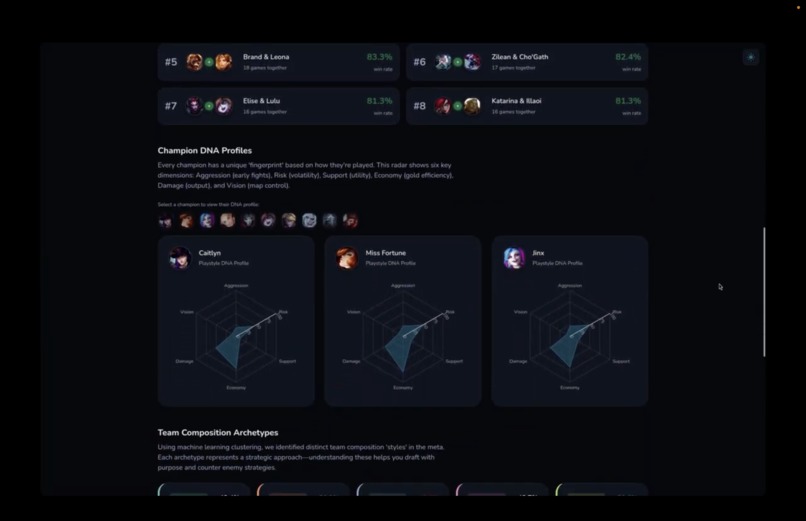
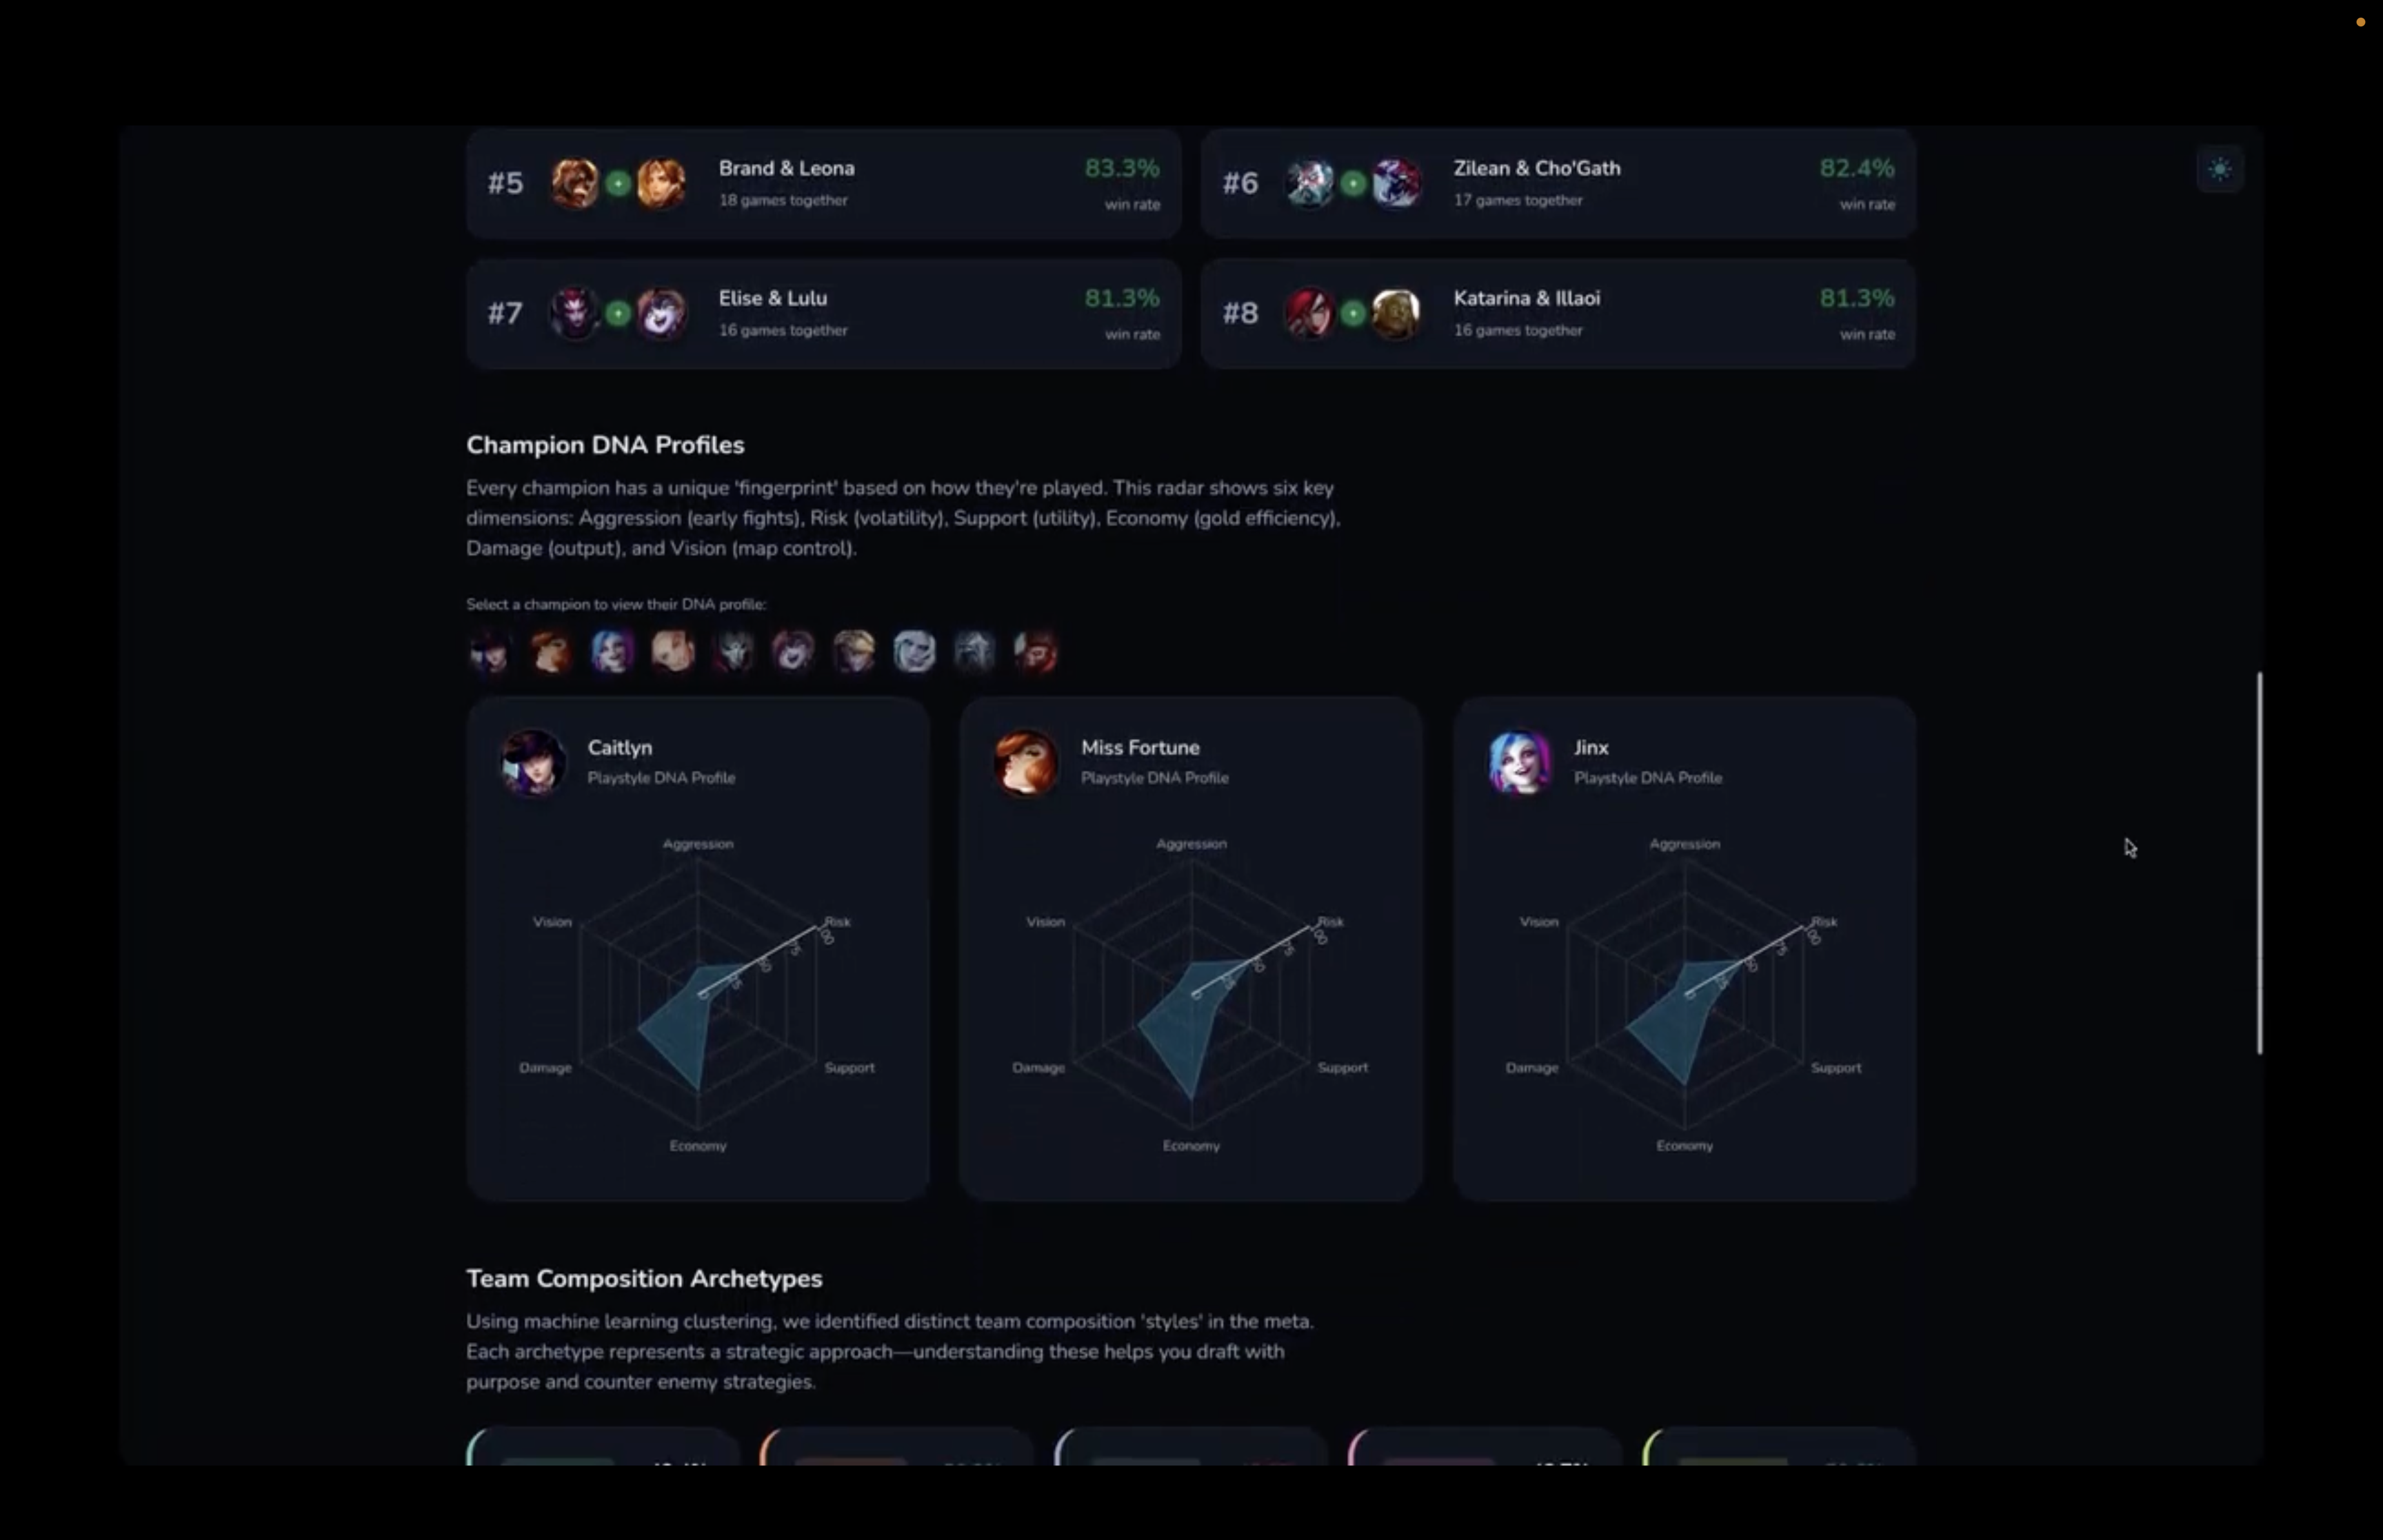
Champion profiles
-
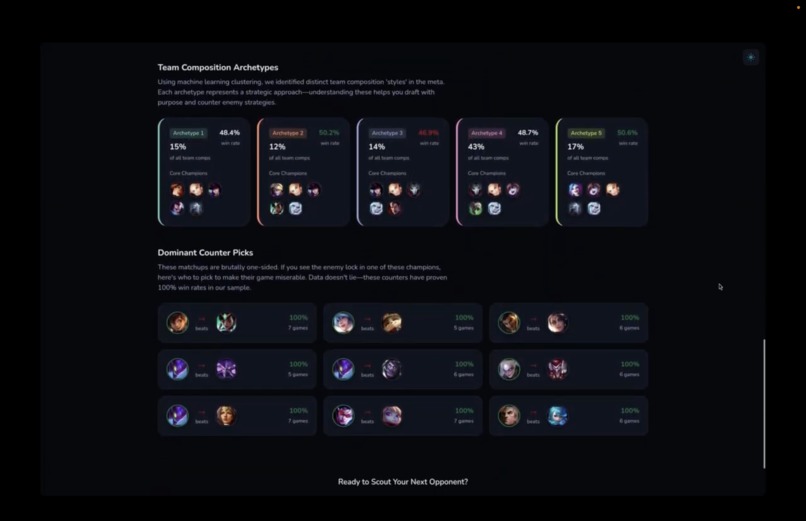
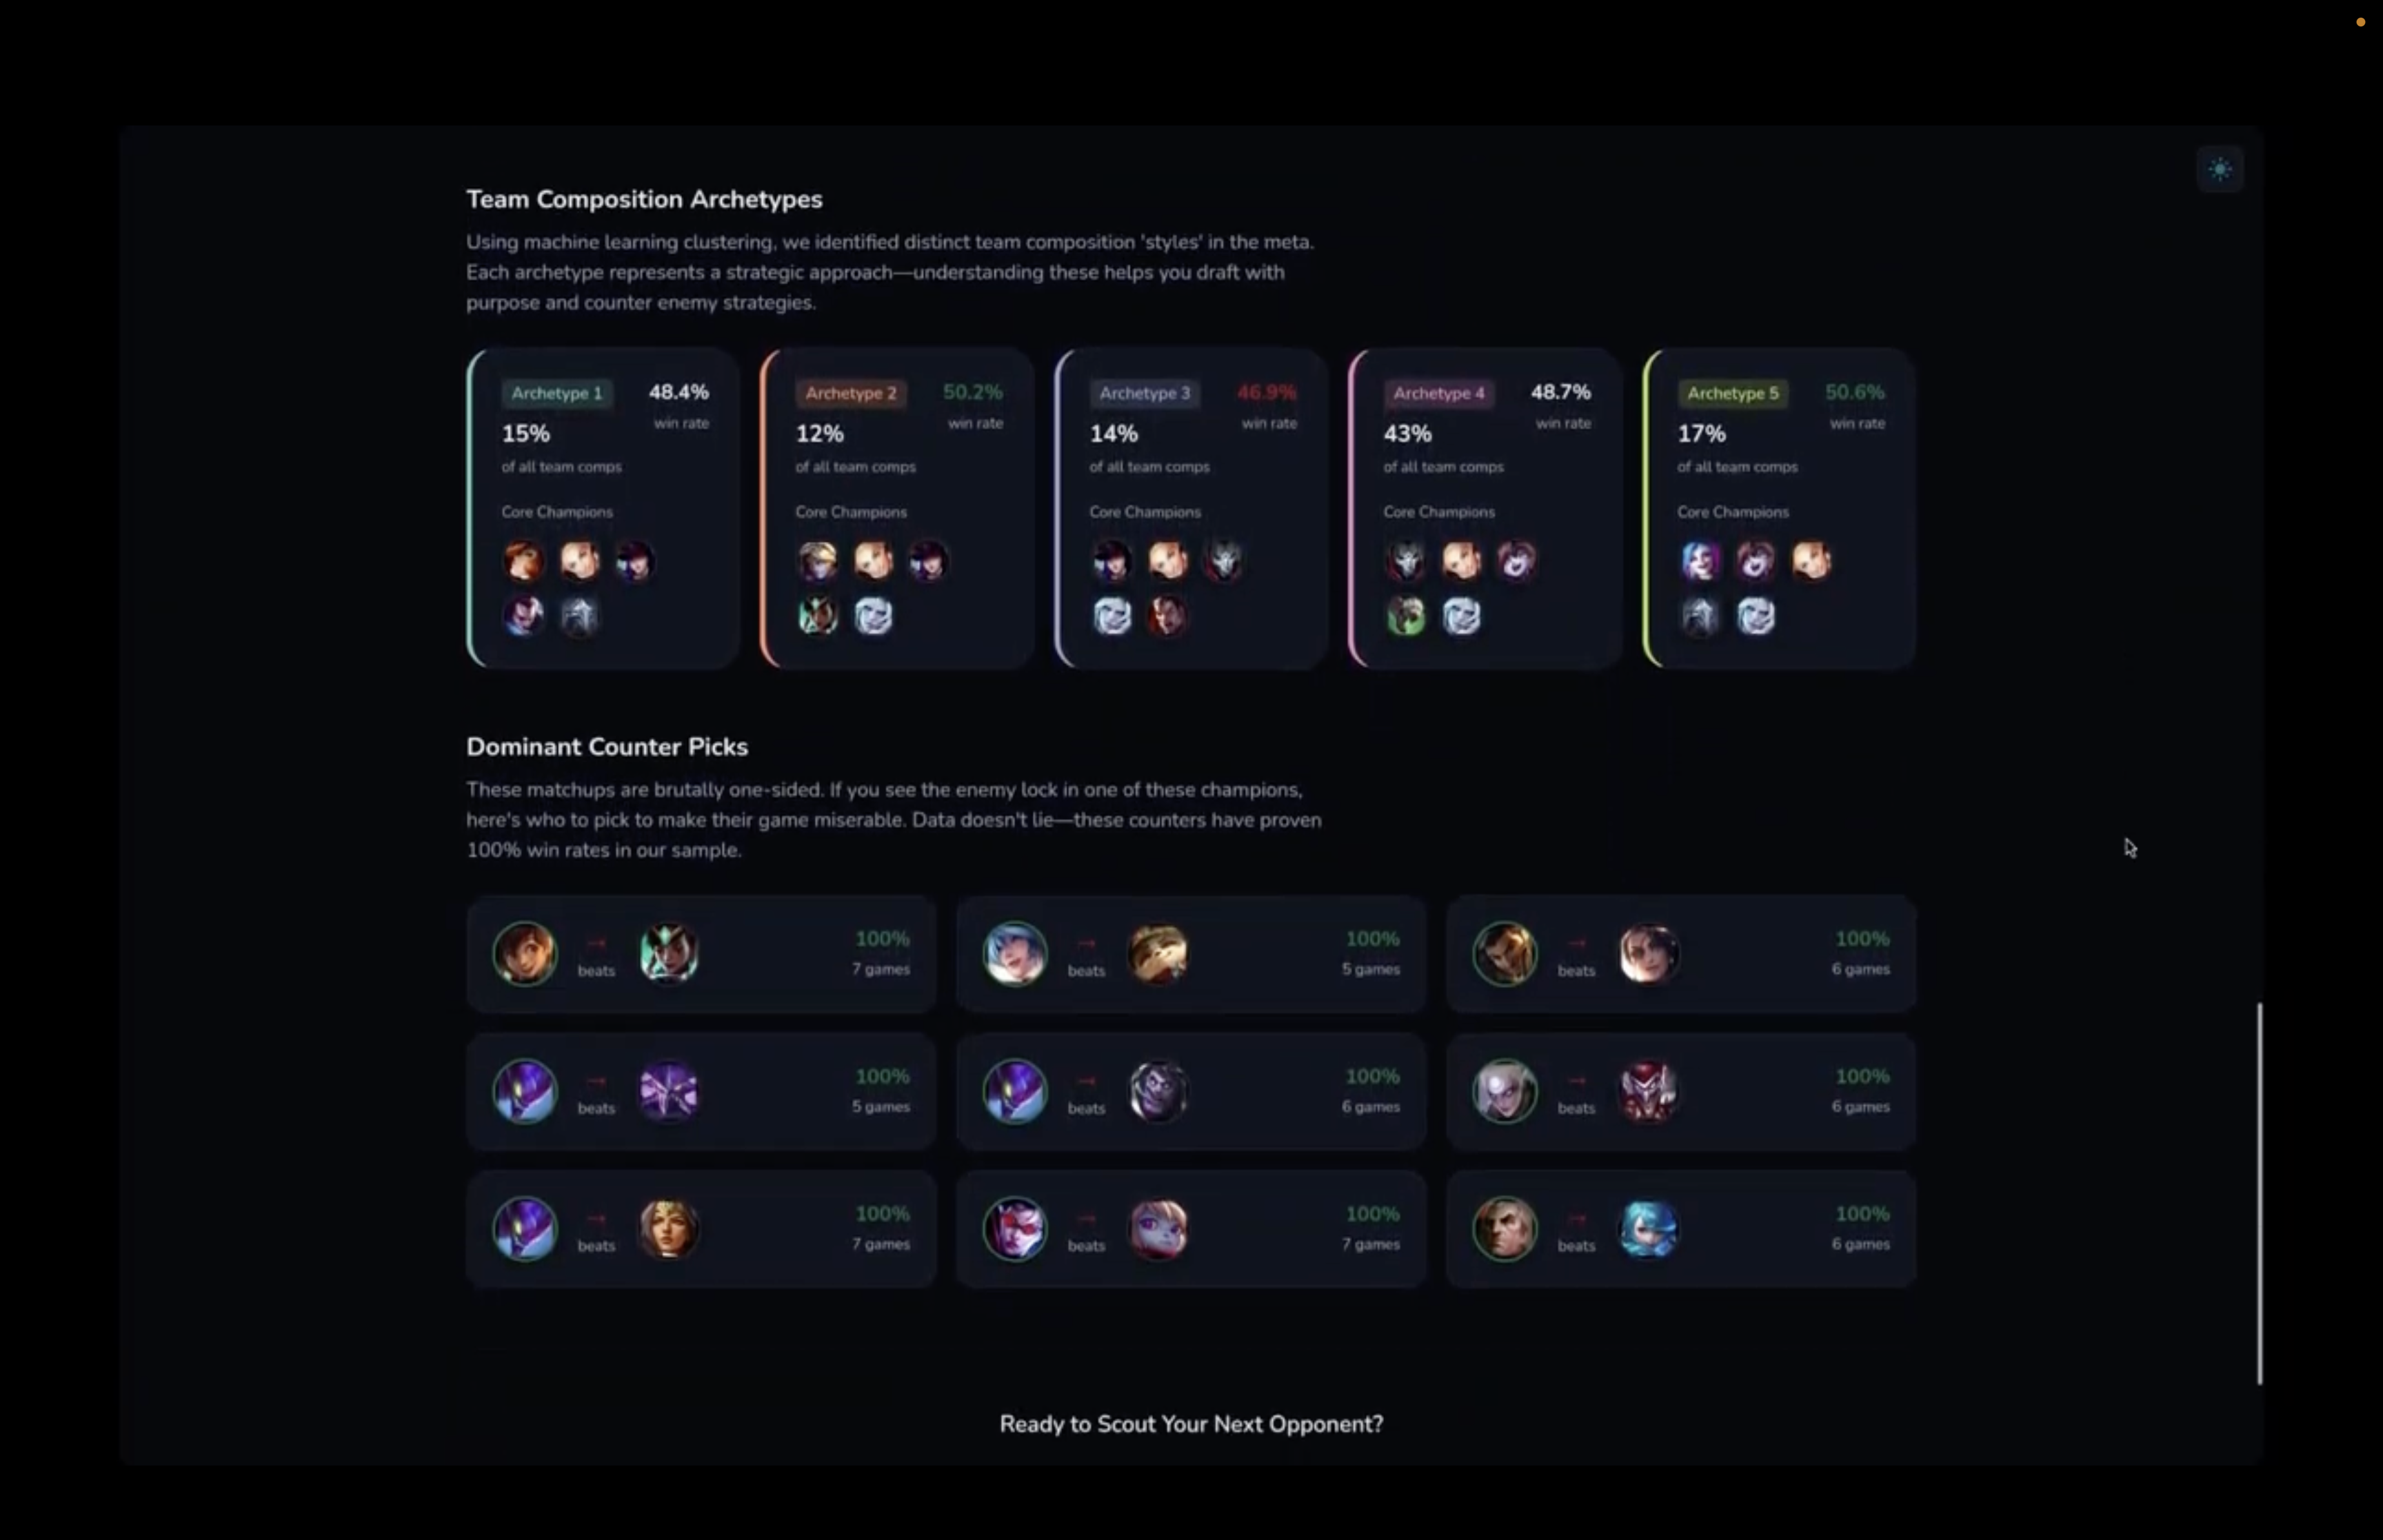
Team composition Archetypes
Where it started
I only played League of Legends for a short time - long enough to feel the intensity of the game, but not long enough to build that instinctive “database in your head” that experienced players develop. My teammate, on the other hand, used to play seriously. He didn’t just remember champions - he remembered patterns: how teams default under pressure, how drafts telegraph a plan, how early tempo shows up before the first objective even spawns. That contrast became the spark. We were watching pro play and thinking about how preparation actually works at the top level: analysts turn chaos into clarity. They don’t just collect match history — they convert it into actionable coaching language: tendencies, priorities, win conditions, draft identities. And we kept coming back to one idea: What if the “analyst advantage” wasn’t locked behind time and manpower? What if you could generate a sharp, coach-ready scouting report on demand — fast enough to matter, structured enough to trust? So our team of two set out to build something aimed squarely at professional workflows: a tool that turns recent match data into a compact opponent dossier you could realistically use before a scrim block.
What we built
We built an Automated Scouting Report Generator that takes an upcoming opponent and produces a concise, analyst-style scouting report based on their recent games. The report focuses on the kind of information teams actually use:
- Role-based champion pools (real pick frequency, not theory)
- Draft identity (engage / poke / front-to-back / pick / scaling)
- Early-game patterns (first gank timing, invade frequency, lane priority)
- Objective bias (dragon stacking vs Herald tempo, first objective timing)
- Repeatable game plans (how they tend to win, and where they bleed tempo) The core output wasn’t meant to be flashy. It was meant to be usable: something a coach can read quickly, share with the team, and translate into draft and game-plan decisions.
How we built it
We assembled a pipeline that behaves like a lightweight analyst: Opponent → fetch recent matches → extract features → detect stable trends → generate a narrative To turn stats into real “tendencies,” we used simple but disciplined rules: pick rates, timing distributions, frequency thresholds, and stability checks to avoid overreacting to one-off games. A very basic example we used: $$ [ \mathrm{PickRate}_{\text{champ}} = \frac{\text{games on champ}}{\text{total games}} ] $$ When a champion crosses a threshold (e.g., 25–30% in the selected window), it gets flagged as a priority comfort pick — the kind of thing you discuss in draft prep, because it reliably shows up when the opponent gets their way. We applied the same philosophy to macro indicators (first objective timing, gank tempo, side selection bias when available): only call it a tendency if it’s consistent enough to bet a plan on it.
The real challenges
This wasn’t hard because the data existed — it was hard because pro scouting demands precision and restraint. Noise vs signal: Match histories are messy. One weird draft or off-role game can distort conclusions. We had to design for stability, not just recency. Defining “meaningful”: Raw numbers aren’t scouting. Scouting is deciding what matters in context and phrasing it like a coach would. Overconfidence is dangerous: A report that sounds certain when the evidence is weak is worse than no report at all. We had to balance clarity with humility — strong statements only when the pattern deserved it. The biggest challenge, honestly, was learning that scouting is a writing problem as much as it’s a data problem. The insights had to read like something an analyst would hand to a coaching staff — crisp, specific, and tied to decisions.
At the top level, time is the real constraint. Coaches and analysts operate under intense schedules: scrims, VOD review, draft prep, opponent research — repeated constantly. Our goal is not to replace analysts. It’s to compress the tedious part: auto-summarize opponent tendencies surface repeatable patterns fast provide a clear “starting point” for deeper review In other words: less time mining data, more time making decisions. If the report can shave even an hour off prep while keeping the key signals intact, that compounds across a season.
What we learned
The hard part isn’t access to data — it’s turning it into reliable decisions. A good report is not a list of stats. It’s a narrative with intent: “This is what they prefer, this is what they avoid, this is what we can punish.” Even lightweight models and rule-based language, if designed carefully, can create output that feels legitimately professional.
What’s next
For pro use, the next step isn’t “more stats” — it’s explainability and decision support: every conclusion should be traceable, testable, and usable in a prep conversation.
- Explainable insights (no black-box claims): every tendency gets a Why this matters line plus the supporting evidence: sample size, consistency, and the top 3 games that most strongly drive the pattern.
- Matchup mode (opponent vs us): generate prep specifically for this pairing — bans that matter, picks that deny comfort, and early-game plans that attack their defaults. Not generic advice: our tendencies vs their tendencies, with targeted “if we do X, it breaks Y” recommendations.
- Counterfactuals & what-ifs: “What happens if we remove their top comfort pick?” “How does their win rate / early tempo shift without it?” Even simple counterfactual tables make the report feel like a real strategic tool.
- Analyst-in-the-loop learning: let staff mark insights as “useful / misleading” after a scrim block, so the system adapts thresholds and wording to match how your team scouts.
Long-term, the goal is a report that doesn’t just describe an opponent — it defends its claims and turns them into a plan you can execute on stage.
Built With
- graphql
- grid
- hexagonal
- matplotlib
- numpy
- python
- react
- reportlab
- scikit-learn

Log in or sign up for Devpost to join the conversation.