-
-
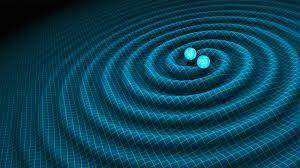
(Image 1) Diagram of the effect of gravitational waves on spacetime (not created by the project)
-
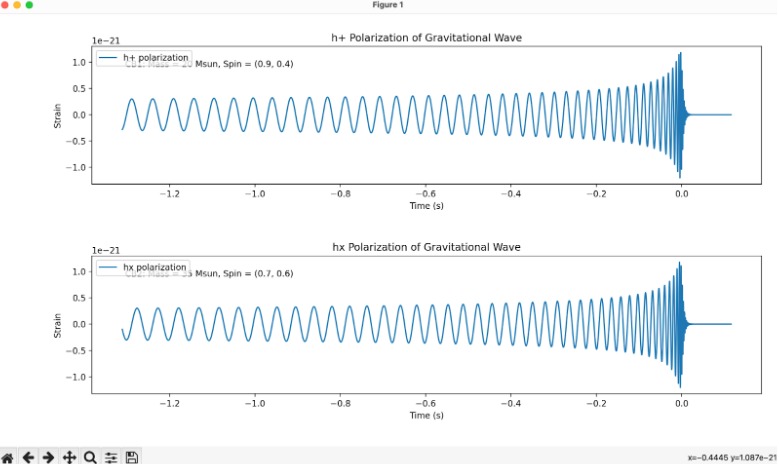
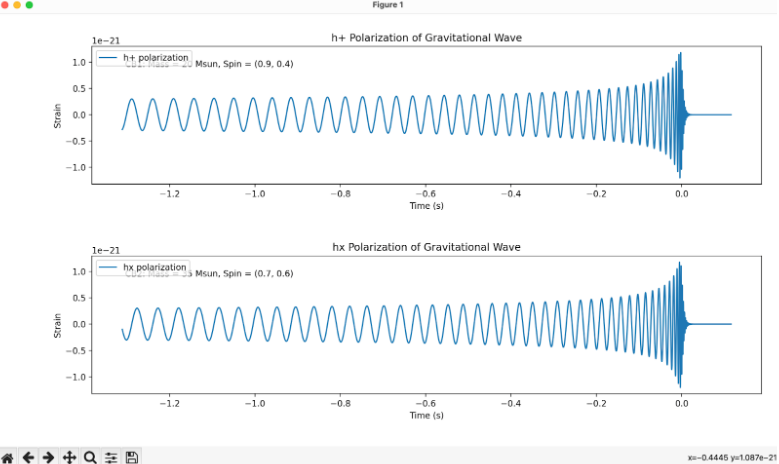
(Image 2) Two-dimensional graph made by our script which displays the waveform created by the gravitational waves of a given binary system
-
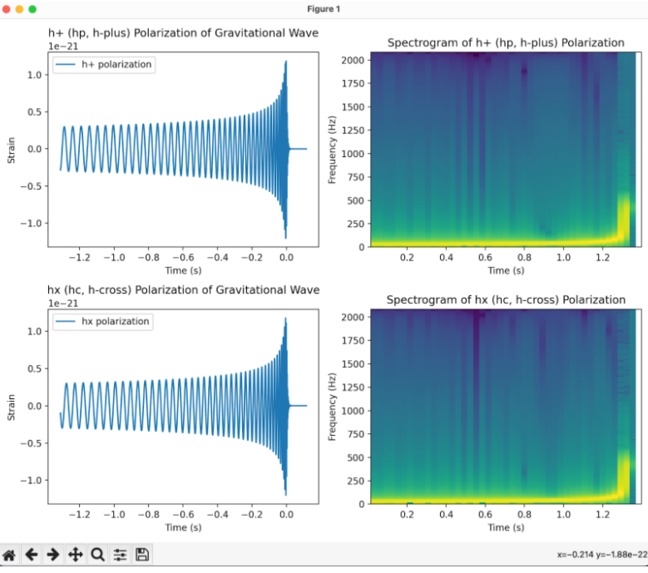
(Image 3) Edited Python script that adds the spectrogram of the frequency of the waveform graph to the output.
-
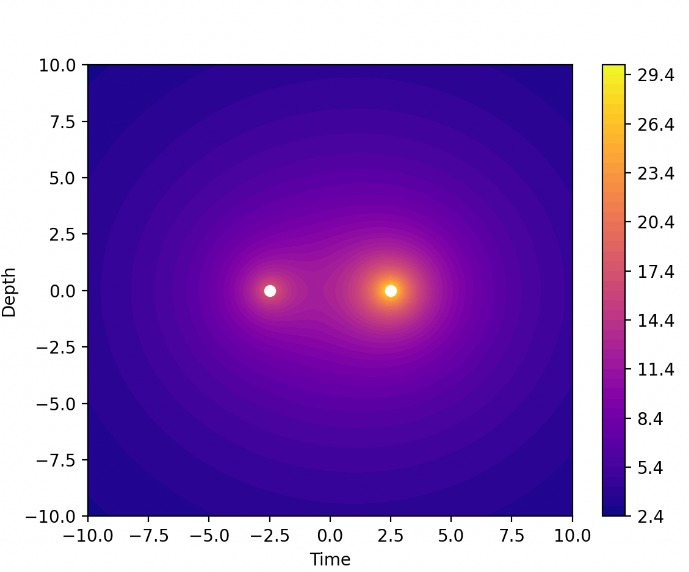
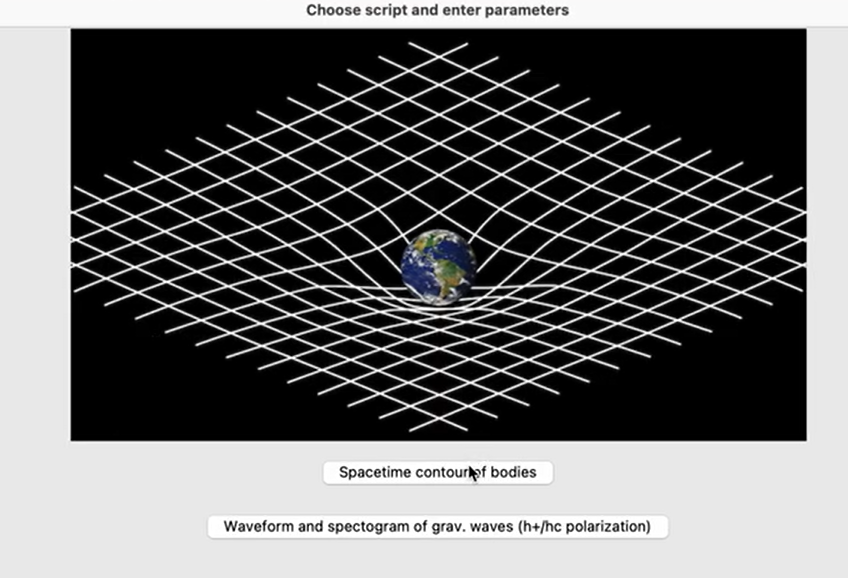
(Image 4) Contour graph that shows how the mass of the two celestial objects effect the fabric of spacetime
-
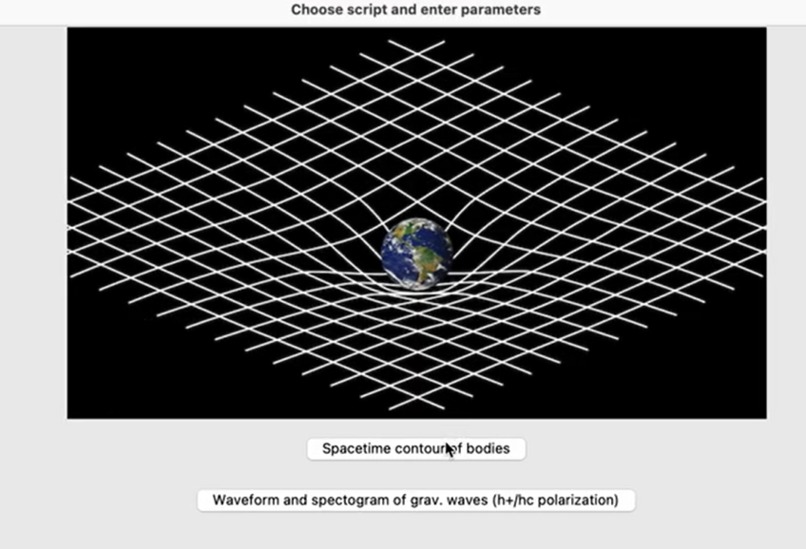
(Image 5) Landing page which allows the user to select which graphs they want to see given they enter the specified parameters


Inspiration
The recent release of NANOGrav's fifteen year data set compromised of recorded data created by astronomical events given by the LIGO, Virgo, and KAGRA structures, which records gravitational waves created by these events.
What it does
Our project simulates the creation of gravitational waves of binary systems given certain parameters. The project contains graphs and a contour diagram of the gravitational waves created by the binary system. In specific, the script creates a two-dimensional waveform graph of the gravitational waves created by the binary systems, a spectrogram of the frequency of said waveform graph, and a contour graph that visualizes how the two celestial objects affect spacetime.
How we built it
We built our project in python, using the open source modules of PyCBC and MatPlotLib to help us graph the two-dimensional waveform representation of the gravitational waves created by the binary system, and MatPlotLib to create a two-dimensional view of how the celestial objects in the binary system effect spacetime in the form of a contour graph. Finally, in order to make the program user-friendly, we created a landing page which allows the user to determine the values of the necessary parameters without having to go into the source code. To a lesser extent, we used NumPy to initialize arrays necessary in calculations.
Challenges we ran into
Some challenges we ran into whilst creating this project was figuring out the specific parameters that we were required to include, and how they effected the waveform of the gravitational wave. Furthermore, we were required to learn and understand some more complex math concepts in order to understand how those gravitational waves effect spacetime. Some concepts that we had to learn includes the Kerr metric and Christoffel symbols. Along with this, we faced difficulty in showing the effect that the binary system had on spacetime in the form of a contour map.
Accomplishments that we're proud of
Some accomplishments that we are proud of include successfully creating a contour graph that expresses the effect of celestial objects in the binary system on spacetime that could have differing parameters such as mass, and creating a spectrogram of the frequency of the waveform graph that we also created that displays the gravitational wave created by the binary system. Finally, we created a working and user-friendly landing page that allows the users to input the values of the necessary parameters without having to directly change the source code, and also lets the user see what graphs they need.
What we learned
Some things that we learned include the base concepts behind many different parameters such as the Schwarzschild radius of a black hole, Einstein's theory of general relativity, and how the fabric of spacetime functions. Furthermore, we also learned how to employ the Python module MatPlotLib and PyCBC in order to create graphs and explain the specific points about them such as the amplitude of the waveform, and the depth of the fabric of space time in a specific point on the contour graph.
What's next for gravwave
In the future, we plan to refine and hone the accuracy of our script, fully animate the contour graph which will show the collision of the two celestial objects and the gravitational waves of them, and even add new graphs to the output of the script, such as a fully three-dimensional model of the celestial objects in the binary system, the gravitational waves created by them, and how they effect spacetime. (see image 1 in image gallery).
Built With
- lalsuite
- matplot
- pycbc
- python


Log in or sign up for Devpost to join the conversation.