Graphsplaining
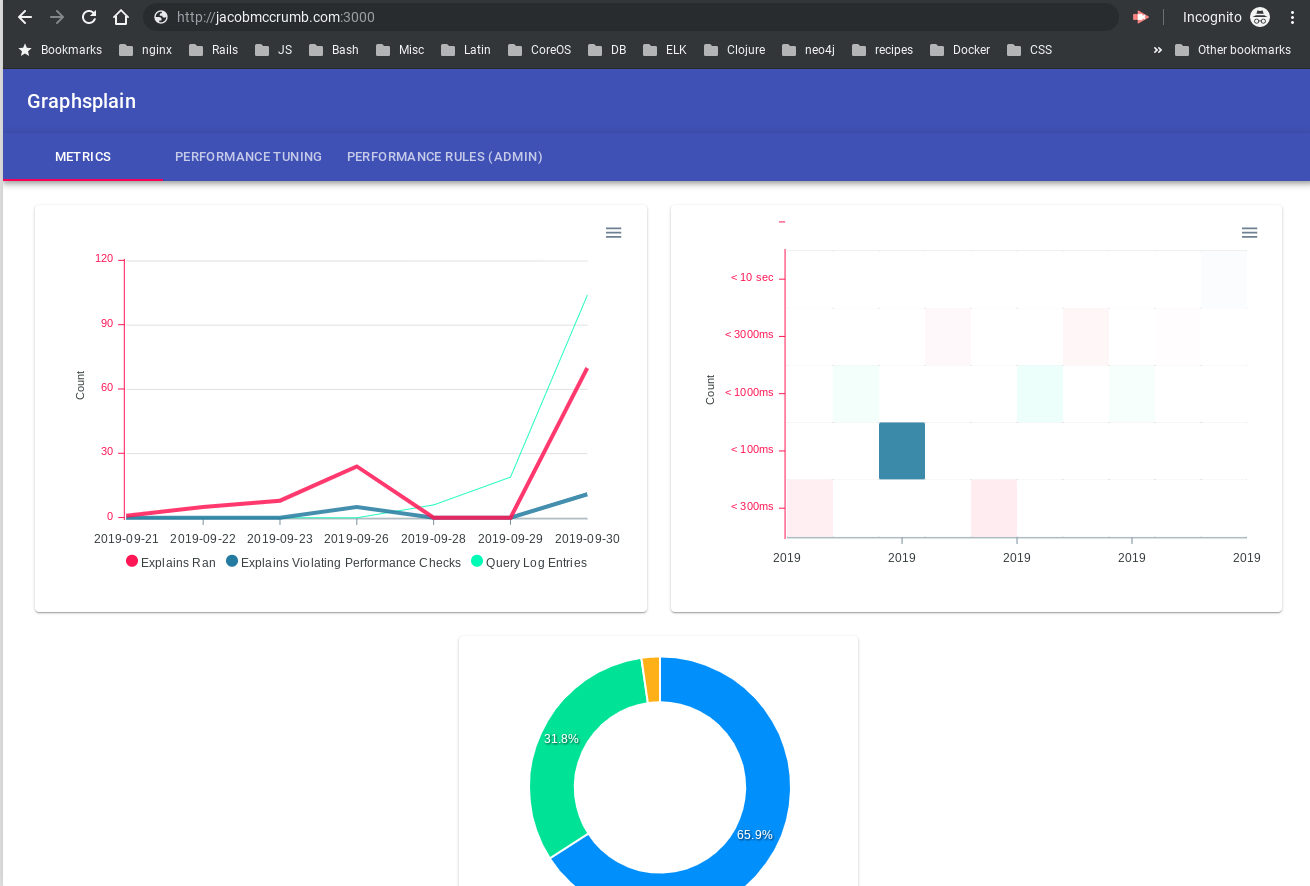
Creating a graph is fun. Optimizing a graph is hard. Graphsplain is here to help you improve your graph performance based on how you interact with the graph. The idea was born out of a project we have faced as part of our job. As graphs get larger and the questions become more complex it can often be tricky to identify what could or should be done to improve performance. Graphsplain is here to help! With a beautiful material inspired theme, Graphsplain provides up to date metrics on your graph. Provides recommended potential indexes and identify potential bottlenecks. Additionally, you can create performance checks for your graph data. Sure this may still be a work in progress (but isn't everything :wink: ), but Graphsplain is your helping buddy to 'splain how you can be a better graphista.
P.S. queries run against the graph linked below will show up on the react app! Guest login to the graph is username: guest password: explain (read access only I am afraid, currently has neo4j's movie and northwind data loaded).


Log in or sign up for Devpost to join the conversation.