-
-

Uploading properties
-

Creating the graph structure
-

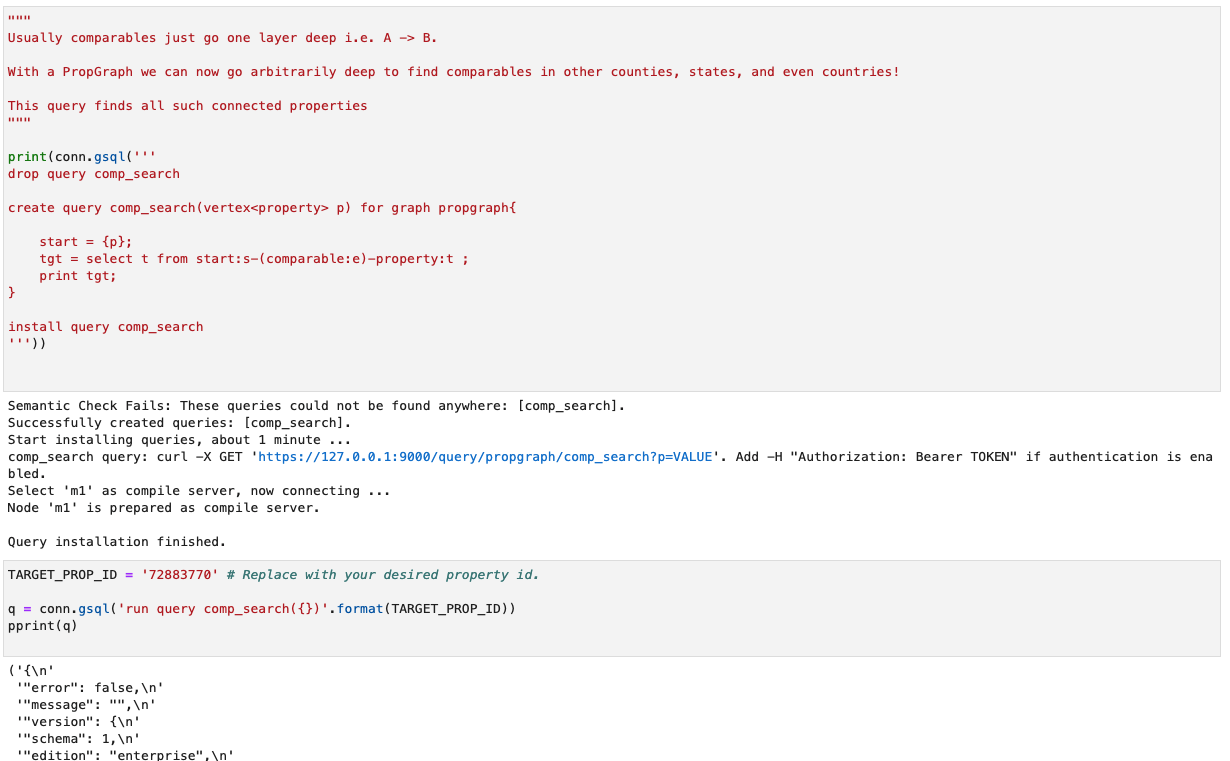
Writing the comparable query
-

Isolating properties in view with matching criteria
-

Browsing uploaded listings
-

Selecting property as comparable to another
-

TGCloud instance
-

Example csv download used for data hydration on map.


Contributors and Contact Information:
Chris Buonocore linkedin.com/in/chrisbuonocore chrisdistrict@gmail.com
Problem Statement addressed:
PropGraph: Find undervalued and comparable properties using graph-based relationships powered on TigerGraph.
Going after the TigerGraph Graph For All Million Dollar Challenge.
Presentation
Demo: https://youtu.be/iJ6QIgsZwts
Slides: https://docs.google.com/presentation/d/1UGDiIgigPEodtkFg_F-mBde0eaogOYEyHCJ-S14rk3M/edit?usp=sharing
Description:
With real estate at a recent all time demand high, the need for determining valuations effectively is important as ever. Often comparables for real estate valuation are derived at the discretion of the real estate agent, or simply based off the zestimate or redfin estimate for a property.
These methods can also be extremely opaque - with little to no visibility into the exact parameters that influence the price.
When an agent picks comparables, often this goes one layer deep - ex: the property is compared to three adjacent properties.
PropGraph provides a graph based solution that allows querying a given property and finding deeper relationships against recently sold properties. With PropGraph, you can take many 1-layer graphs (ex: one agent doing a comparable on a property) and go N layers deep instead by mapping across all comparables shared by multiple agents. With this strategy you can compare a property in Boston to a property that recently sold in the UK for example via transitive graph.
Key graph elements:
- Descriptive words (renovated, new kitchen, new bathroom, flooring, etc.)
Standard quantitative fields:
- Bedrooms
- Bathrooms
Square footage
Relationships between different property keywords.
Find corresponding properties based on graph relationships matching multiple criteria simultaneously.
Helps reduce bias in real estate pricing.
Ingests and graphs data through several mainstream real estate websites, including Redfin, Zillow, and Trulia.
Creates a valuation and visualization model in real time and serves it to the front end application.
Data
Example dataset in ./data/sample.csv.
More could be exported in basic searches from Redfin (redfin.com).
Technology Stack:
- ReactJS (frontend)
- Python (backend)
Uses pyTigerGraph for interacting with the tigergraph cloud DB cluster.
Dependencies
State any dependencies and their versions that needed to be installed to test this project. This may include programming languages, frameworks, libraries, etc.
Installation
Clone this repo and follow the steps below for the backend and frontend configuration locally.
Structure
./propgraph: Client-side code.
./server: Jupyter notebook to configure the graph DB and backend server code.
./data: Example property data.
./img: Example screenshots of the application.
Backend
- Set up a tigergraph cloud instance at tgcloud.io, and set the credentials to access that instance via the following environment variables.
    TIGER_HOST={YOUR_TIGERGRAPH_HOST}
    TIGER_USER={YOUR_TIGERGRAPH_USER}
    TIGER_PW={YOUR_TIGERGRAPH_PASSWORD}
    TIGER_TOKEN={YOU_TIGERGRAPH_TOKEN} # optional, fetched at runtime if unset.
- To bootstrap base/empty graph for PropGraph, run a jupyter notebook from the
./serverdirectory and opengraphsetup.ipynb. Install dependencies in first cell and run all cells below. chmod 755 run.sh- Run
./run.sh
The server should now be running on port 8000.
Bootstrap the Database
You'll want jupyter to run the DB-setup commands.
From the ./server folder:
jupyter-notebook (or lab).
Run the commands to the end; if successful, the graph should be a created and a few sample queries should execute.
Frontend
From the ./propgraph folder:
yarn
yarn start
The PropGraph frontend should now be running on port 3000.
You'll want to load up the DB with some properties from the 'Upload' page of the app to begin using PropGraph with your Tigergraph database.
Known Issues and Future Improvements
- Include in-app visualization for comparable graph (currently capture-able in the notebook for further/future analysis)
Reflections
Tigergraph has a unique value prop to do 'Nth' comparable level queries against properties to yield deeper insight than what could easily be done with a traditional database.
References
- Tigergraph solutions: https://tgcloud.io/app/solutions
- More credits: https://docs.google.com/forms/d/e/1FAIpQLSdoK6wIj4iFJtzeFWFl4yPQK6h8TzmQMsYnG6upZiM1A8W5VQ/viewform
- Notebook: https://github.com/pyTigerGraph/pyTigerGraph/blob/master/examples/GSQL101%20-%20PyTigerGraph.ipynb
See full description on github: https://github.com/cbonoz/graph22


Log in or sign up for Devpost to join the conversation.