-
-

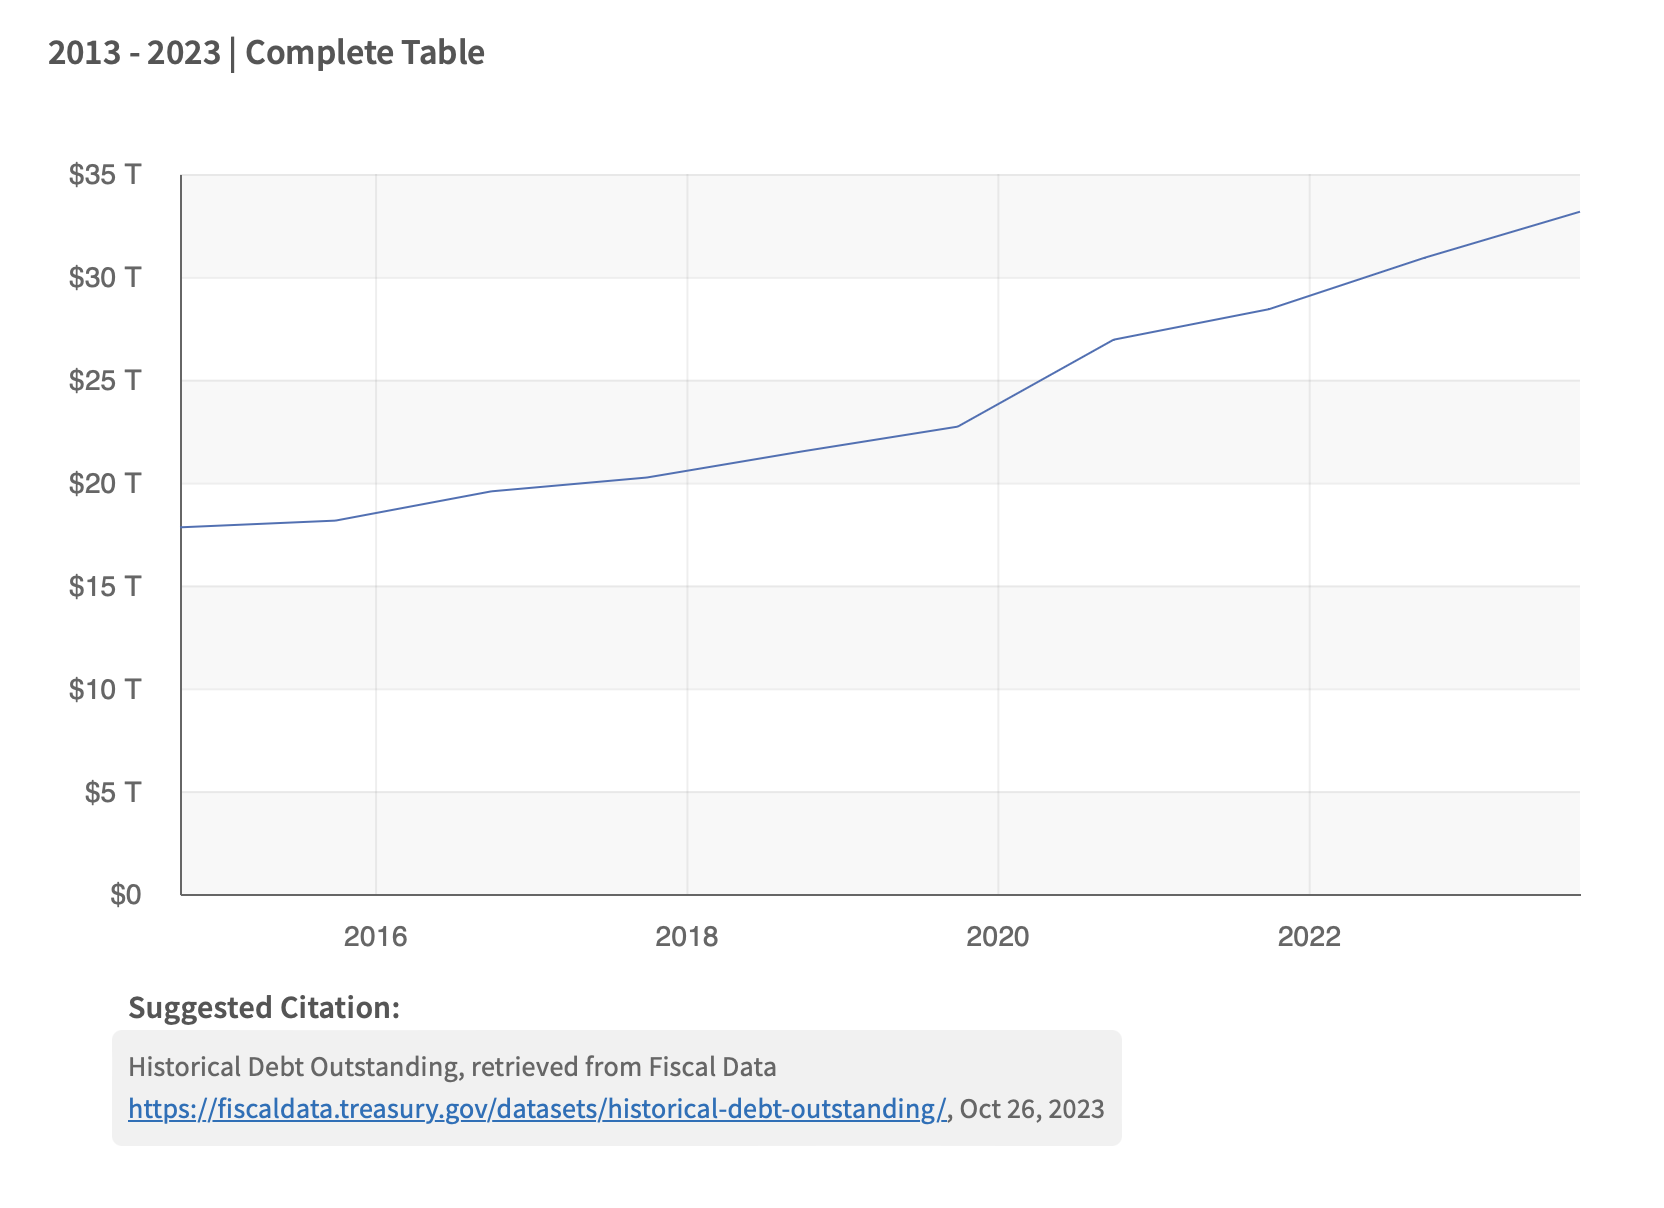
Historical chart of US Debt
Introduction
Economists are not known for being at the frontier of technology, and so one shouldn't be too surprised that GraphQL is practically unheard of in the economics field. This project showcases how GraphQL can be used within the context of economics. Here, GraphQL is used to offer users the ability to retrieve data of the United States historical debt at the end of each fiscal year between the years 2013-2023; data has been helpfully supplied by Fiscal.Treasury.gov (an official website of the US government) and can be found https://fiscaldata.treasury.gov/datasets/historical-debt-outstanding/historical-debt-outstanding. This project can be used as a helpful starting point in how GraphQL can be used together with economic topics. The program is built using the programming language JavaScript (node.JS) and uses the Apollo Server to process the GraphQL requests. As this is mostly for demonstrative purposes, the database is "simulated" and is not a fully-fledged solution with something like MySQL or MongoDB.
Why GraphQL?
GraphQL is sometimes said to be an improvement over traditional RESTful services for a number of reasons. One of them is that traditional RESTful services tend to lead to either "over-fetching" or "under-fetching" of datasets, which can be either a waste or underutilisation of available resources depending upon the circumstances. Furthermore, GraphQL enables users to combine data requests in interesting and intriguing ways, whereas to do the equivalent in the context of a RESTful service would typically involve sending multiple requests.
Are there any disadvantages to GraphQL?
One disadvantage of using GraphQL is that it is not as widely adopted or known as traditional RESTful services. This project therefore seeks to show and explain how GraphiQL can be used with economic data.
Built With
- graphql
- javascript
- node.js

Log in or sign up for Devpost to join the conversation.