Inspiration
Every graph you export today is a dead end. The moment you save it as an image, the underlying data is gone. For large organizations or fast-moving websites, that means any update requires tracking down the original file owner, editing the source, and re-exporting from scratch. We built Graphlet because that friction shouldn't exist.
What it does
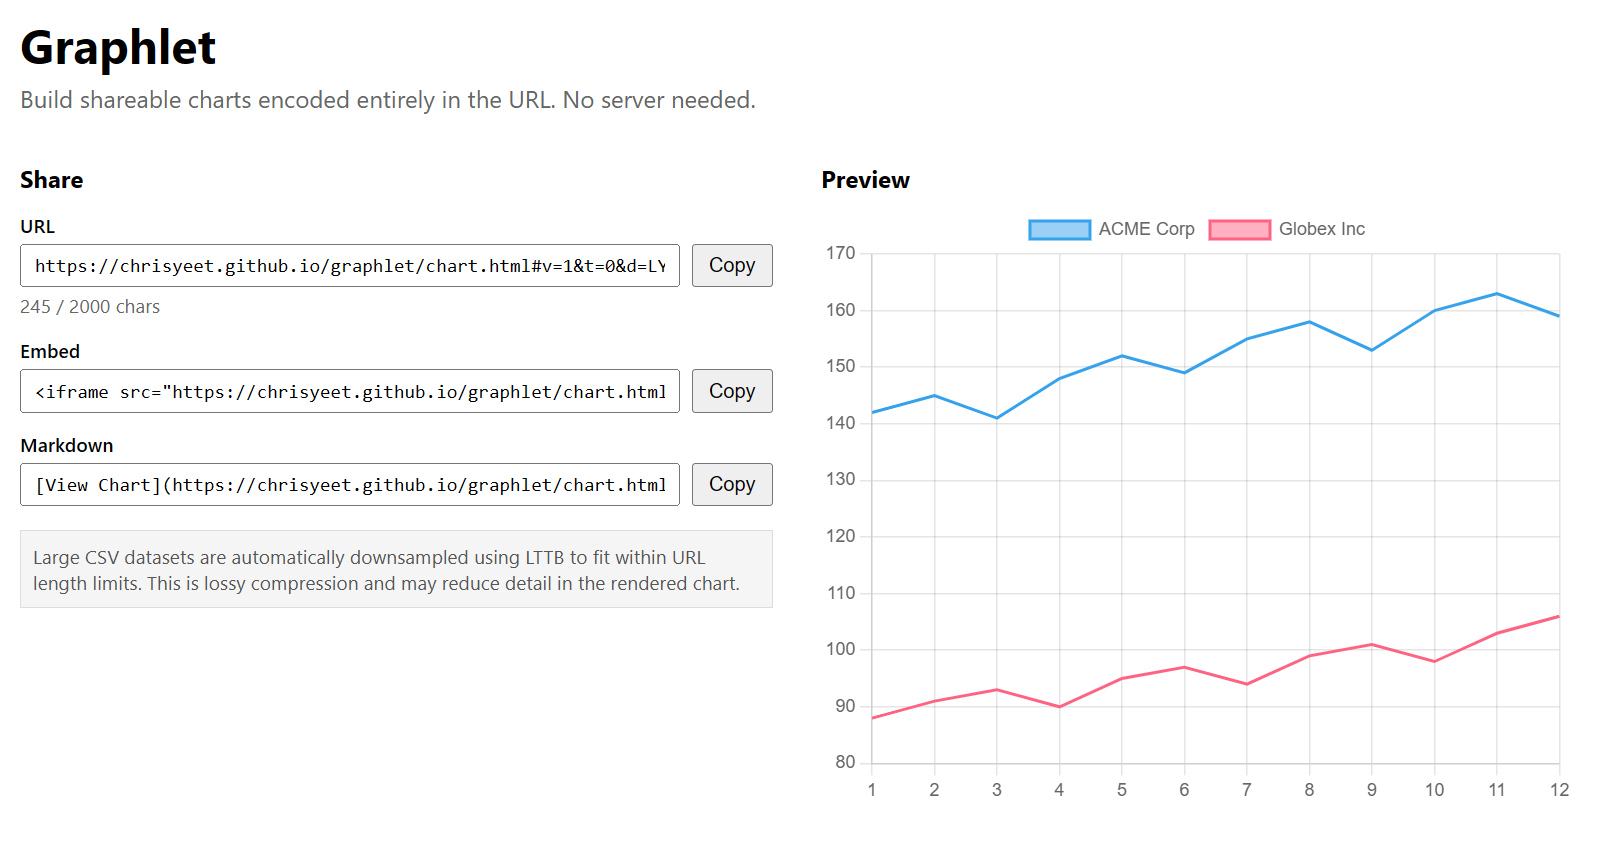
Graphlet keeps your graphs alive after export, with no server required. Using an innovative AI compression algorithm, Graphlet encodes your entire dataset directly into a URL. The graph lives in the link itself, making it infinitely portable: embed it in any page, share it in any tool, and it works anywhere a URL works. When something needs to change, anyone with access just follows the URL, makes their edits, and swaps in the new link.
How we built it
Built with raw JavaScript, HTML, CSS, blood, sweat, and tears.
Challenges we ran into
URLs have a practical length limit, which put a hard ceiling on how much data we could encode. Hitting that limit forced us to invest heavily in our compression algorithm.
Accomplishments that we're proud of
In the short time frame allotted to us, we've already made something that's publicly released; the serverless design makes Graphlet usable on GitHub pages.
What we learned
There's a lot of complexity that goes into the ideation stage of a project. Also, as our first hackathon, we didn't expect what we were getting into. This project demonstrated that we're capable of doing good work in short time.
What's next for Graphlet
We want to expand the range of chart types supported, improve the editor experience, and explore ways to push the compression further so larger datasets become viable. In addition, image embedding for services like Discord would make this more easily accessible to the social parts of the internet. Longer term, we see Graphlet becoming the standard way to share live, editable graphs across the web.


Log in or sign up for Devpost to join the conversation.