-
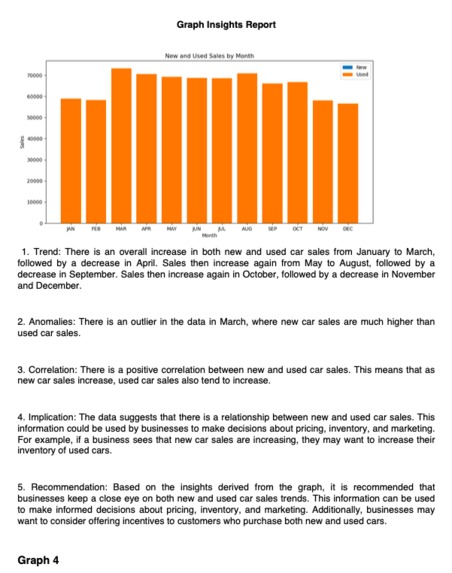
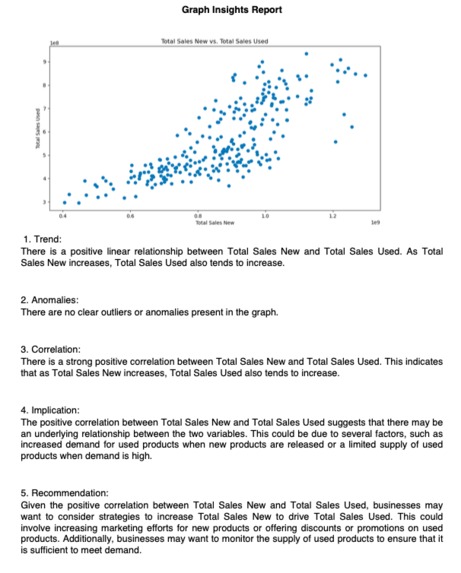
-

[Page 1] Insights report generated by Gemini Pro Vision
-
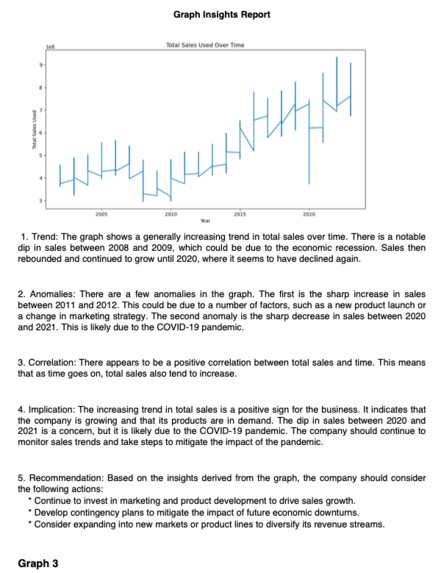
[Page 2] Insights report generated by Gemini Pro Vision
-
[Page 3] Insights report generated by Gemini Pro Vision
-
[Page 4] Insights report generated by Gemini Pro Vision
-

[Page 5] Insights report generated by Gemini Pro Vision
-
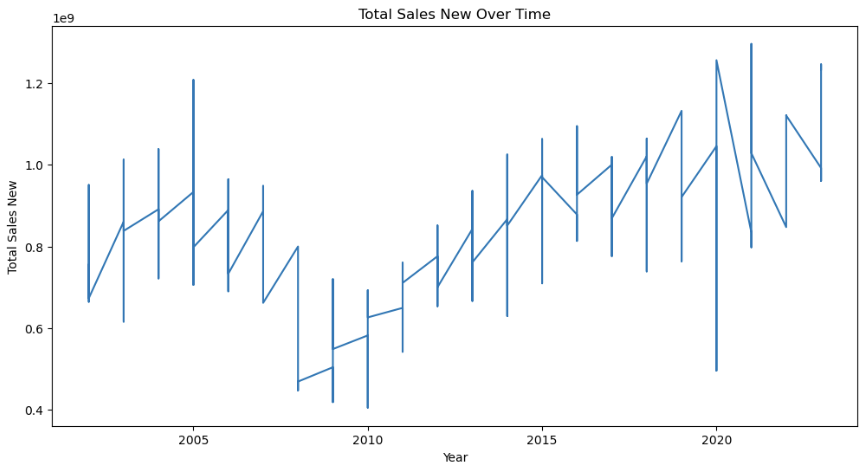
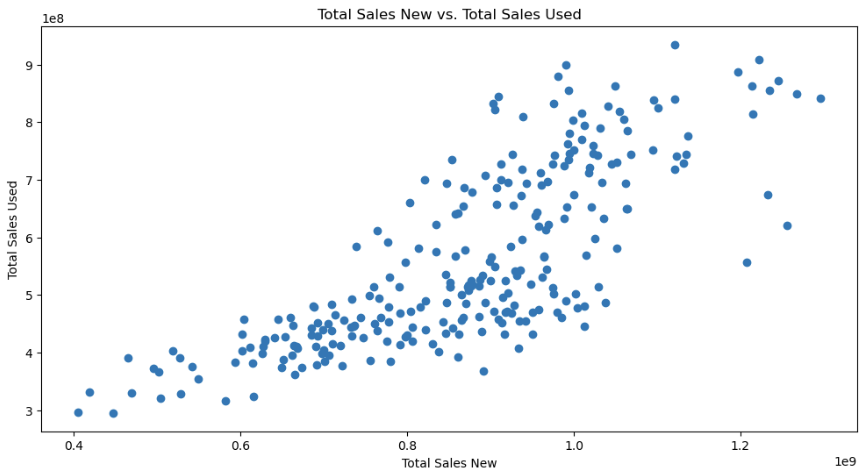
Graph 1 generated by Gemini Pro
-

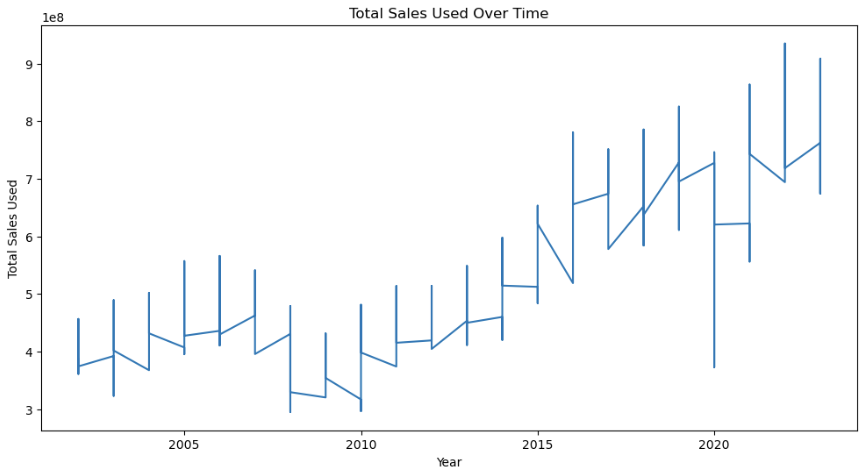
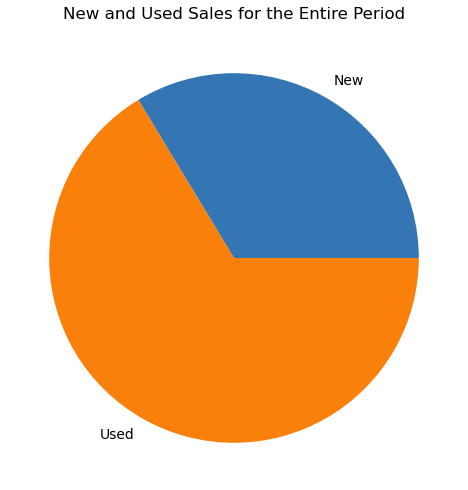
Graph 2 generated by Gemini Pro
-
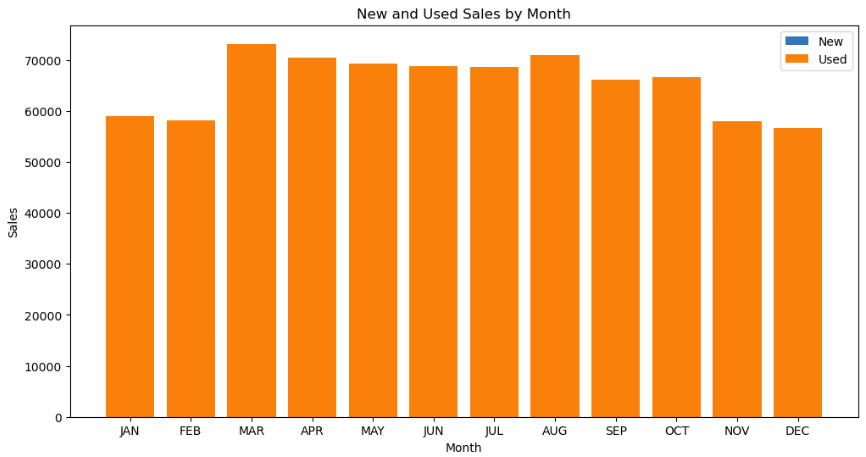
Graph 3 generated by Gemini Pro
-
Graph 4 generated by Gemini Pro
-

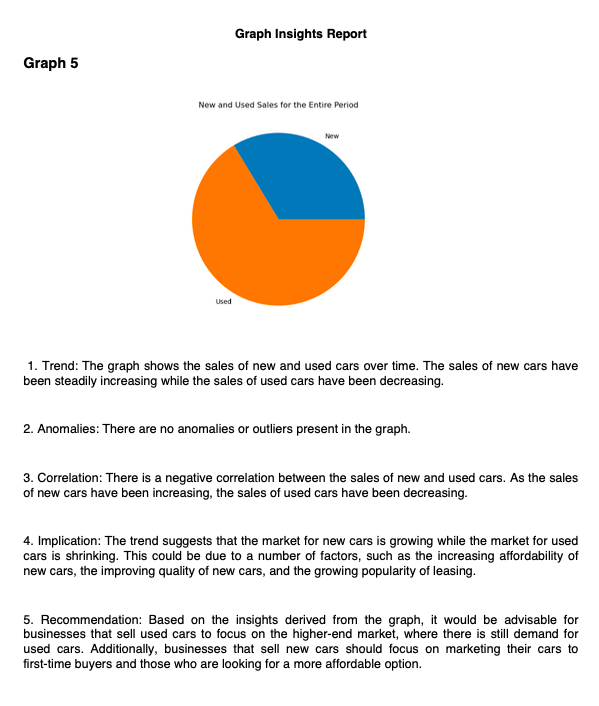
Graph 5 generated by Gemini Pro


Inspiration
The idea for GraphInsightify came from the tedious, often overwhelming task of creating and analysing graphs using traditional tools like Excel or Tableau, as well as graph libraries that demand additional time and manpower. Traditionally, data analysts spend considerable time selecting the right types of graphs for their data, followed by even longer periods scrutinising these graphs to glean actionable insights. This manual and time-consuming process seemed ripe for innovation. Envisioning a solution that could revolutionise this process, GraphInsightify was born.
By automating graph generation and insight extraction, GraphInsightify aims to revolutionize the way data exploration and analysis is conducted. This innovative tool drastically reduces the time and effort required for these tasks, empowering users to shift their focus from the mechanics of data visualization to strategic decision-making. With GraphInsightify, analysts can efficiently derive actionable insights from their data, enabling faster and more informed decision-making processes. Ultimately, GraphInsightify adds tangible business value by streamlining data analysis workflows, enhancing productivity, and driving better business outcomes.
What it does
GraphInsightify
- Transforms complex datasets into visually appealing and insightful graphs with Gemini Pro.
- Automates the extraction of actionable insights from these graphs with Gemini Pro Vision.
- Compiles these findings into professional-quality PDF reports.
- Integrates with Google Drive to manage data flow seamlessly between Google Sheets and the notebook, ensuring a smooth data pipeline from retrieval to report generation. The generated reports are conveniently stored in Drive for effortless access and sharing.
How I built it
Firstly, I establish a connection to Google Drive via API to access the relevant Google Sheet containing the dataset, and subsequently configure Gemini for utilization. Then, I utilise Gemini Pro in Google's ChatGoogleGenerativeAI to create a prompt template guiding the LLM to generate Python code for visualising data. This template includes instructions on data extraction, graph creation, and storage in variables. Subsequently, I invoke the AI with the input data, to generate Python code tailored to the provided template and dataset.
Additionally, I employ PythonFunctionParser, which features a method called 'parse', designed to extract Python functions from a given input string using a regular expression. This method retrieves the Python function found within triple backticks, removing any leading and trailing whitespace. The extracted Python function is then executed using the exec() function, enabling dynamic execution of the parsed code.
Following the generation of graph images, I leverage Gemini Pro Vision to produce insights based on a predefined template enriched with dataset information, ensuring relevance. I then develop a PDF class inheriting FPDF to facilitate the addition and formatting of generated images and insights into a PDF report. Finally, I upload the generated insight report PDF to Google Drive for convenient storage and sharing.
Challenges faced
One challenge encountered was the Gemini Pro model occasionally hallucinating data column names, despite providing the schema beforehand. This issue was addressed by explicitly specifying the column names for visualization. Additionally, as Gemini Pro Vision is trained on diverse data sources, it occasionally produced insights with foreign characters, necessitating post-processing to ensure English output consistency.
Accomplishments
I am particularly proud of how GraphInsightify enhances productivity by reducing the time required to generate and analyse graphs. The ability to turn raw data into a polished, comprehensive PDF report with minimal user intervention is a game-changer in data analysis. This not only improves the efficiency of the data analysis process but also democratises advanced data analysis capabilities, making them accessible to a broader range of users.
What I learned
Through this project, I deepened my understanding of AI's potential to automate complex tasks. I learned more about integrating Google Drive API to manage data flow between different platforms, and gained insights into the nuances of prompt engineering and output parsing to generate specific outputs tailored to my needs.
What's next for GraphInsightify
Looking forward, I aim to expand the compatibility beyond Google Sheets to encompass a range of input data types, including Excel, CSV files, Word documents, and PDFs. This expansion also entails adapting data extraction methods to suit each input type, ensuring seamless integration and efficient processing. Moreover, I recognise the importance of data cleaning as a crucial precursor to generating meaningful insights. By integrating robust data cleaning functionalities, my aim is to simplify the preprocessing stage. This will empower users to effortlessly input their datasets and swiftly obtain actionable insights. In tandem with these technical enhancements, I am also committed to refining the insight extraction capabilities. My goal is to provide more nuanced and sector-specific analysis, empowering users to derive deeper insights tailored to their specific domains and requirements.
Built With
- fpdf2
- gemini-pro
- gemini-pro-vision
- google-drive
- langchain
- pillow
- pydantic
- python


Log in or sign up for Devpost to join the conversation.