Inspiration
Mathematics is often taught through visual representations, particularly graphs and diagrams. However, for students with visual impairments, interpreting these representations can present significant accessibility barriers.
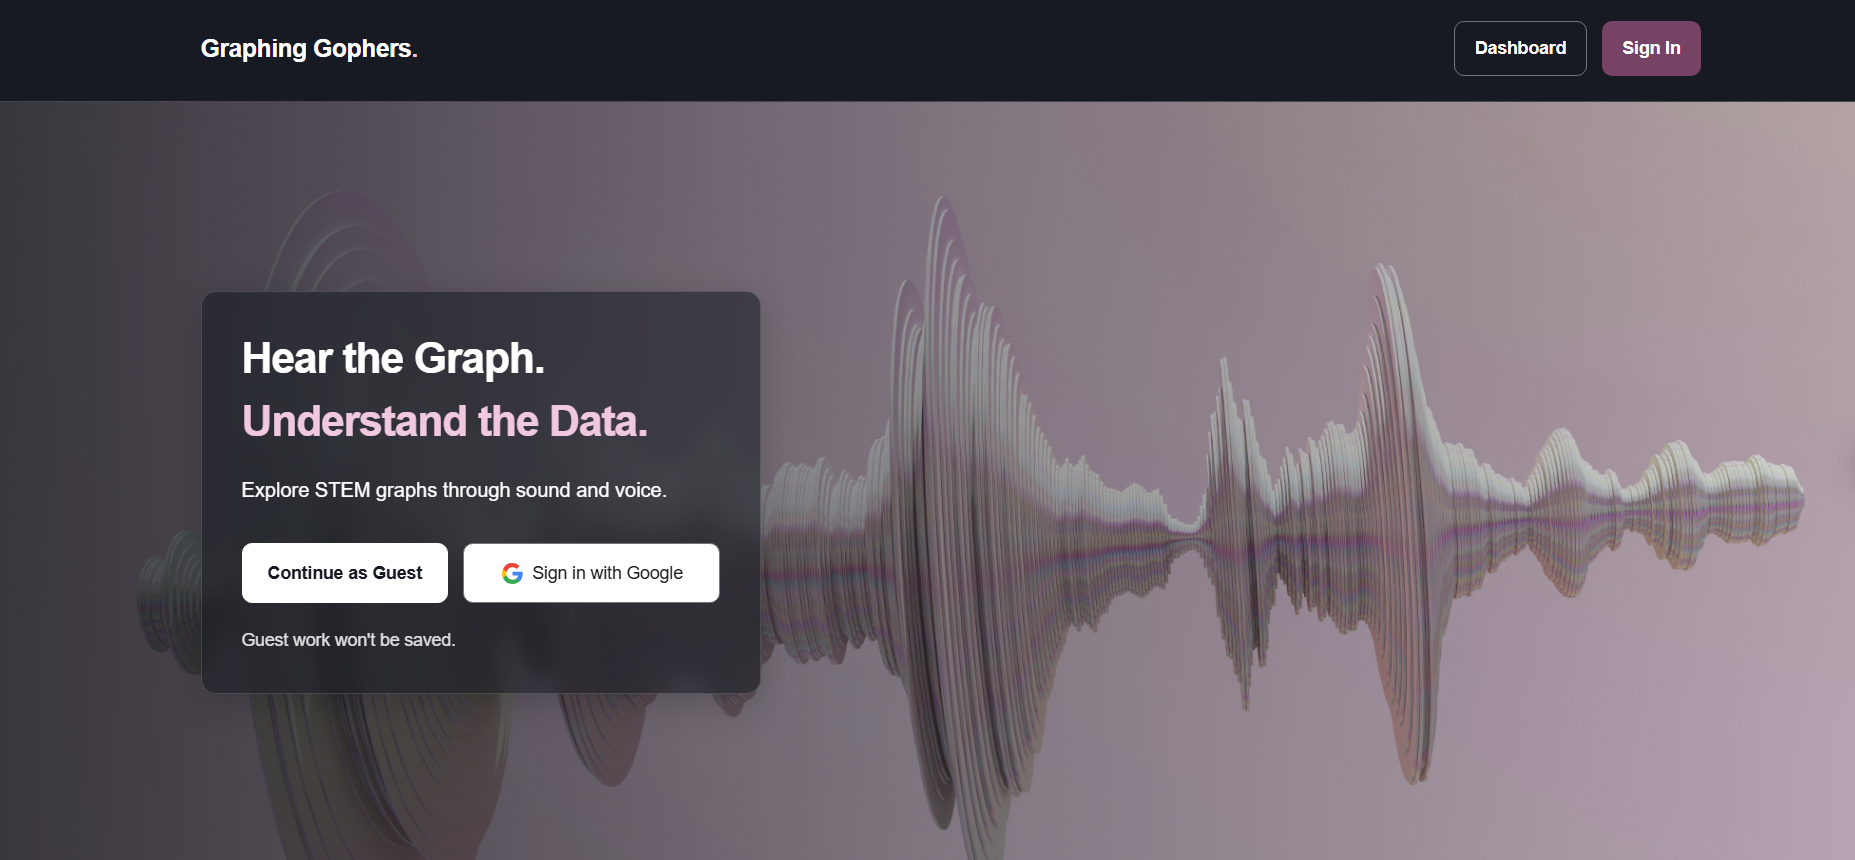
We wanted to explore how technology could make STEM education more inclusive by providing alternative ways to understand visual information. This inspired Graphing Gophers, an application designed to help students experience mathematical graphs through sound.
What it does
Graphing Gophers transforms visual graphs into an interactive, auditory learning experience.
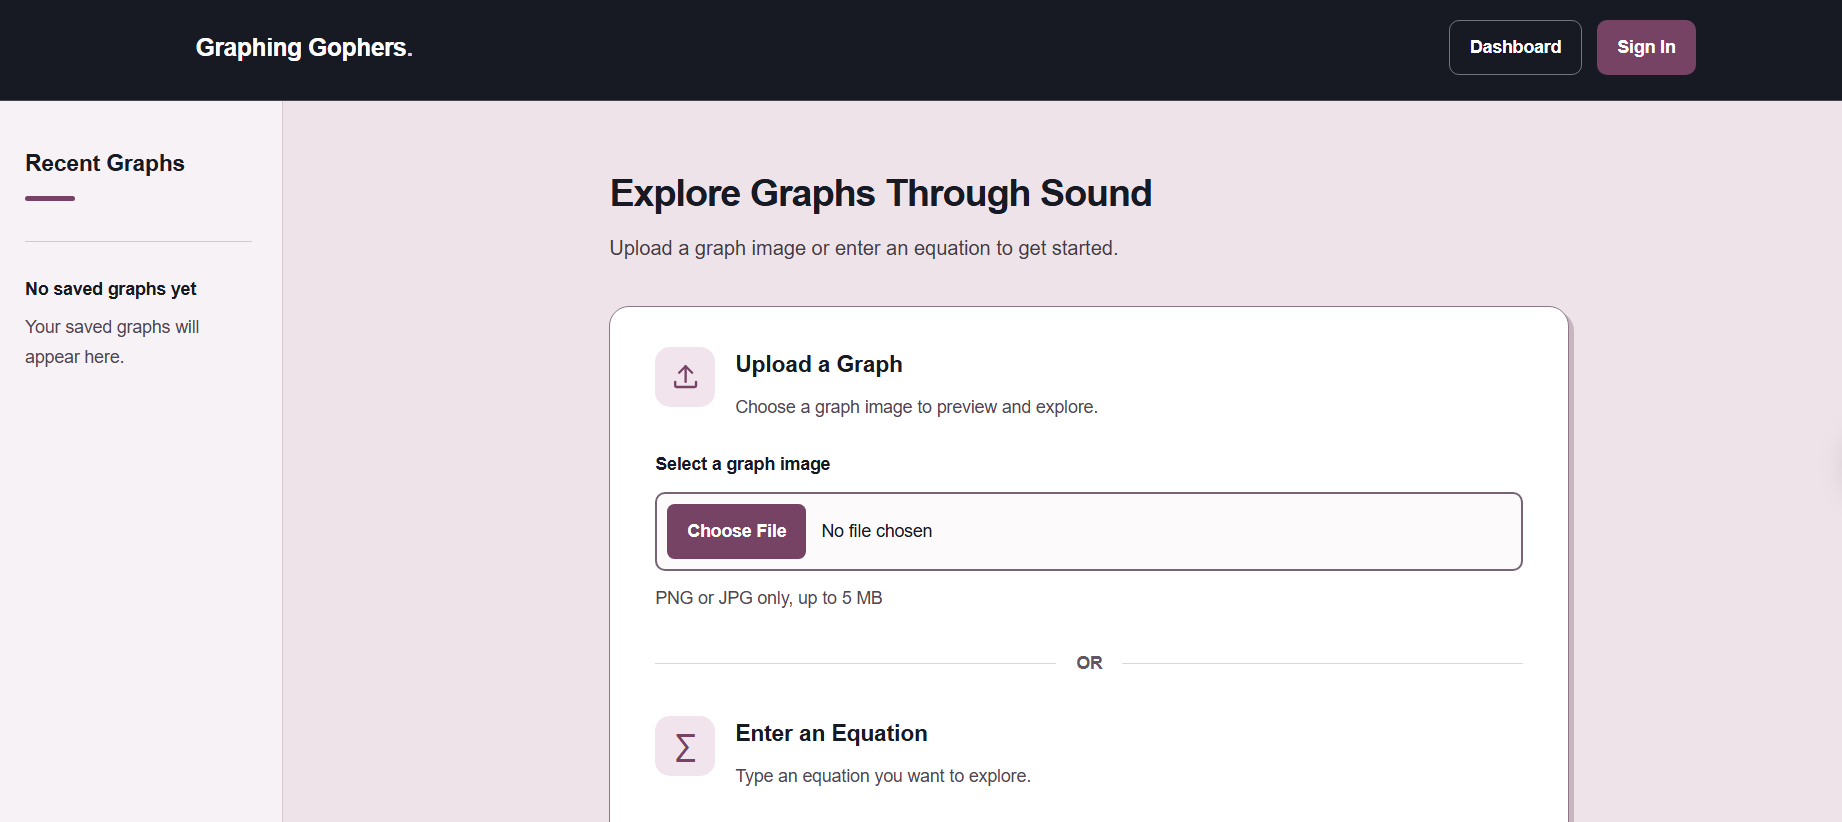
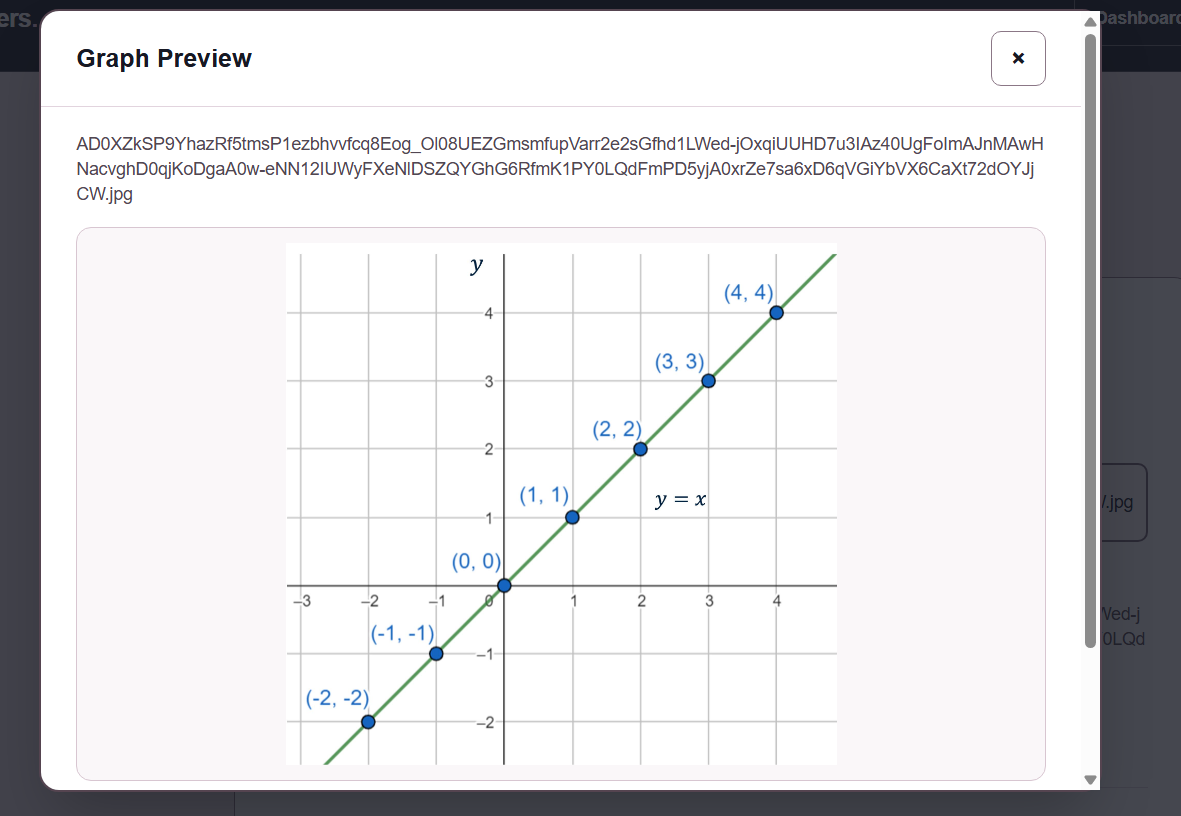
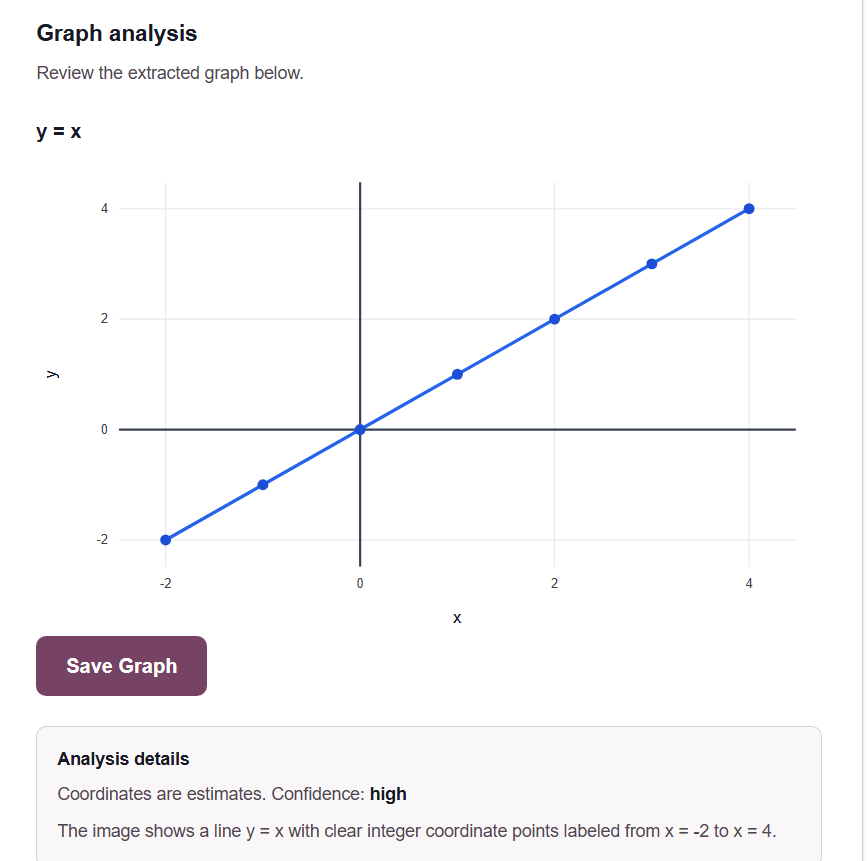
Users can upload an image of a mathematical graph, which our application analyzes using artificial intelligence to identify its underlying coordinates, axes, and mathematical relationships.
The extracted data can then be visualized and converted into sound through graph sonification, allowing users to explore changes in a graph without relying exclusively on sight.
Users can also sign in to save their analyzed graphs for future reference, making Graphing Gophers a useful tool for continued STEM learning.
How we built it
We developed Graphing Gophers using a full-stack JavaScript architecture, with Next.js and React powering the application and Tailwind CSS providing a responsive, accessible interface.
For graph analysis, we integrated Google Gemini to interpret uploaded images and extract structured mathematical data. This data is then used to reconstruct graphs and power the sonification experience.
We implemented Auth0 for Google authentication and Supabase PostgreSQL for persistent graph storage, allowing authenticated users to save and retrieve their work.
Finally, we deployed the application using Vercel, with a Git-based workflow that allowed our team to collaborate, test features, and continuously integrate our changes.
Challenges we ran into
One of our biggest challenges was translating visual graph information into meaningful structured data. Images can vary significantly in quality, labeling, scale, and complexity, making accurate coordinate extraction difficult.
Integrating the different parts of our application also presented challenges. Our team worked on multiple features simultaneously, requiring us to coordinate how graph extraction, visualization, sonification, and data persistence interacted.
We also encountered deployment and authentication challenges, particularly configuring Auth0 correctly across local development and Vercel preview environments.
Working within a limited hackathon timeframe pushed us to prioritize essential functionality, troubleshoot issues efficiently, and make practical engineering decisions.
Accomplishments that we're proud of
We're particularly proud of developing a project that addresses a meaningful accessibility challenge in STEM education.
Rather than building another conventional graphing application, we explored how combining artificial intelligence with auditory feedback could make mathematical concepts more approachable for students with visual impairments.
We're also proud of bringing together several technologies into a cohesive full-stack application, including AI-powered graph extraction, graph visualization, authentication, and persistent storage.
Most importantly, we worked collaboratively to transform an idea into a functional prototype within the constraints of a hackathon.
What we learned
This project helped us better understand the importance of considering accessibility from the beginning of the software development process.
We learned how to work with multimodal AI to extract structured information from images, and how that information can be transformed into alternative representations such as sound.
On the technical side, we gained experience integrating multiple services, managing authentication, designing backend APIs, and deploying a modern full-stack application.
We also learned valuable lessons about teamwork, code reviews, prioritization, and adapting quickly when unexpected technical challenges arise.
What's next for Graphing Gophers
We envision Graphing Gophers becoming a more comprehensive accessibility tool for STEM education.
Some of our future goals include:
- Expanded graph support: Improve interpretation of complex graphs, multiple functions, and different mathematical representations.
- Enhanced sonification: Give users greater control over how mathematical data is translated into sound.
- Accessibility testing: Gather feedback from students with visual impairments to refine the experience around their actual needs.
Ultimately, our goal is to help create a learning environment where understanding mathematics isn't limited by how information is visually presented.
Built With
- accessibility
- artificial-intelligence
- assistive-technology
- audio
- auth0
- computer-vision
- data-visualization
- education
- gemini
- nextjs
- react
- sonification
- typescript
