

Inspiration
I'm working at i-Vis Research lab for more than one and a half years. I'm working on developing a generic graph visualization tool. When I checked the "Graph Studio" inside https://tgcloud.io/app/solutions, I see that it looks fancy. The gradient colors and highlighting effects look really nice. But I also see that it can be developed. I didn't find it good to make explorations and semi-automated graph analysis. For example, compound nodes and edges might make a big difference. Instead of loading a query, I would like to directly write a query and run it then see the results immediately.
I think I'm already doing graph visualization, so I can use my experience to make an alternative or supportive tool to "Graph Studio". Also, I think I can support other graph databases such as Neo4j easily and make a database-agnostic open-source visualization tool. In addition, I was also thinking about a graph editor for visualizing algorithms with rich styles. So I'm planning to add editing features to this project.
What it does
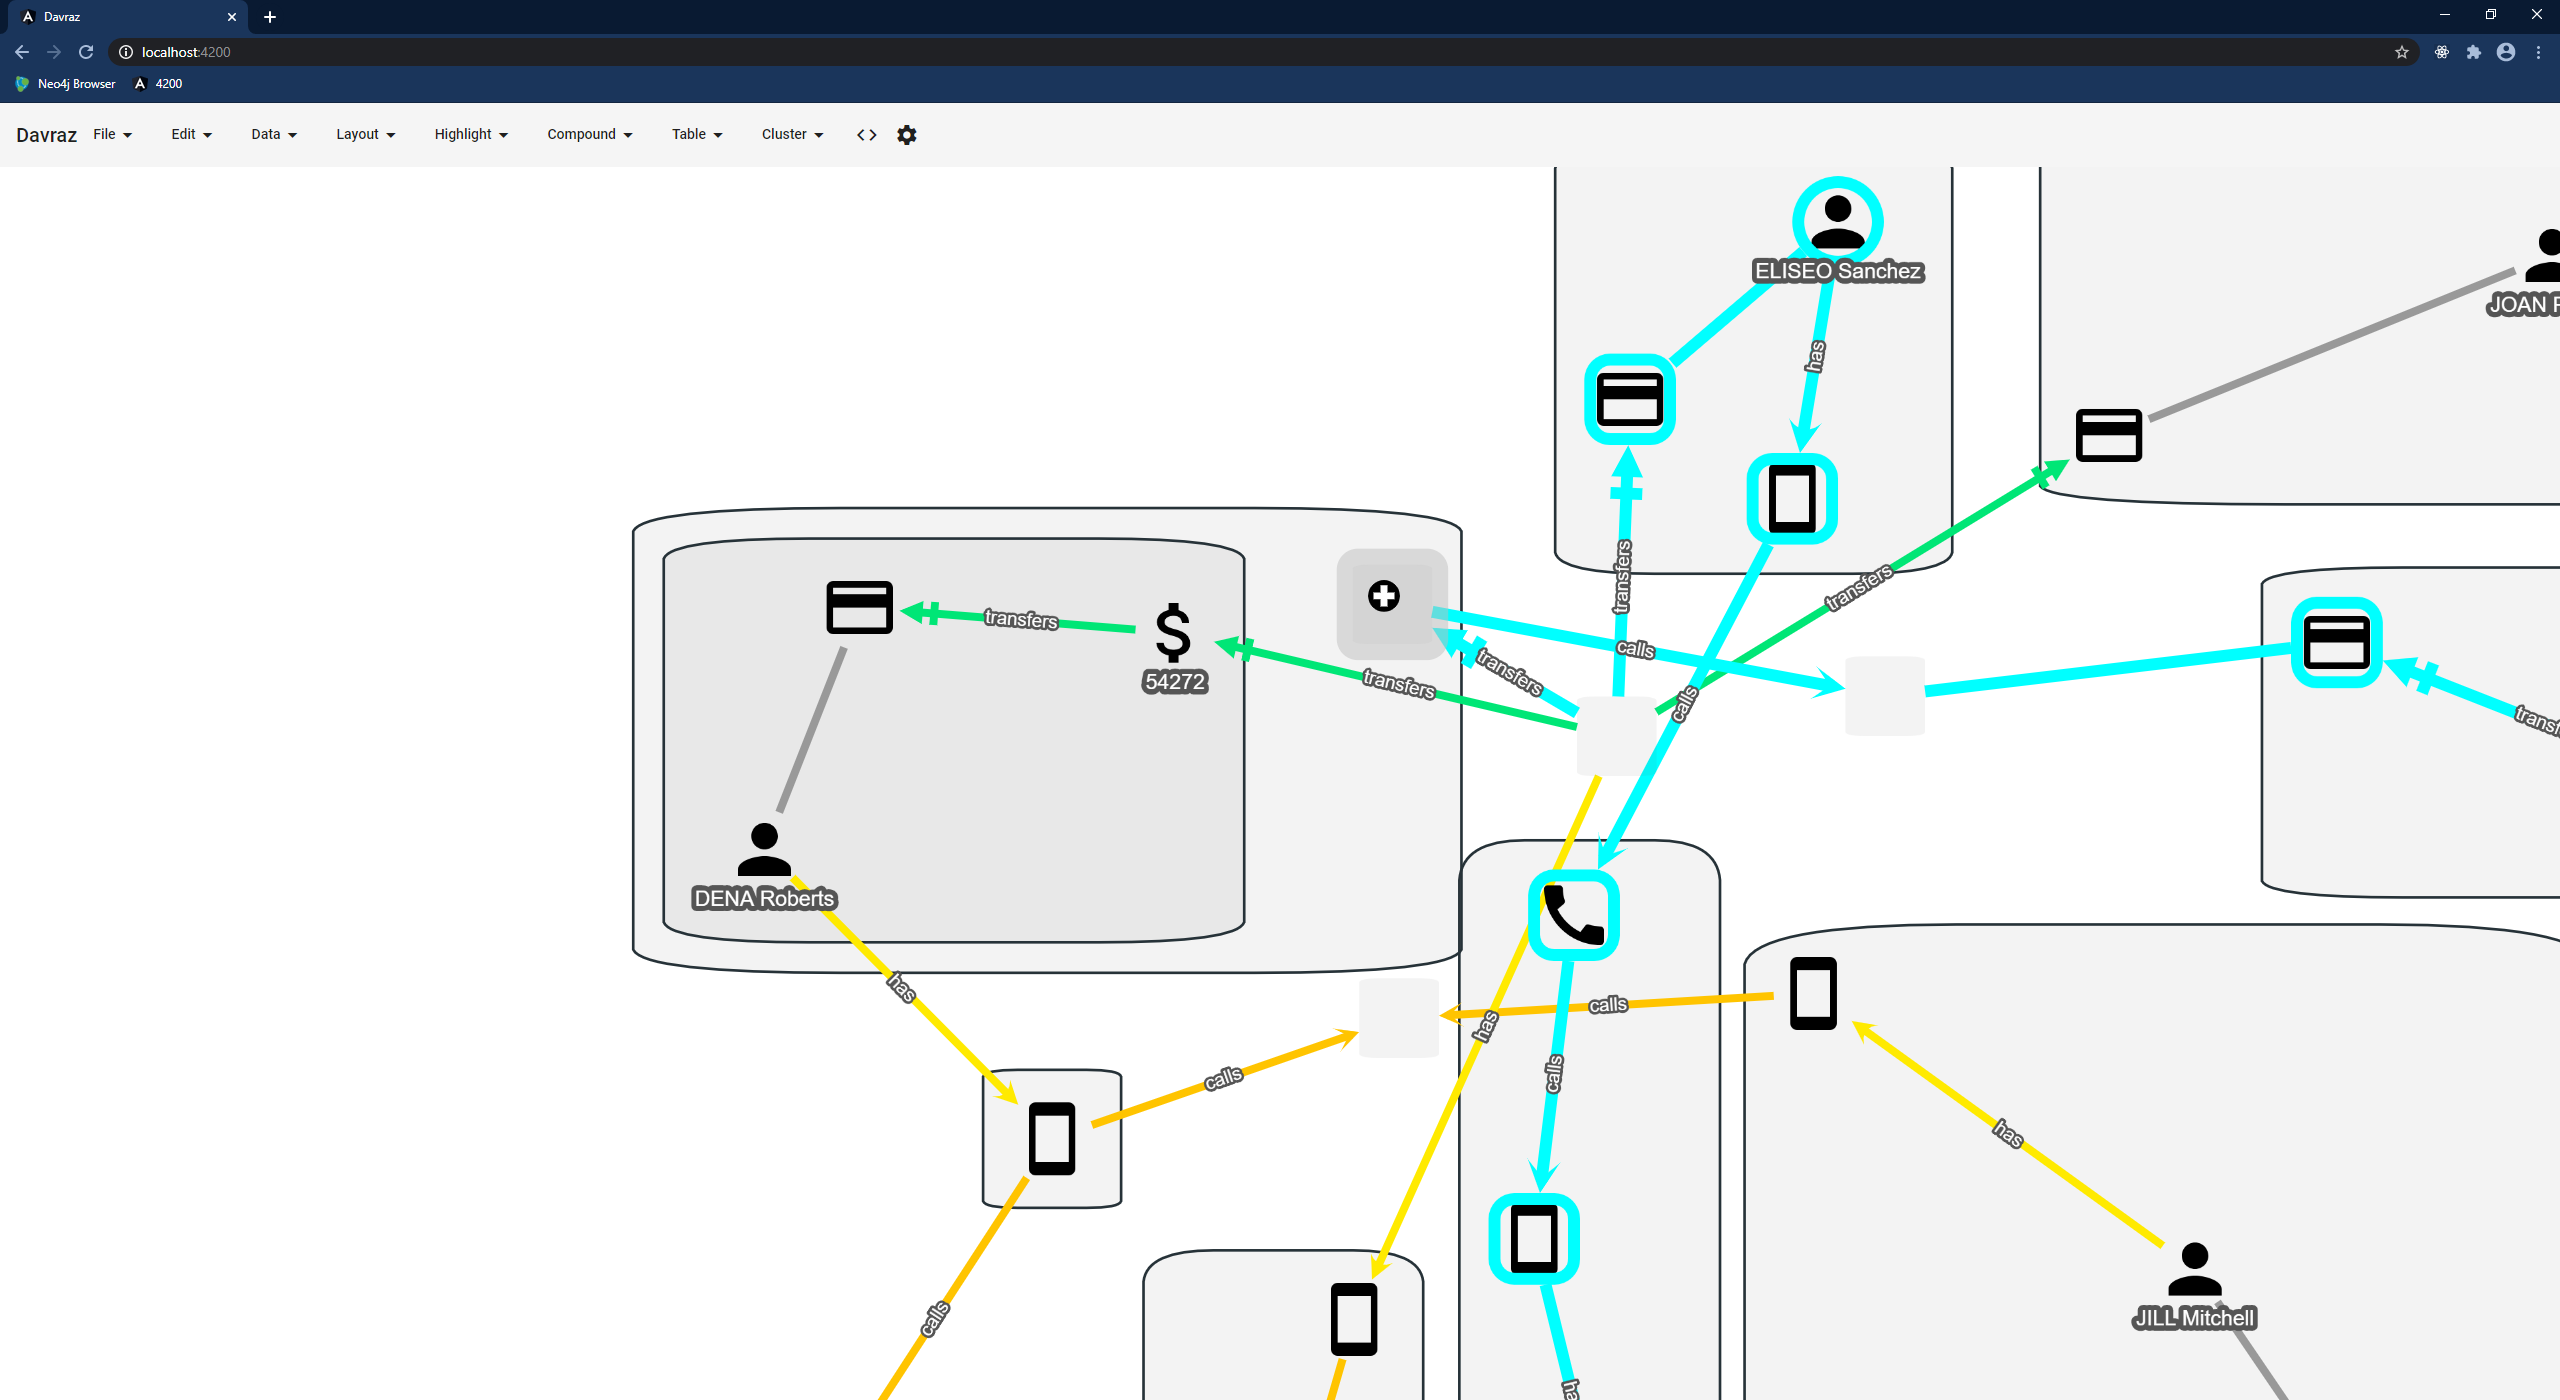
- Rich customization of graph visualization styles with using cytoscape.js styles.
- Run Interpreted and Installed GSQL queries and see the results as a graph or as a table or as JSON.
- Show results as a table and a graph at the same time.
- Use clustering, compound nodes, compound edges, and 12 different layout algorithms for complexity management.
- It tries to maximize the space for graph rendering. For this, I use "operating system like windows" which can be dragged and resized.
How I built it
I used angular 10, angular/material for the application. I used cytoscape.js for rendering graphs.I use nodejs for running a server which gets response from tiger graph cloud database.
Challenges I ran into
GSQL is hard to learn. It behaves edges as second class citizens. It shouldn't be like that because edges also store data. Just like nodes they can have properties. Also, I expect to directly run and see the results of a query language. Interpreted queries are like SQL queries but normal queries are like SQL stored procedures. You have to install them.
Bringing data with GSQL is really hard. But it looks great for writing very complex and indeed useful queries.
Accomplishments that I'm proud of
Complexity management with compound nodes/edges and clustering. Rich and customizable styles. Let the user see data as table and graph at the same time. Maximize the space for graph rendering by using resizable/draggable windows.
What I learned
I learned about GSQL and more things about user interface development. I learned the logic of the RDF database.
What's next for _ Davraz _
Many things can be done.
- giving the user the ability to edit graph and save changes to the database
- supporting other graph databases such as Neo4j
- using a data template more advanced and customized features can be added like querying the database with a User Interface component, such that a layman who does not know anything about querying a database can query the database. With this UI component, database queries can be generated from UI components.
- using and viewing graph-theoretical properties (degree, in-degree, etc..) and changing visualization with respect to the values of graph-theoretical properties closeness centrality etc...
- using more advanced clustering algorithms page rank etc..
- adding bird's eye view for big graphs so that the user won't get lost inside the graph
- showing statistics about the current graph
- hide/show elements by their types
- more support for time-based filtering and exploration of graph
Built With
- angular.js
- cytoscape.js
- material-theme
- node.js


Log in or sign up for Devpost to join the conversation.