-
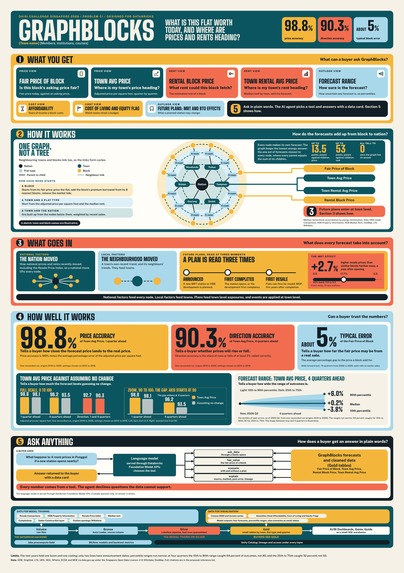
Poster
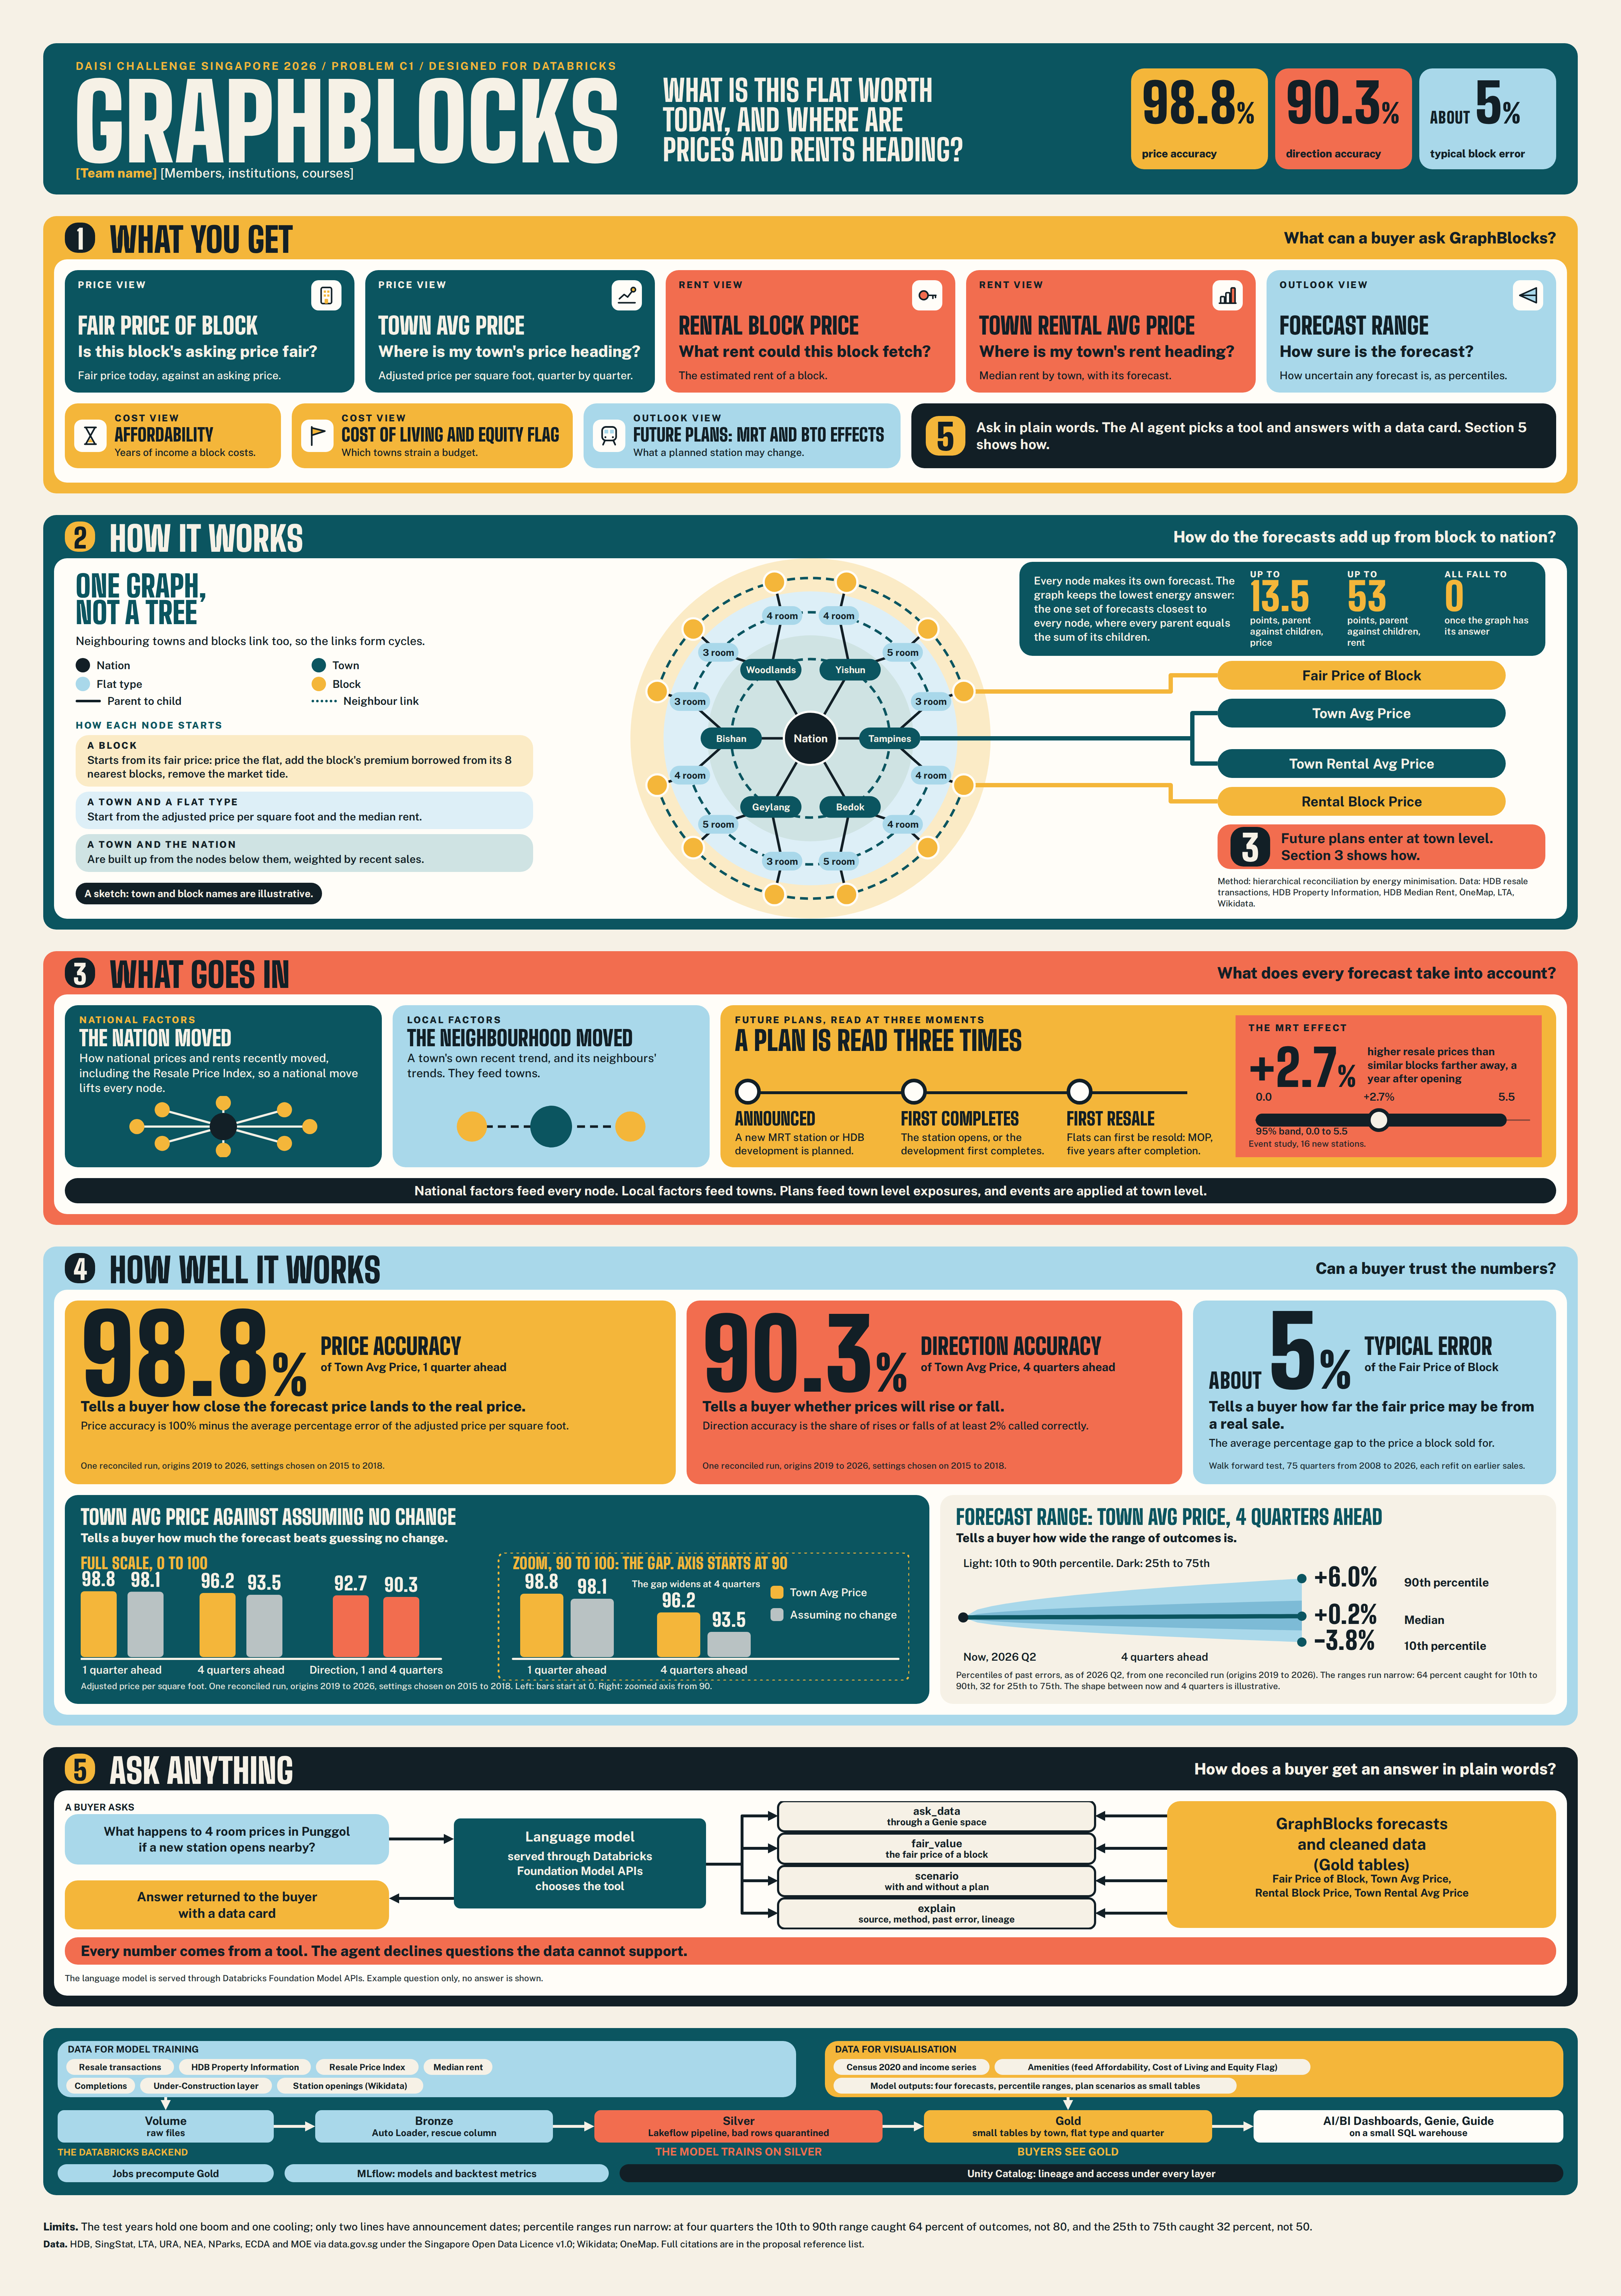
GraphBlocks: What a Flat Is Worth Today, and Where Prices and Rents Are Heading
DAISI Challenge Singapore 2026, Problem Statement C1. All figures are computed from the cited open data.
Buyers and owners have no single place to see what a block is worth or where prices and rents are heading. Our solution for this, GraphBlocks, offers forecasting of the fair price of a block, a town's average price, a block's rental price and a town's rental average price - all from one hierarchical model. It takes into account Singapore's future plans such as MRT stations and HDB flats from announcement to completion and even the 5 year Minimum Occupation Period (MOP). On top of offering an intuitive dashboard, we also enable buyers to engage with an AI agent that can answer queries, grounded with the forecast and data we provide.
1. The Problem: There is no one place to look
Mei and Daniel, an illustrative couple, are saving for a four room flat. They find only pieces. The resale dataset lists past sales, which HDB calls indicative only [1]. The Resale Price Index gives one national number a quarter [2], and SRX lists new BTO prices [3]. None shows what their block is worth or where prices are heading.
The stakes are high. The index rose 51.5 percent (nominal) from 2017-Q1 to 2026-Q2 [2], while real median household income grew 0.7 percent a year over 2019 to 2024 [4]. Even today's price is hard to judge, since identical flats can sell with about 4 percent variation (one standard deviation) within the same month.
2. How GraphBlocks Works: A hierarchical graph inspired by energy minimisation
GraphBlocks is a hierarchical graph inspired by energy minimisation. It has a node for the nation, each town, each flat type within a town, and each block. Parents link to their children, and neighbouring towns and blocks link to each other.
Each town and flat type node makes its own forecast, blocks start from their fair price and follow the change of their town and flat type, and every disagreement costs energy. The model finds the lowest energy solution: the one set of forecasts that stays closest to every node, while each parent equals the sales weighted sum of its children. All four outputs come from this one solution, each with percentile bands - Fair Price of Block, Town Avg Price, Rental Block Price and Town Rental Avg Price.
How each node starts
- Block: its fair price today, found by pricing the flat from its lease, size, floor and type, then adding the block's premium. A block with few sales borrows its premium from its eight nearest blocks, found using OneMap coordinates [5].
- Town and flat type: the adjusted price per square foot, which ignores differences in lease, storey and size, and the median rent [10].
- Town and nation: built up from the nodes below them, weighted by recent sales.
Incorporating global information
In order for predictions to take into account global information, national factors enter every node, from block to nation, and towns and blocks also get local factors and future plans:
- National factors: how national prices and rents have recently moved, including the official Resale Price Index [2]. This is the market-wide trend, so a national move lifts every node.
- Local factors: the node's own recent trend and, for towns, its neighbours' trends.
- Future plans: a new MRT station or HDB development, applied at town level and read at three moments - when it is announced (we have dates for the Downtown Line and Thomson-East Coast Line), when it first completes, and when its flats can first be resold, five years after completion [6, 7].
In an event study of 16 new MRT stations, resale prices nearby were +2.7 percent higher a year after opening (95 percent band 0.0 to 5.5) [1, 8].
3. Our Results: Empirical evidence of GraphBlocks' effectiveness
How we tested it
We replayed history. For each past quarter, the model saw only earlier data and forecast 1, 2 and 4 quarters ahead. Thereafter, we compared each forecast with the actual prices. We chose the model's settings on 2015 to 2018 and report 2019 to 2026, a period with both a boom and a cooling. All scores come from the same reconciled graph.
Our two scores
- Price accuracy: how close the forecast is to the real price. It is 100 percent minus the average percentage error. For rent, it is the same measure on the forecast rent.
- Direction accuracy: how often we correctly call a rise or a fall. It counts moves of at least 2 percent.
Town prices are adjusted for lease, storey and floor area, so they do not jump with the mix of flats sold. All scores cover all flat types (rent covers 3 to 5 room flats).
Results
| Forecast | Score | 1 Quarter Ahead | 2 Quarters Ahead | 4 Quarters Ahead |
|---|---|---|---|---|
| Fair Price of Block | Price accuracy | 96.1% | 95.8% | 94.4% |
| Direction accuracy | 63.2% | 75.6% | 84.8% | |
| Town Avg Price | Price accuracy | 98.8% | 98.2% | 96.2% |
| Direction accuracy | 92.7% | 93.3% | 90.3% | |
| Town Rental Avg Price | Price accuracy | 97.5% | 95.9% | 93.9% |
| Direction accuracy | 81.5% | 82.0% | 87.2% |
Interpreting the results
Town prices are forecast 98.8 percent accurately one quarter ahead and 96.2 percent four quarters ahead, and the direction is right 90.3 percent of the time at four quarters. If we simply assumed prices do not change, town prices would score 98.1, 96.6 and 93.5 percent, so the model's advantage grows the further ahead it looks.
Forecast ranges
No forecast is certain, so every forecast comes with a range, not just one number. For Town Avg Price four quarters ahead, in the 2019 to 2026 test years, the 10th to 90th percentile range, meant to catch 80 percent of outcomes, caught 64 percent, and the 25th to 75th percentile range, meant to catch 50 percent, caught 32 percent.
4. What the Dashboard Shows Buyers
Each item below is data buyers see on the dashboard. The AI agent in section 5 can answer questions about all of it.
Fair Price of Block
The fair price today of one block and flat type, its gap to the asking price, and the typical error.
- Why: public data lists only sold prices, so no one can tell if an asking price is fair.
- How: the fair price model of section 2, refit each quarter on earlier sales only.
Town Avg Price
A town's adjusted price per square foot, by flat type, up to two years ahead with percentile bands (accuracy is reported to four quarters).
- Why: a buyer deciding when to commit needs to know where the town is heading.
- How: the hierarchical graph of section 2, with planned stations and developments.
Rental Block Price
The estimated rent of a block.
- Why: renting is the cost of waiting to buy, yet open data gives rent only by town.
- How: town rent scaled by the block's price position.
Town Rental Avg Price
Median rent by town and flat type for 3 to 5 room flats, with its forecast, beside price.
- Why: 51.8 percent of published rent cells are suppressed, mostly for 1 and 2 room flats [10].
- How: the pipeline cleans the cells, then forecasts rent in the same model as price.
Affordability
Years of household income needed for a block, now and along the forecast price path.
- Why: a price means little until it is set against a pay cheque.
- How: price divided by an income estimate for each block, calibrated to published income [16, 17]. The median block costs 13.8 years of income. The estimate is rough, and the page says so.
Cost of Living and Equity Flag
A cost score for 26 towns, and a flag on towns with high cost and low income (25 towns have income data).
- Why: a cheap flat in a costly area still strains a budget.
- How: principal component analysis of 19 indicators, such as rent, transport, MRT distance and amenities. Geylang and Kallang/Whampoa are flagged.
Forecast Range
The range of likely outcomes for any forecast, from the 10th to the 90th percentile.
- Why: a single number hides how uncertain a forecast is.
- How: percentiles of the model's past errors are added to the forecast, so the range widens the further ahead it looks.
Future Plans: MRT and BTO Effects
The past price gap near comparable stations and developments, and the forecast with and without a plan the buyer adds.
- Why: buyers cannot see what past plans did to prices.
- How: an event study of past stations and developments, with plans entering the model at announcement, first completion and MOP.
5. An Agentic Agent: the integration of GraphBlocks Guide
Not everyone wants to click through a dashboard. GraphBlocks Guide is a chat agent that lets buyers and owners ask questions in plain words and get answers grounded in our forecasts and data.
What you can ask
- Is this price fair? "Is $650,000 a fair asking price for a 4 room flat in Punggol?"
- Where is it heading? "Where is the average 4 room price in Woodlands heading over the next year?"
- What would a plan change? "What happens to 4 room prices in Punggol if a station opens in 2028?"
- Where can I afford to live? "Which towns are flagged as high cost and low income?"
- Where does this come from? "How was this number calculated, and how accurate is it?"
How the model feeds the agent
The agent does not make up answers from memory. Everything it says is read from the same forecasts and cleaned data that power the dashboard.
- You ask in plain words. The question goes to an open language model served through Databricks Foundation Model APIs, with a template fallback if no model is available on Free Edition.
- The model picks a tool. It chooses the tool that fits the question and fills in the details, such as the town, flat type and timeframe.
- The tool reads our data. The tools read precomputed tables from the GraphBlocks model through the SQL warehouse, so answers come back quickly.
- You get an answer with a data card. The model puts the result into plain words, and the card shows the sources and the typical error behind it.
The four tools
- ask_data: answers general questions about all the cleaned data, through a Databricks Genie space.
- fair_value: compares an asking price with the fair price of a block.
- scenario: shows the forecast with and without a plan, such as a new MRT station, from forecasts precomputed for a fixed menu of plans, so you can see what it changes.
- explain: gives the source, method, past error and lineage behind any number.
Why you can trust the answers
- Every number comes from a tool. The language model writes the words, but every number is copied from the tool's output.
- Every answer carries a data card with its sources and typical error.
- The agent says no. If the data cannot support a question, it declines instead of guessing.
6. Data and Databricks
Everything in GraphBlocks runs on one Databricks backend. The same open data is landed once, cleaned once, and then split into two uses: training the model, and showing results to buyers.
Data for model training
These open datasets teach the model how prices and rents move and what plans have done:
- Prices: resale transactions [1, 12, 13, 14, 15], HDB Property Information [7], Resale Price Index [2], and OneMap coordinates for each block [5].
- Rent and plans: median rent [10], completions [6], the Under-Construction layer [9], station openings from Wikidata [8].
Data for visualisation
These open datasets, together with the model's forecasts, power what buyers see on the dashboard and in the agent:
- People and places: Census 2020 and income series [16, 17, 11, 18], amenities [19, 20, 21, 22, 23, 24, 25]. They feed Affordability and Cost of Living and Equity Flag.
- Model outputs: the four forecasts, their percentile ranges and the plan scenarios, saved as small tables.
The Databricks backend
Training and visualisation both sit on the same layers, so every number can be traced back to its source.
| Layer | What it does | Used for |
|---|---|---|
| Unity Catalog Volume | Holds the raw files exactly as downloaded | Both |
| Bronze (Auto Loader) | Reads raw files in, with the rescue column turned on so a renamed column is kept instead of stopping a run | Both |
| Silver (Lakeflow Spark Declarative Pipelines) | Cleans the data with expectations and sends bad rows, such as null tokens, duplicate keys and drifting labels, to a quarantine table | Model training |
| Gold | Small tables by town, flat type and quarter | Visualisation and the agent |
| MLflow | Registers the models and logs their backtest metrics | Model training |
| Lakeflow Jobs | Precompute the Gold tables, including forecasts for a fixed menu of plans, so dashboards load quickly | Both |
| AI/BI dashboards, Genie and the agent | Dashboard, plain-language questions and GraphBlocks Guide, reading Gold on the 2X-Small SQL warehouse | Visualisation |
| Unity Catalog governance | Lineage, table descriptions and access across every layer | Both |
In short, the model is trained on Silver, and buyers see Gold. The dashboard and the agent read precomputed Gold tables, so answers should stay quick and within Databricks Free Edition limits.
7. What the Numbers Do and Do Not Show
- The test years hold one boom and one cooling.
- Only two lines have announcement dates, so event effects are wide.
- Block rents are never published, so Rental Block Price is an estimate of the Town Rental Avg Price adjusted by each block's price premium.
8. Conclusion
Mei and Daniel can open one place and see what their block is worth, where prices and rents are heading, and what a plan could change.
References
[1] Housing and Development Board (2026). Resale flat prices based on registration date from Jan-2017 onwards [Data set]. data.gov.sg. https://data.gov.sg/datasets/d_8b84c4ee58e3cfc0ece0d773c8ca6abc/view (accessed 6 October 2026; last updated 2026-10-06) [2] Housing and Development Board (2026). HDB Resale Price Index (1Q2009 = 100), Quarterly [Data set]. data.gov.sg. https://data.gov.sg/datasets/d_14f63e595975691e7c24a27ae4c07c79/view (accessed 6 October 2026; last updated 2026-07-24) [3] SRX (2026). HDB BTO launch prices [Web page]. https://www.srx.com.sg/hdb/bto (accessed 6 October 2026) [4] AsiaOne (2025, 13 February). Median household incomes in Singapore rose in 2024 [News article, reporting the Department of Statistics, Key Household Income Trends 2024]. https://www.asiaone.com/singapore/median-household-incomes-singapore-rose-2024-resident-households-received-more-help-govt [5] Singapore Land Authority (n.d.). OneMap Search API. https://www.onemap.gov.sg/apidocs/ (accessed 6 October 2026) [6] Housing and Development Board (2026). Completion Status of HDB Residential Units by Town/Estate [Data set]. data.gov.sg. https://data.gov.sg/datasets/d_9bbcd0c9b0351c7f41c9bfdcdc746668/view (accessed 6 October 2026; last updated 2026-01-20) [7] Housing and Development Board (2026). HDB Property Information [Data set]. data.gov.sg. https://data.gov.sg/datasets/d_17f5382f26140b1fdae0ba2ef6239d2f/view (accessed 6 October 2026; last updated 2026-07-06) [8] Wikimedia Foundation (n.d.). Wikidata Query Service [Data set]. https://query.wikidata.org/sparql (accessed 6 October 2026). Licence: https://www.wikidata.org/wiki/Wikidata:Licensing [9] Housing and Development Board (2026). HDB Public Housing Building Under-Construction [Data set]. data.gov.sg. https://data.gov.sg/datasets/d_930e662ac7e141fe3fd2a6efa5216902/view (accessed 6 October 2026; last updated 2026-09-04) [10] Housing and Development Board (2026). Median Rent By Town And Flat Type [Data set]. data.gov.sg. https://data.gov.sg/datasets/d_23000a00c52996c55106084ed0339566/view (accessed 6 October 2026; last updated 2026-07-24) [11] Singapore Department of Statistics (2026). Resident Households by Planning Area of Residence and Monthly Household Income from Work (Census Of Population 2020) [Data set]. data.gov.sg. https://data.gov.sg/datasets/d_2d6793de474551149c438ba349a108fd/view (accessed 6 October 2026; last updated 2022-07-28) [12] Housing and Development Board (2026). Resale Flat Prices (Based on Approval Date), 2000 to Feb 2012 [Data set]. data.gov.sg. https://data.gov.sg/datasets/d_43f493c6c50d54243cc1eab0df142d6a/view (accessed 6 October 2026; last updated 2024-08-28) [13] Housing and Development Board (2026). Resale Flat Prices (Based on Approval Date), 1990 to 1999 [Data set]. data.gov.sg. https://data.gov.sg/datasets/d_ebc5ab87086db484f88045b47411ebc5/view (accessed 6 October 2026; last updated 2024-08-28) [14] Housing and Development Board (2026). Resale Flat Prices (Based on Registration Date), From Mar 2012 to Dec 2014 [Data set]. data.gov.sg. https://data.gov.sg/datasets/d_2d5ff9ea31397b66239f245f57751537/view (accessed 6 October 2026; last updated 2024-08-28) [15] Housing and Development Board (2026). Resale Flat Prices (Based on Registration Date), From Jan 2015 to Dec 2016 [Data set]. data.gov.sg. https://data.gov.sg/datasets/d_ea9ed51da2787afaf8e51f827c304208/view (accessed 6 October 2026; last updated 2024-08-28) [16] Singapore Department of Statistics (2026). Average And Median Monthly Household Employment Income Per Household Member (Including Employer CPF Contributions) Among Resident And Resident Employed Households, 2000 to 2025 (Household Income, Annual) [Data set]. data.gov.sg. https://data.gov.sg/datasets/d_472200f9806362db03be41b5068677e4/view (accessed 6 October 2026; last updated 2026-02-09) [17] Singapore Department of Statistics (2026). Average Monthly Household Employment Income Per Household Member (Excluding Employer CPF Contributions) Among Resident Employed Households by Type of Dwelling (Household Income, Annual 2000-2025) [Data set]. data.gov.sg. https://data.gov.sg/datasets/d_c49b6cc84ccab3a0523ad15a907e57be/view (accessed 6 October 2026; last updated 2024-02-07) [18] Singapore Department of Statistics (2026). Resident Population by Planning Area/Subzone of Residence, Age Group and Sex (Census of Population 2020) [Data set]. data.gov.sg. https://data.gov.sg/datasets/d_d95ae740c0f8961a0b10435836660ce0/view (accessed 6 October 2026; last updated 2021-06-18) [19] Land Transport Authority (2026). LTA MRT Station Exit (GEOJSON) [Data set]. data.gov.sg. https://data.gov.sg/datasets/d_b39d3a0871985372d7e1637193335da5/view (accessed 6 October 2026; last updated 2026-09-16) [20] Land Transport Authority (2026). LTA Bus Stop [Data set]. data.gov.sg. https://data.gov.sg/datasets/d_3f172c6feb3f4f92a2f47d93eed2908a/view (accessed 6 October 2026; last updated 2026-10-06) [21] National Environment Agency (2026). Hawker Centres (GEOJSON) [Data set]. data.gov.sg. https://data.gov.sg/datasets/d_4a086da0a5553be1d89383cd90d07ecd/view (accessed 6 October 2026; last updated 2026-10-06) [22] National Environment Agency (2026). List of Supermarket Licences [Data set]. data.gov.sg. https://data.gov.sg/datasets/d_11edd0117280c5776651d7891114c88c/view (accessed 6 October 2026; last updated 2024-06-06) [23] National Parks Board (2026). Parks [Data set]. data.gov.sg. https://data.gov.sg/datasets/d_0542d48f0991541706b58059381a6eca/view (accessed 6 October 2026; last updated 2026-10-04) [24] Early Childhood Development Agency (2026). Pre-Schools Location [Data set]. data.gov.sg. https://data.gov.sg/datasets/d_61eefab99958fd70e6aab17320a71f1c/view (accessed 6 October 2026; last updated 2024-06-06) [25] Ministry of Education (2026). General information of schools [Data set]. data.gov.sg. https://data.gov.sg/datasets/d_688b934f82c1059ed0a6993d2a829089/view (accessed 6 October 2026; last updated 2026-04-17)

Log in or sign up for Devpost to join the conversation.