-
-

graph querying
-
arangodb in action
-
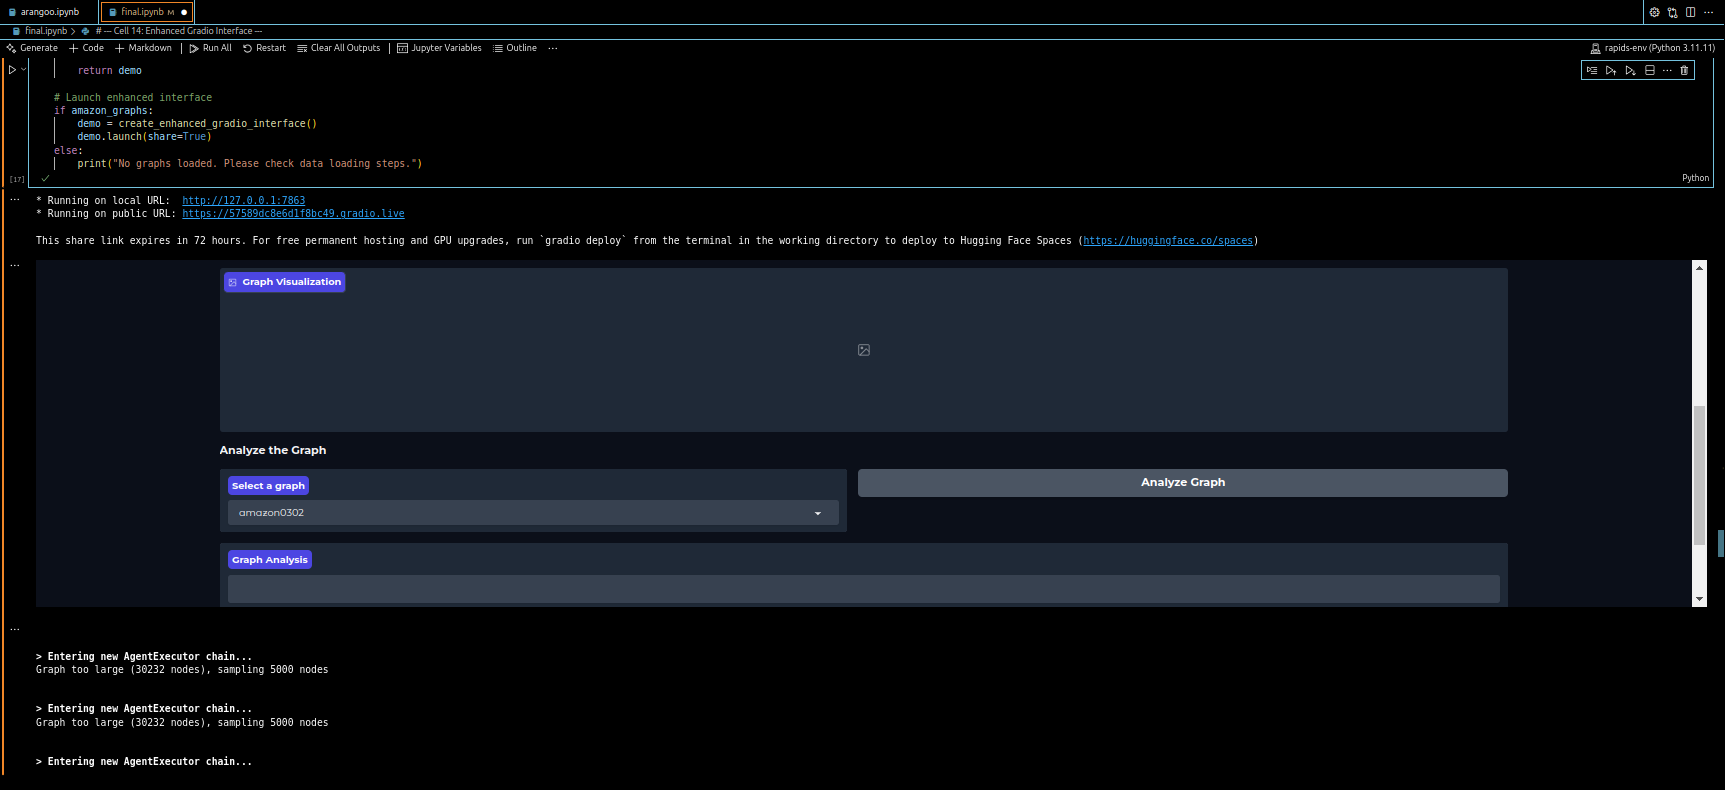
sampling nodes and agentic queries
Inspiration :
The idea for Graphazon: CoPurchase Cosmos stemmed from a fascination with how everyday shopping habits reveal hidden patterns. Amazon’s vast co-purchase data offered a treasure trove to explore using graph theory and AI. We wanted to create a tool that not only analyzes these connections but also makes them accessible and visually engaging, turning raw data into actionable insights for enthusiasts, researchers, and businesses alike.
What it does:
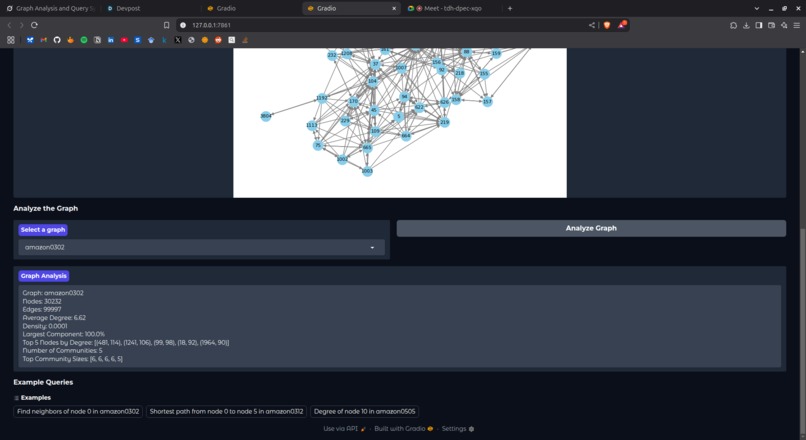
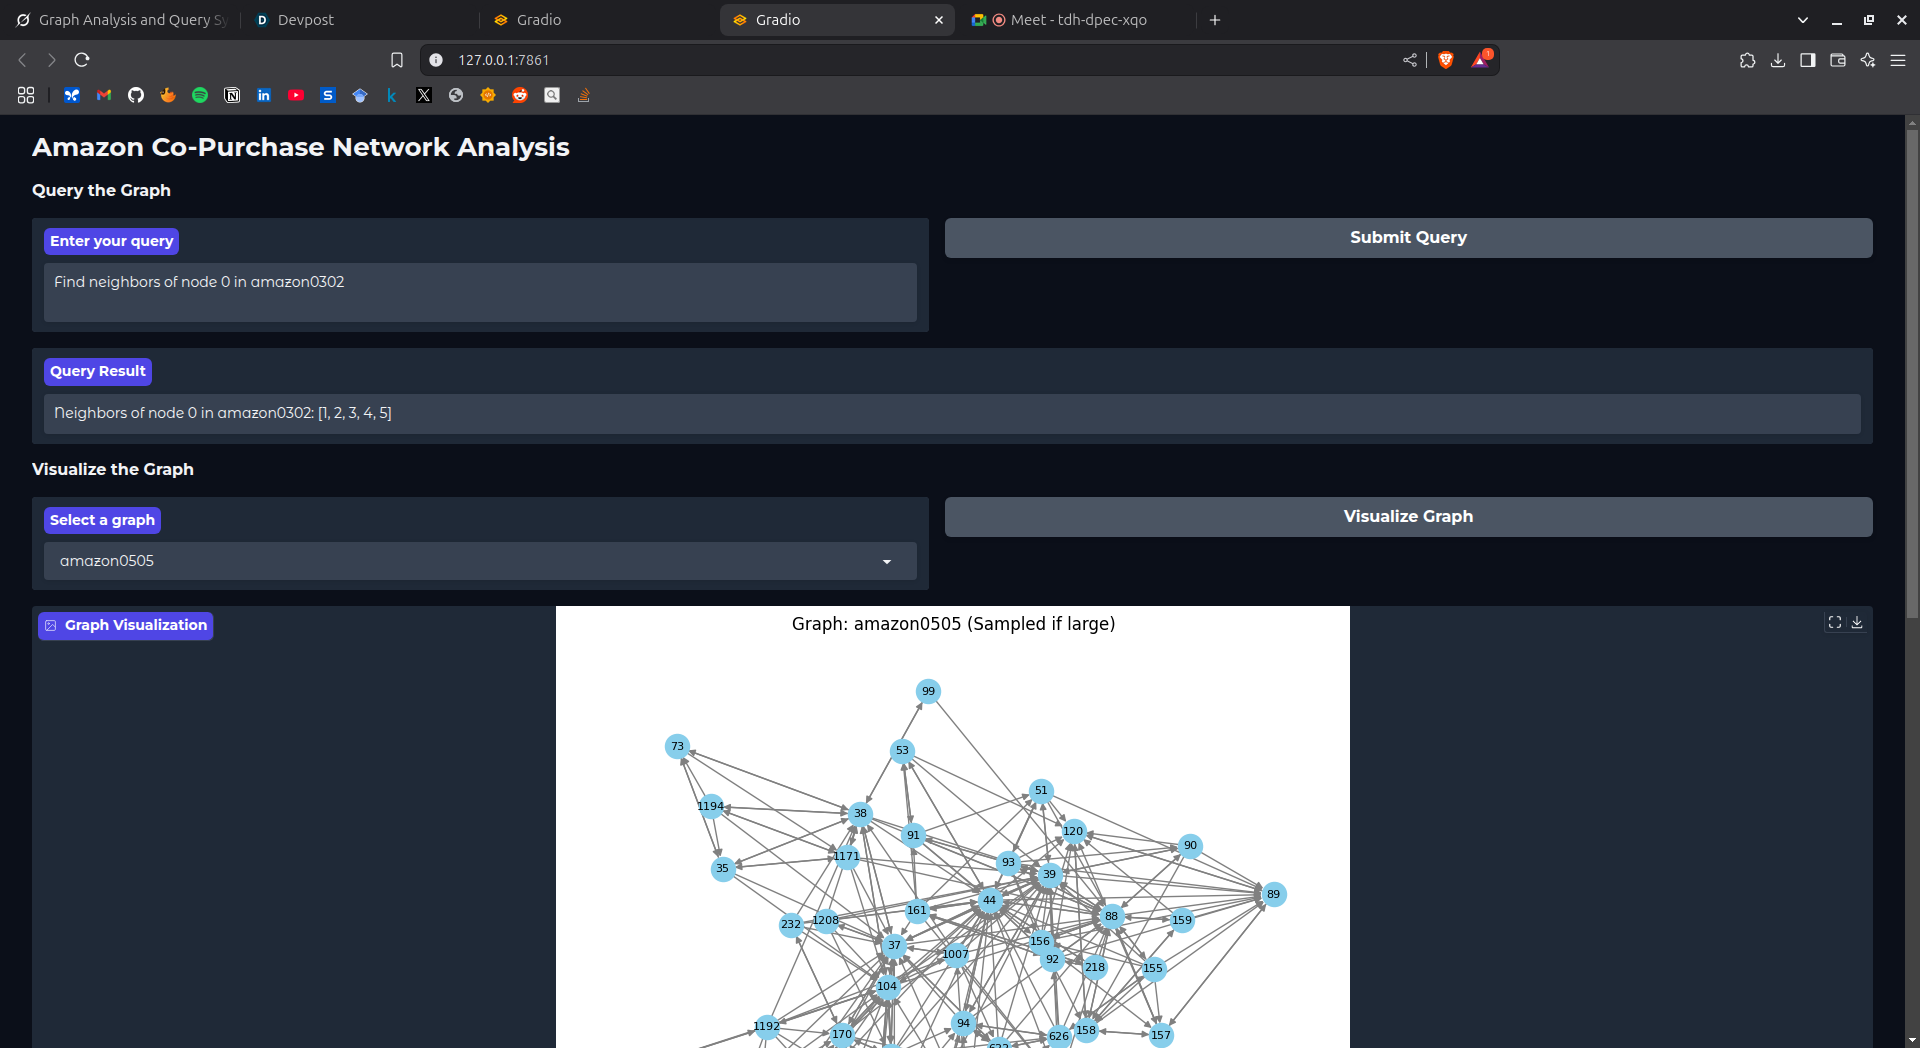
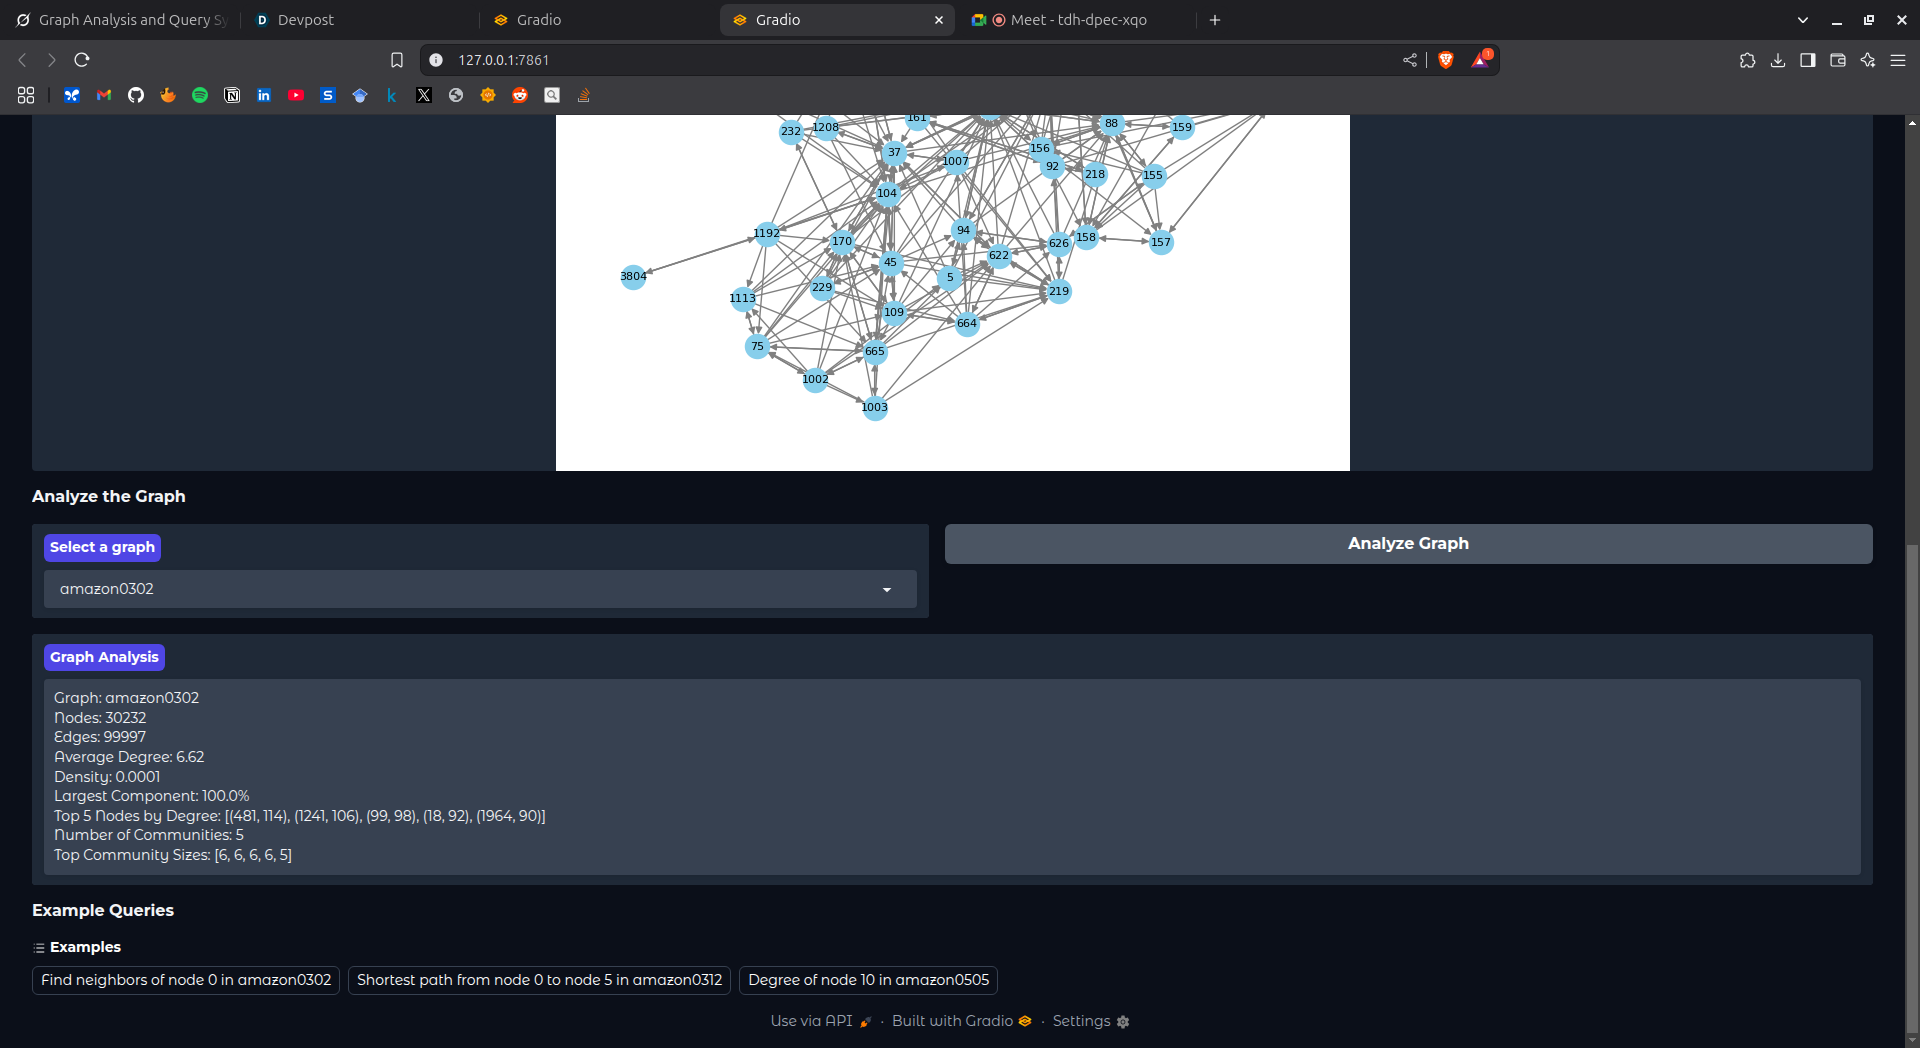
Graphazon: CoPurchase Cosmos transforms Amazon co-purchase datasets into interactive graph networks. It lets users query product relationships (e.g., "What’s co-bought with item X?"), visualize network structures, and analyze metrics like community clusters and degree distributions—all through a sleek Gradio interface. Powered by AI, it delivers fast, intuitive answers to complex questions about purchasing behavior.
How we built it:
We built Graphazon using Python, leveraging: NetworkX for graph creation and analysis from Amazon SNAP datasets. ArangoDB for persistent storage of large-scale graphs. LangChain with Cohere’s LLM to enable natural language queries via a ReAct agent. Gradio for a custom, tabbed interface with real-time visualizations. Matplotlib for plotting graphs, degree distributions, and community sizes. The process involved downloading data, parsing it into graphs, integrating AI tools, and designing a user-friendly frontend.
Challenges we ran into:
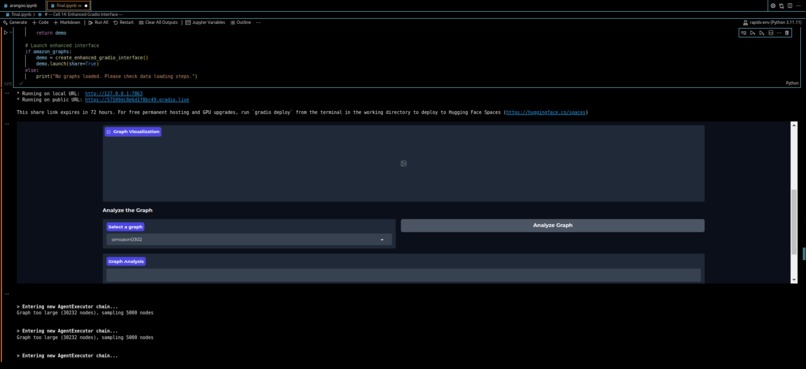
Scale: Handling graphs with 300k+ nodes required sampling techniques to manage memory and speed. Integration: Syncing LangChain’s agent with NetworkX and ArangoDB took careful prompt tuning and error handling. Port Conflicts: Gradio’s fixed port (7860) often clashed, necessitating dynamic port selection. UI Polish: Ensuring a visually stunning interface meant wrestling with Gradio’s API limitations (e.g., styling Examples).
Accomplishments that we're proud of:
Seamless AI Queries: Users can ask natural questions like "What’s the shortest path between items?" and get precise answers. Stunning Visuals: A modern indigo-purple interface with graphs, bar charts, and community plots. Robust Backend: Successfully persisted massive graphs to ArangoDB and analyzed them efficiently. Error Resilience: Overcame version mismatches and port issues with dynamic solutions.
What we learned:
Graph Theory: Sampling large networks and detecting communities with Louvain algorithms. AI Integration: Crafting effective prompts for LangChain’s ReAct agent to handle graph queries. UI Design: Balancing aesthetics and functionality in Gradio with custom CSS and themes. Debugging: Tackling dependency errors (e.g., vars(), _js) taught us to adapt across library versions.
What's next for Graphazon:
CoPurchase Cosmos: Metadata Enrichment: Integrate product metadata (e.g., titles, categories) for richer queries and visuals. Real-Time Updates: Stream live Amazon data for dynamic network evolution. Advanced Analytics: Add centrality measures (e.g., PageRank) and predictive modeling. Scalability: Optimize with cuGraph for GPU acceleration and expand to multi-user cloud deployment. Mobile App: Port the interface to a mobile-friendly version for broader access.
Built With
- cohere
- datasets
- gradio
- langchain
- networkx
- python
- snap


Log in or sign up for Devpost to join the conversation.