Inspiration
The creation of Graphaway was inspired by the need for an accurate, easy to use and reliable software for plotting sets of data primarily with Python applications. It was created to bypass the cumbersome process of repeating python scripts to generate plots for input data, as well as to avoid issues arising from using Microsoft Excel as a plotting tool, primarily deviations in the formatting of the data. As such, we created a software using Streamlit and Python to generate data plots easily without any coding required from the user in a simple, easy to use package that can be used on any device.
What it does
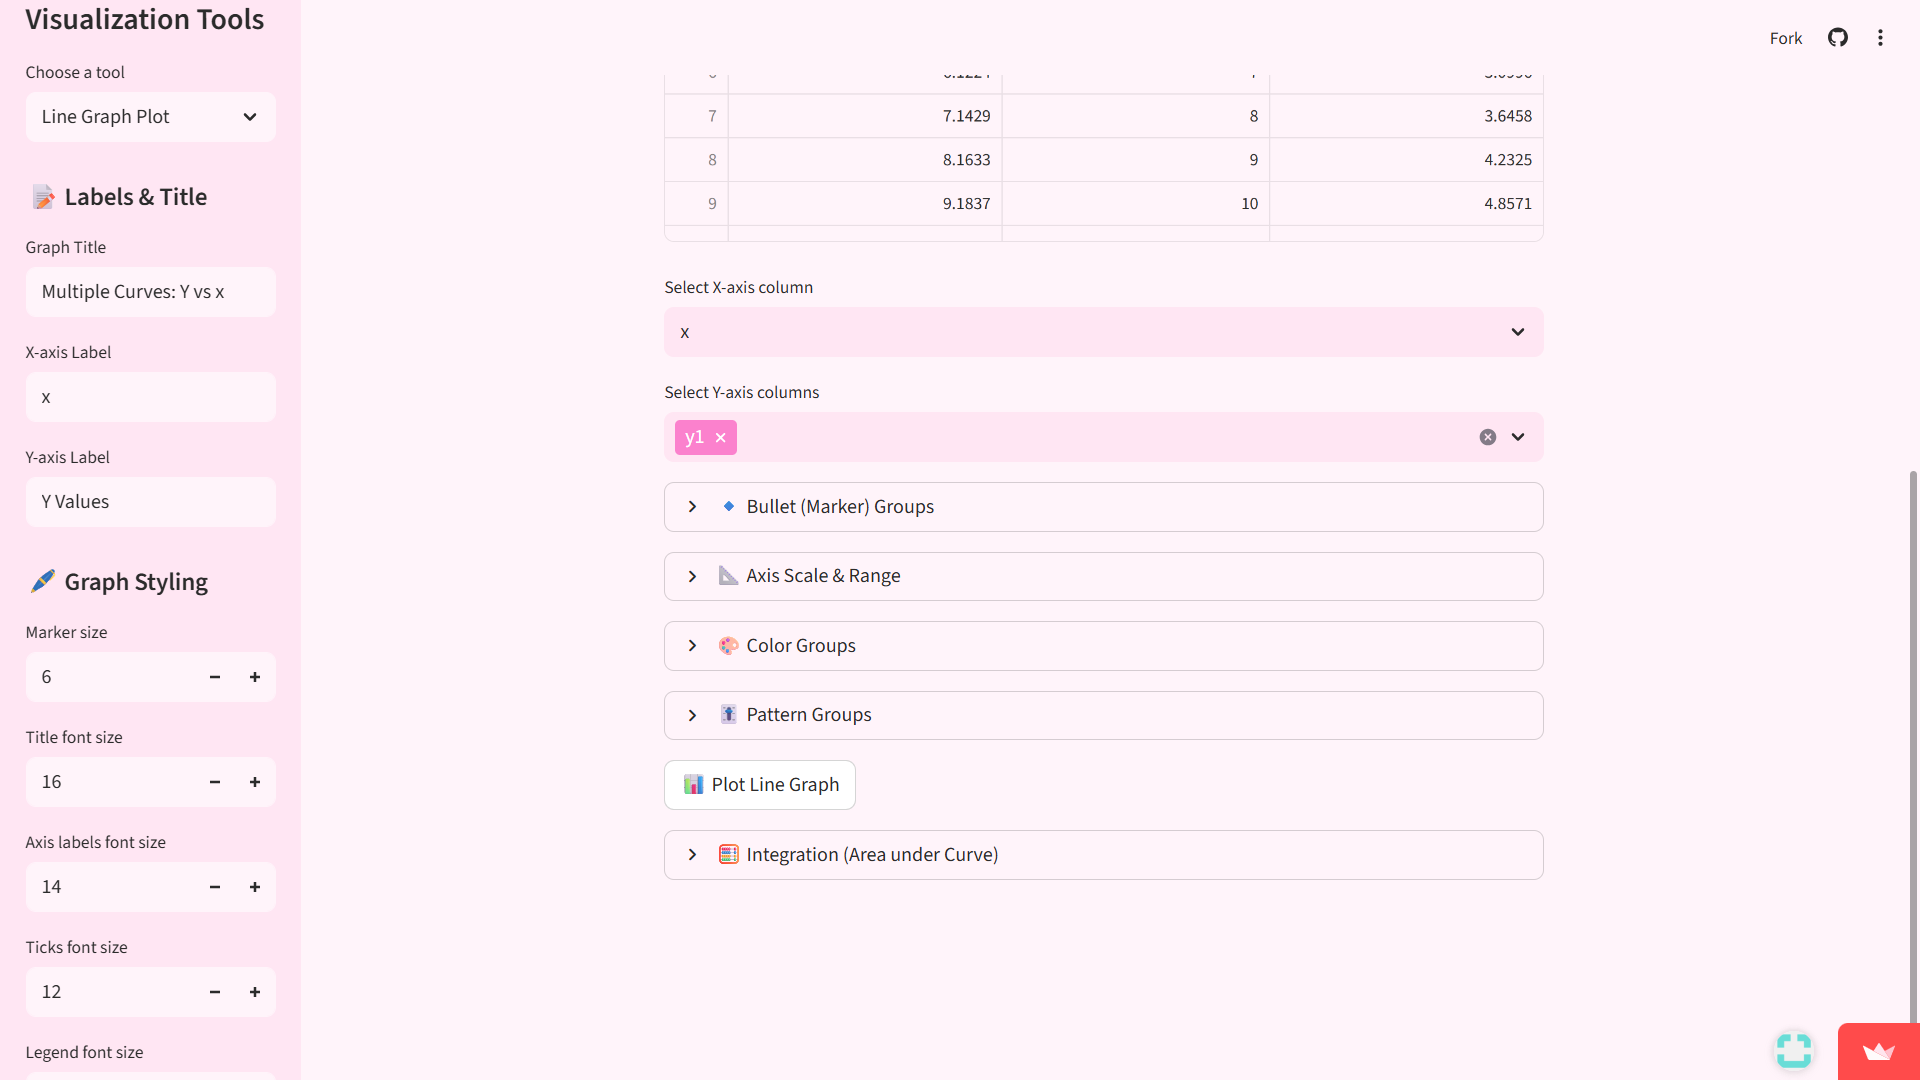
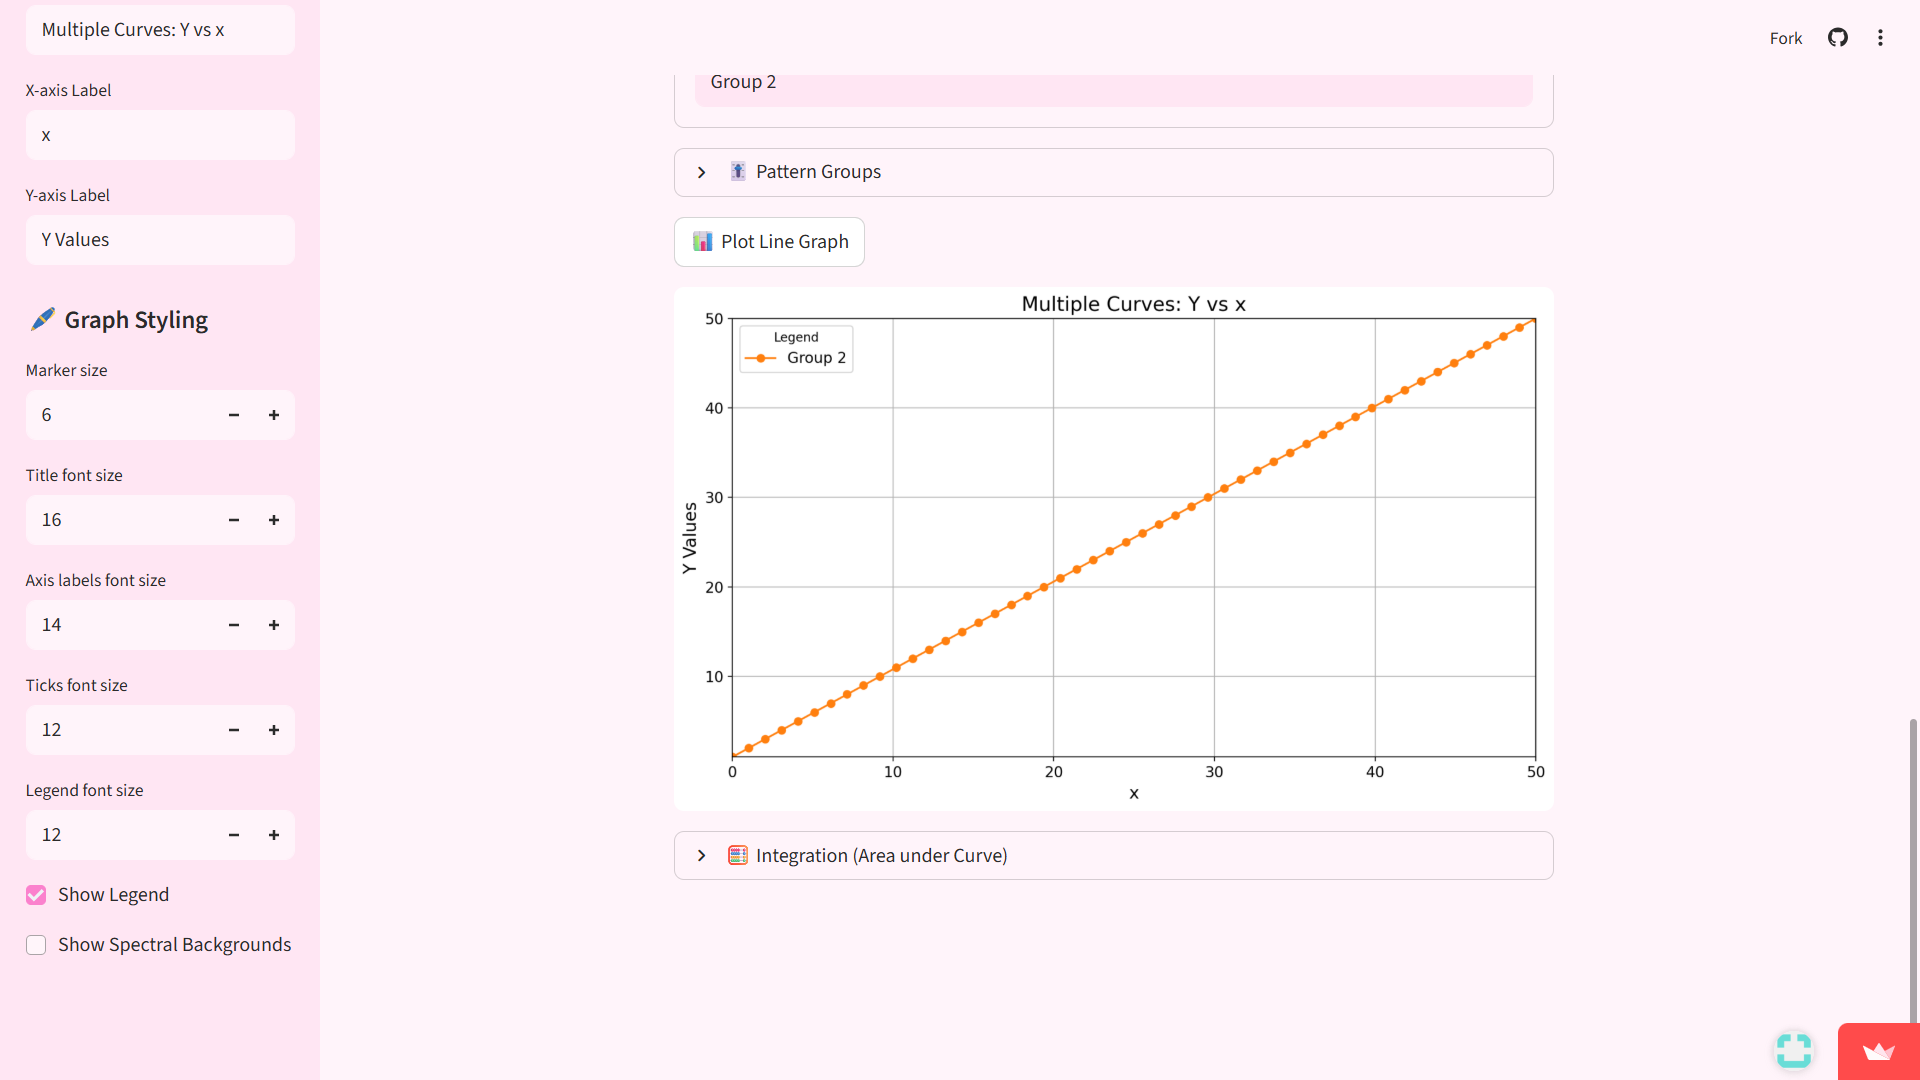
Graphaway streamlines the process of plotting data, it allows for users to simply import in a data set, accepting both .txt and .csv files, then from the drop-down box in the sidebar, users can select whether they wish to plot a line graph plot, a pie chart plot or a bar graph plot, giving immediate output plots. Users can specify various parameters of the plot to be generated, such as-
Select x-axis and y-axis from the given dataset. For user inputted datasets containing more than 2 set of data, users can select which sets are to be plotted and the axes to be plotted upon (E.g.- For a dataset with 3 values; a, b, c, users may select any 2 as either x-axis or y-axis and all points in the selected dataset will appear as points on axis of graph, i.e. say a->x, then all points of a will be plotted on x-axis).
Range of values for x and y axes in the plot. Users can manually adjust the range of points to be displayed on the graph on both x-axis and the y-axis based upon the user input data file. Users can input the minimum and maximum range to be displayed using a text input from a simple drop-down option.
Switch between Linear or Log scales. By selecting or unselecting a tick mark on a drop-down option on the webapp, users can adjust whether they wish to display log scale or linear scale on output plot.
Include bullet point markers. Users can enable bullet point markers highlighting specific points on the displayed plot.
Customize sizes of fonts for markers, ticks and labels and more. Users can customize font sizes for all text displayed on the output plot including title text, axis labels, the legend font, as well as fonts for bullet point markers and ticks on the graph.
Creating different groups. Users can customize different groups of the data plotted as separate colour groups and pattern groups which in sets of data with multiple groups of displayed data allows for a clear and easy to read output graph plot. Users can adjust the colours and the shapes for colour groups and pattern groups respectively, with each being labelled in the legend for reference.
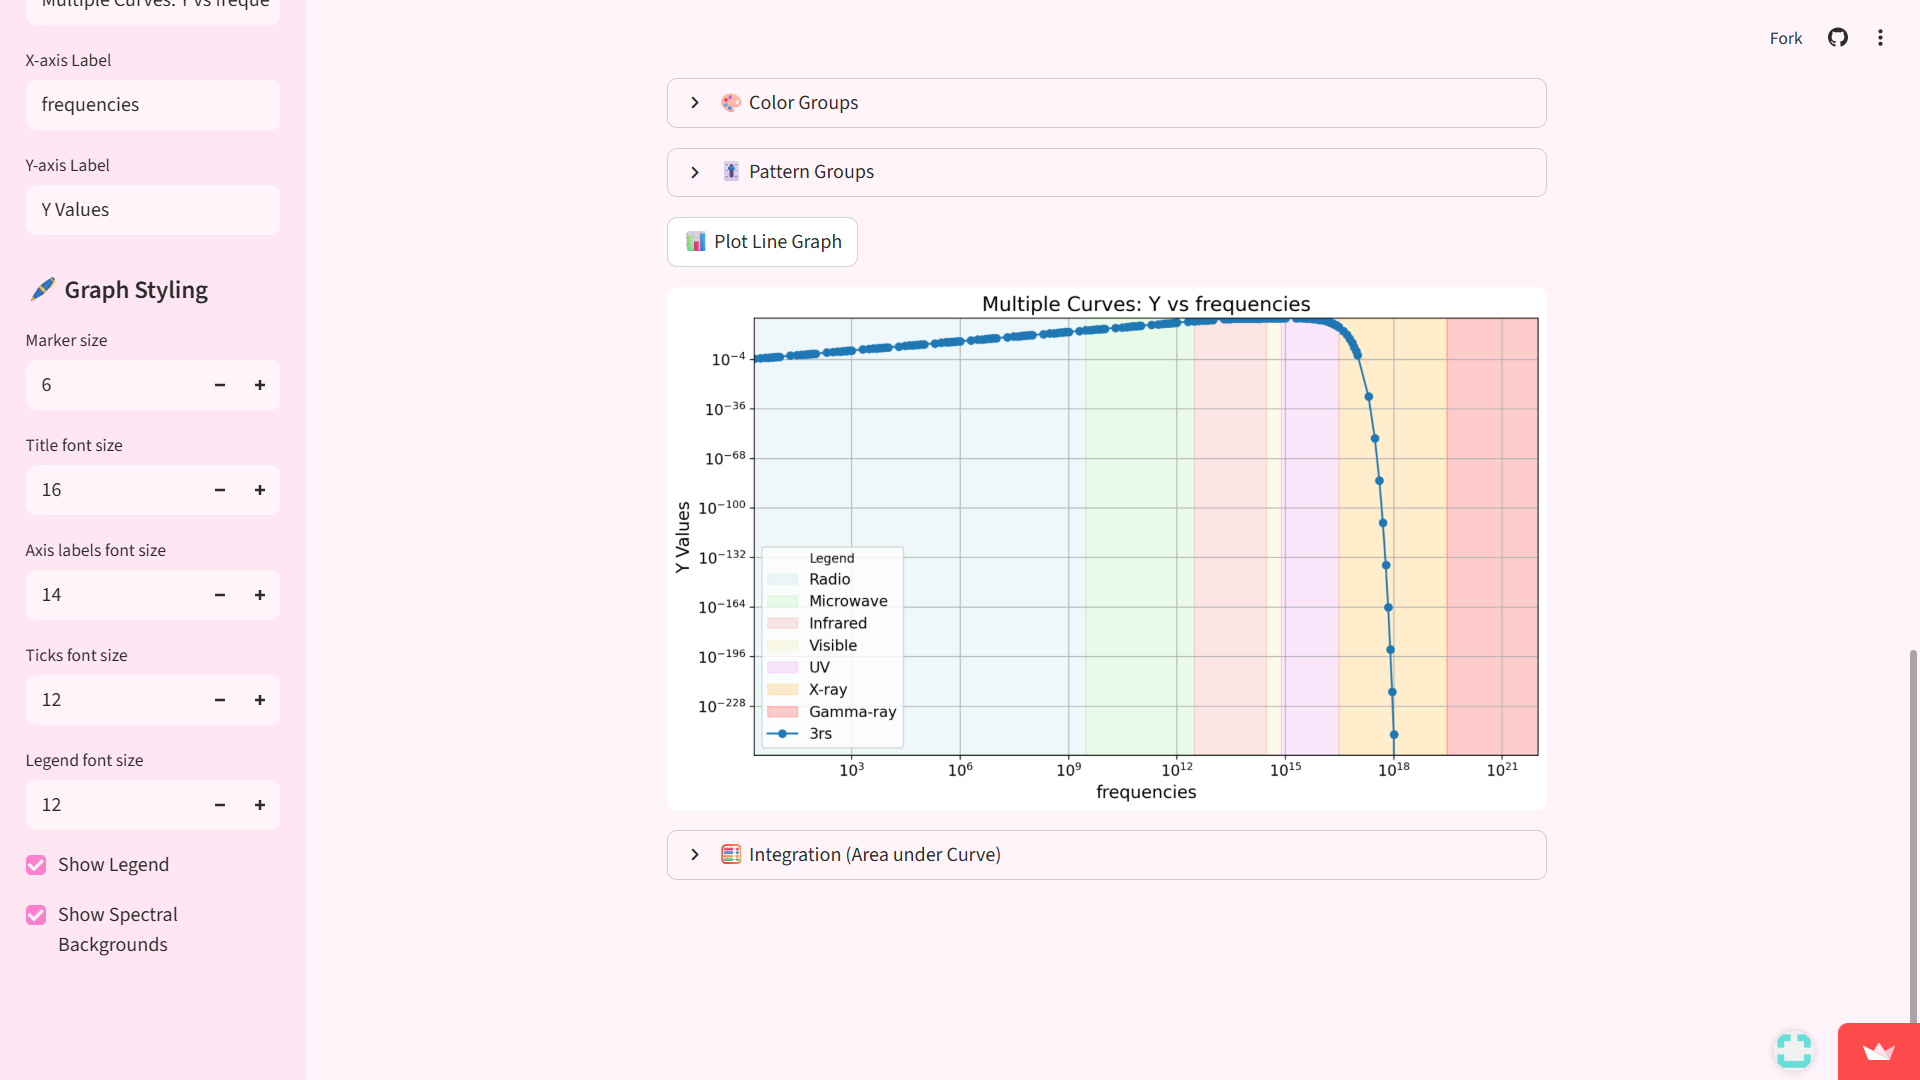
Incorporating Spectrum backgrounds. Users can incorporate spectrum backgrounds in the generated plot by selecting an option from the sidebar (so far Spectrum background is displayed only for the x-axis).
Integration of the data input in the graph. Graphaway allows users to integrate data using various numerical methods such as Simpson's 1/3rd rule of integration, trapezoidal rule of integration and Simpson's 3/8 rule of integrations, generating the result along with the graph plot.
How we built it
Graphaway is built entirely in Python using the following modules-
Numpy
Matplotlib.pyplot
Pandas
Scipy.integrate
Graphaway is hosted using streamlit and is free to access for anybody.
Challenges we ran into
While making Graphaway, there were plenty of challenges encountered which we overcame, in more detail, the challenges we ran into along the way include-
Text files not being usable as inputs. Graphaway initially could not use .txt files as a result of an oversight due to Python using white space as a delimiter, which would show up as an error message. This issue was fixed by incorporating a check box for .txt files enabling the use of white space as a delimiter allowing for text files to be used as an input.
Organizing the app layout. While creating the webapp, we found that arranging the input options as a lift of text inputs created an overwhelming and inefficient user interface, and to avoid making a user-enemy software, we faced the challenge of organizing all inputs in an easier to use way, thus we opted for the drop-down options offering a cleaner user interface which is easy to use and pleasing to look at. Additionally, the faced the issue of the app being in black and white which wasn't as aesthetically pleasing, which we overcame by using streamlit's functions to change the colour of the webapp to be more appealing to look at for users.
Issues with integrating data in Log scale. For input data already in log scale, it was found that we needed to tweak the integration function as it was implemented assuming linear scale data, thus giving inaccurate results for data provided already in log scale. To bypass this error, we incorporated an option to select if the data is in log scale for both the x-axis and y-axis individually, thus giving us an accurate resultant integral.
Cumbersome text options for the generated plot. The manner of displaying the legend and the bullet points on the graph was initially very cumbersome as each line had to be customized on its own, thus necessitating the incorporation of pattern and colour groups as a feature to have a standard user defined setting. Additionally, users would have to manually input the columns from the input dataset into the x-axis and y-axis columns with the exact characters, so to streamline this we implemented a drop-down option which allows users to manually select the columns from the input dataset.
Accomplishments that we're proud of
During the process of creating Graphaway, while we encountered many challenges, we also attained plenty of accomplishments along the way. We are especially proud that we accomplished making a software that can be used and hosted anywhere anytime, meaning that now as we do our work if our graphs need any changes, we can make them on the spot without any delays and even download the generated plots in the moment itself. We are also proud of creating an easy-to-read user interface without having an overwhelming number of options and still allowing for an immense degree of customization. Though creating Graphaway took effort and time, we are proud of having a software that we can always use and also distribute freely as well to other students in need of a software for graph plotting.
What we learned
We learned many features about Python and Streamlit as we developed Graphaway such as bullet point markers and making our software incredibly user friendly by not only incorporating multiple features and a great degree of customizability but by also making it very aesthetically pleasing for users solely using Python code and Streamlit's vast array of website design features. Additionally, we also learned a lot about various methods of numerical integration while creating Graphaway, giving us a better and more encompassing understanding of the mathematical tools used to make Graphaway as versatile of a software as it is.
What's next for Graphaway!
Graphaway is presently a robustly reliable and easy to use piece of software, and we have many more features that we aim to integrate soon to expand Graphaway's functionality. We aim to create field specific features allowing users to specify the way the data they wish to plot by creating subtabs for fields such as spectroscopy, statistics, optics, astronomy, teaching etc. We also aim to expand options for plotting different forms of data distribution such as pie charts and bar graphs and also incorporate statistical analyses of uploaded data and incorporate additional numerical methods and to expand the use of Graphaway in teaching and educational applications, to display formulas used as well.
Built With
- python
- streamlit

Log in or sign up for Devpost to join the conversation.