Inspiration
The homebuyer data sparked our teams’ interest through the keynote speaker’s presentation of their challenge. Our team was very interested in the panel’s views of data science and the utilization of their resources. Many of our teammates attended the workshops and connected with the Citizens bank’s representatives which made the homebuyer data a challenge we must tackle through the encouragement and relationships we made along the way. The motivation of our team was fueled by wanting to impress the people we admire and respect.
What it does
We built a graph connecting zip codes based on their physical locations. Each zip code represents a node, the weight of each edge is the distance between zip code centers. Using this graph and extensive external data we trained a graph neural network to predict homebuyers in a given region. We visualized this data using a density map showing where the majority of homebuyers are located within the time span of October 2019 to December 2019.
Our final model had about 65% accuracy in classifying the number of homebuyers into six quantiles.
How we built it
First, we took a statistical analysis using correlation matrices and a random forest model of the current data to understand the relationships between the variables. When we found out the data was lacking any connections, we decided to make it more interesting to pull in more data externally.
We gathered a lot of external data based on the internet research of important factors to consider when deciding to buy a home in a certain location. The main external certified datasets we used are from the US Census Bureau and Zillow. Collecting the data and cleaning as well as fitting the zipcodes took the majority of the time as the systems we were operating on our laptops took hours to process. While that was happening, our non-data science major member took the demographic data and converted it into an interactive visualization through Tableau.
This initiated the project of turning the collected and current data into a graph that is based on their physical location, which leads to the idea of training a graphed neural network to predict homebuyers (our objective). All the systems we used are listed below.
Summary of our steps:
- External data collection
- Walk and problem identification
- More data formatting and prep
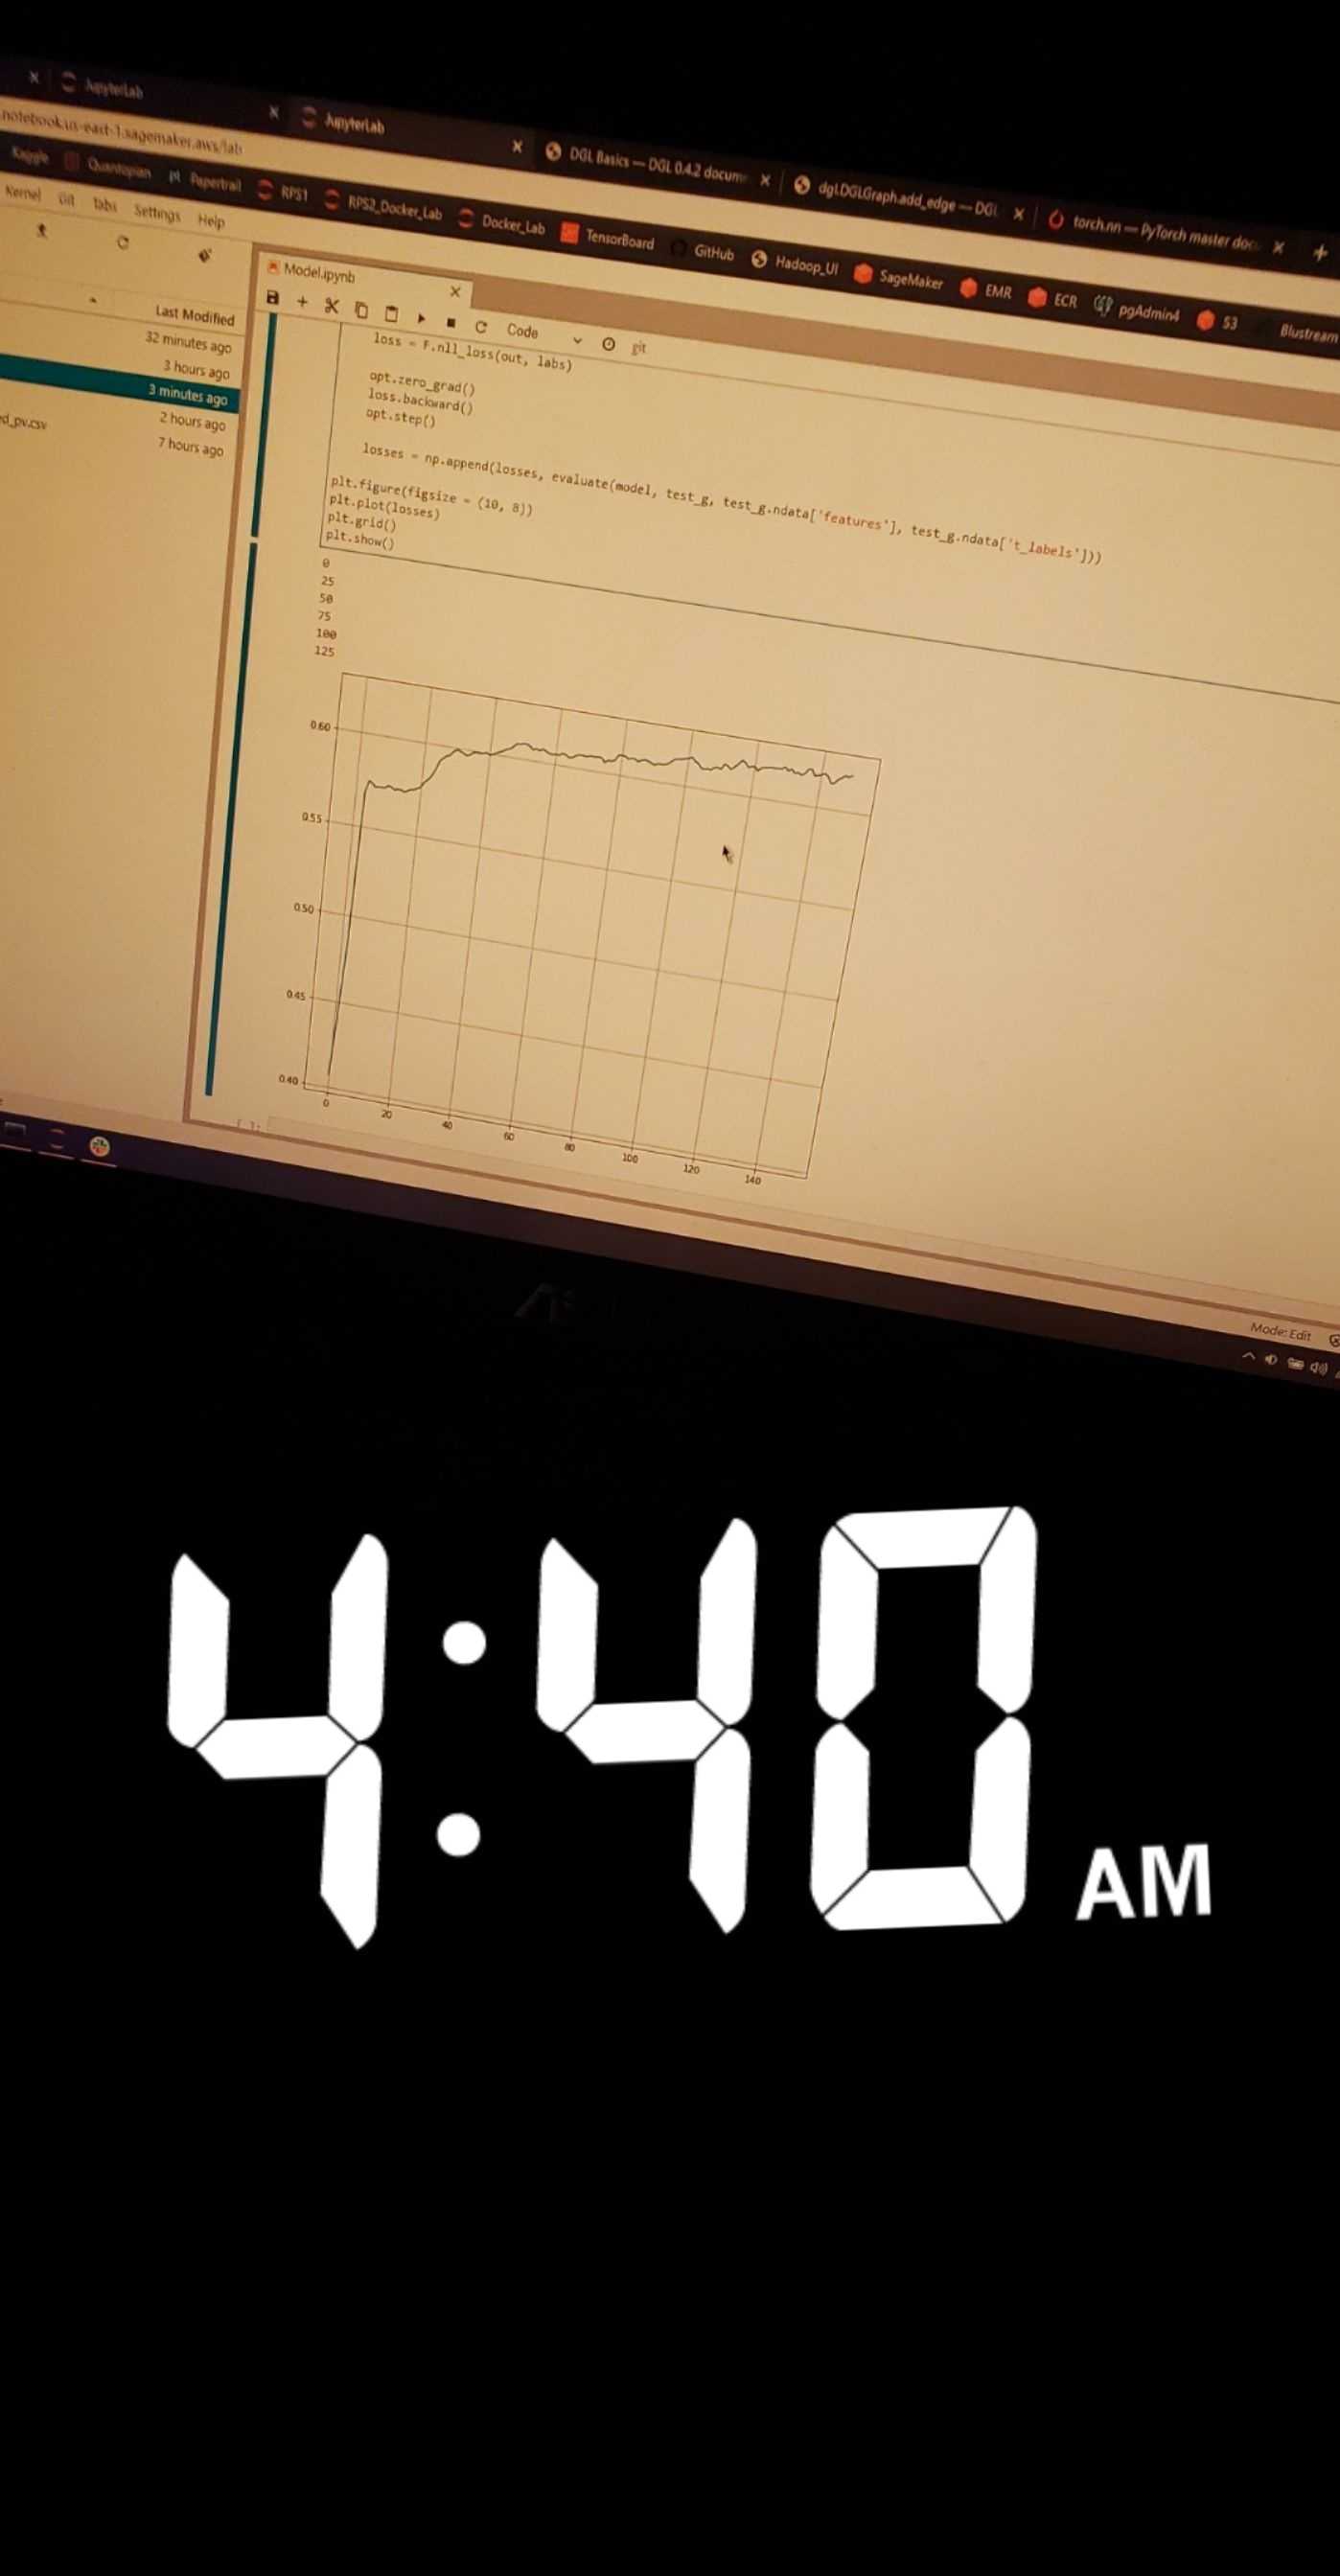
- Model training and evaluation
Challenges we ran into
The dataset had a lot of variables and elements to unravel. We found many issues with understanding the confusing descriptions, but we were not shy in communicating with the organizers and representatives of the companies to clarify the confusion.
Another challenge we had was running the huge dataset and the gathered extra dataset through our personal computers and systems that kept crashing or were slow processing. But it didn’t demoralize us as we trudge on persistently to complete the project. We wished we learned how to do Spark more because the data would've been much better to handle with knowledge of the system since of the data scale.
This is a challenge that is personal, but was enlarged during this event is that we tend to want to be as accurate as possible which requires a lot of back and forth communication on the logistics of our data and our plans to organize and present the data.
Accomplishments that we're proud of
We challenged ourselves to step outside our comfort zone and enter this competition! We are proud of ourselves for supporting each other and pushing our limits with this challenge. Our school has a very small upcoming Big Data Club at UMass Dartmouth. The club has only been running for 3 years and has only competed in ASA Datafest. This year’s e-board (us!) have been able to put together this event for our members and the experience has been worthwhile. We definitely hope to make this an event to attend yearly for our club.
For the data specifically, we are proud of even finishing this project! Our team has always been known to conjure the most complex questions because we are naturally curious and always ready for a challenge. Our sleepless endeavors paid off as we were able to complete the test and finalize a dataset that is revised and improved with variables that correlate more to the results of predicting homebuyers than the original data.
What we learned
The biggest thing we all learned was patience. Learning to be calm when the data processed slowly or the system crash because we compiled too much external data. Learning to be composed when it’s late at night and nothing is going the way you wish and team members can be difficult. But we were able to be patient with our data, equipment, our team, and ourselves.
We also learned that data science is really just 99% data cleaning and data prepping rather than the actual modeling progress. Much time was put into breaking down the data and understanding the core problem that was asked of us.
Some skills we were able to learn from each other and our peers are Amazon Sagemaker, graph neural networks and graph theory, what to expect from the industry world, how to better network, and patience is the key.
What's next for Citizens Bank
Based on our research and findings, we recommend investigating more into relationships between locations as opposed to individual data points. Creating distance-based relationships with graphs can help better identify how neighboring locations affect one another. Using a weighted graph provides an efficient method of modeling density and makes it easy to weigh the effects of relationships. We recommend building a graph where each zip5 represents a node, and each node contains a sub-graph the nodes of which represent individual households

Log in or sign up for Devpost to join the conversation.