-
-
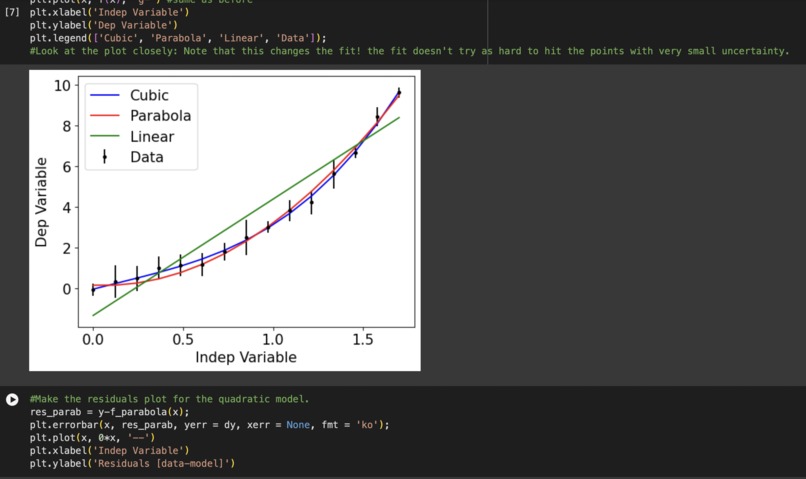
a sample of graph

Inspiration
My interest in data analysis and my hope to be of great assistance to my professors in their research during college.
What it does
It gives a remarkable and in-depth analysis of lab data using graphs.
How we built it
I used Google Collaboratory and my knowledge in coding.
Challenges we ran into
The inaccessibility of some functions from numpy which required more complex codes hence improvising.
Accomplishments that we're proud of
To be able to plot comparison graphs like bar charts, considering my beginner status in programming.
What we learned
I learned how to represent data in graph form.
What's next for Graph Plotting
To make the graphs more practical. Thus, apply this concept to blockchain and other financial ventures.
Built With
- googlecollab
- python


Log in or sign up for Devpost to join the conversation.