-
-
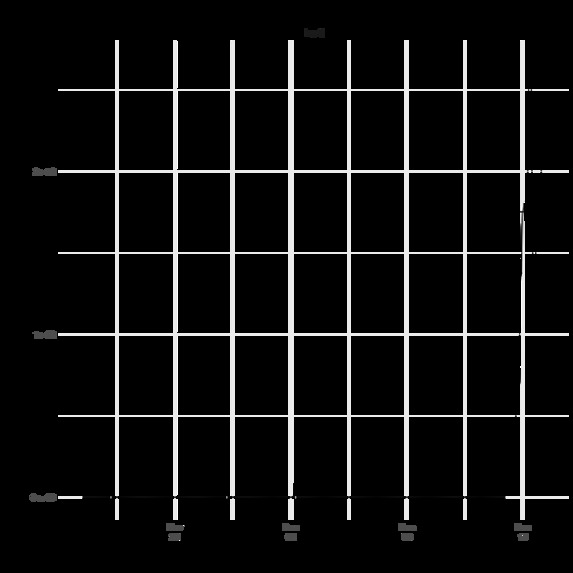
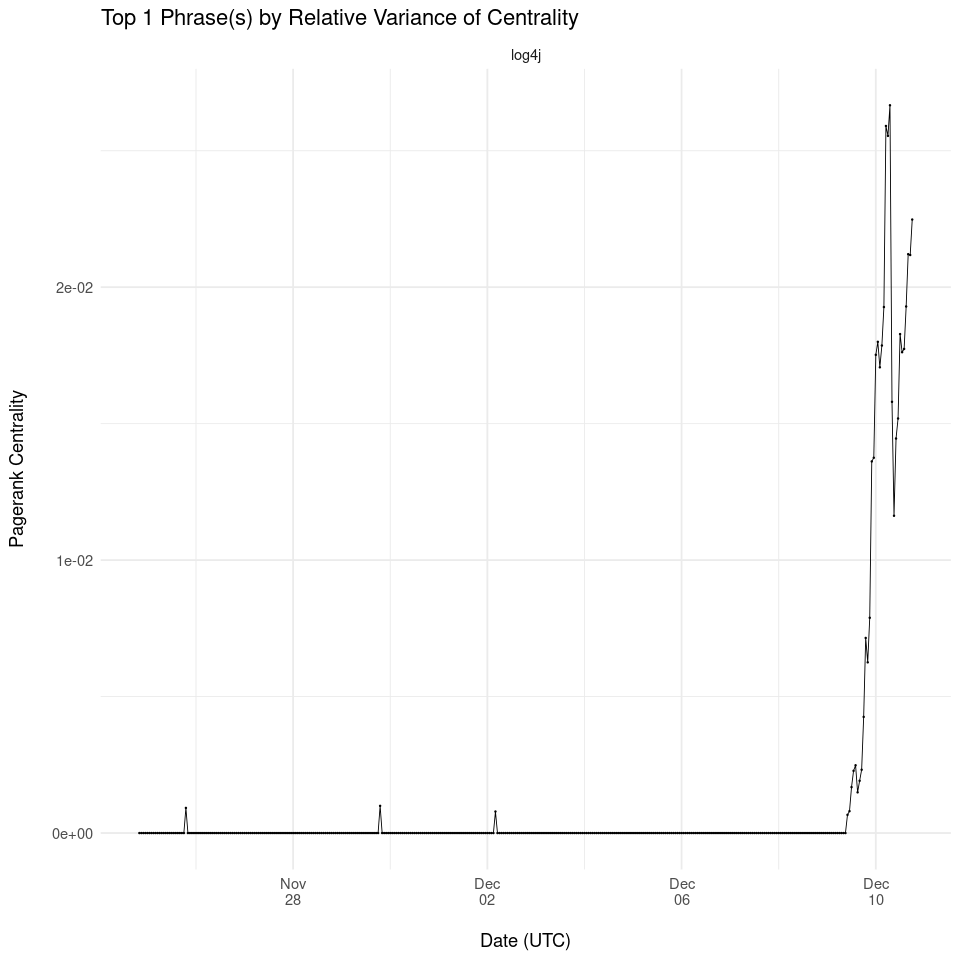
Top Word by Relative Variance
-
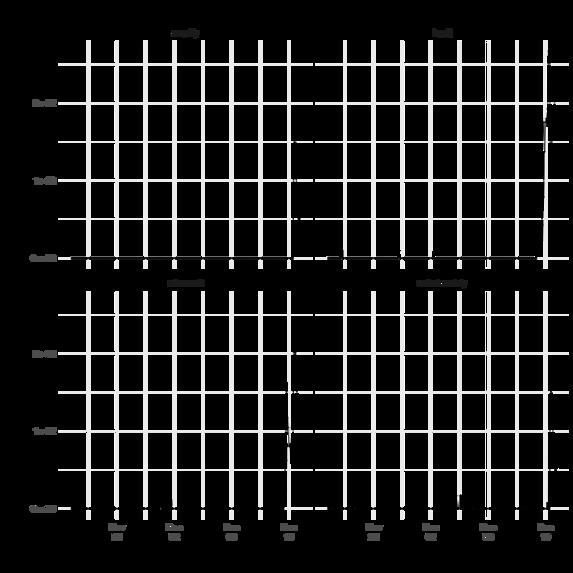
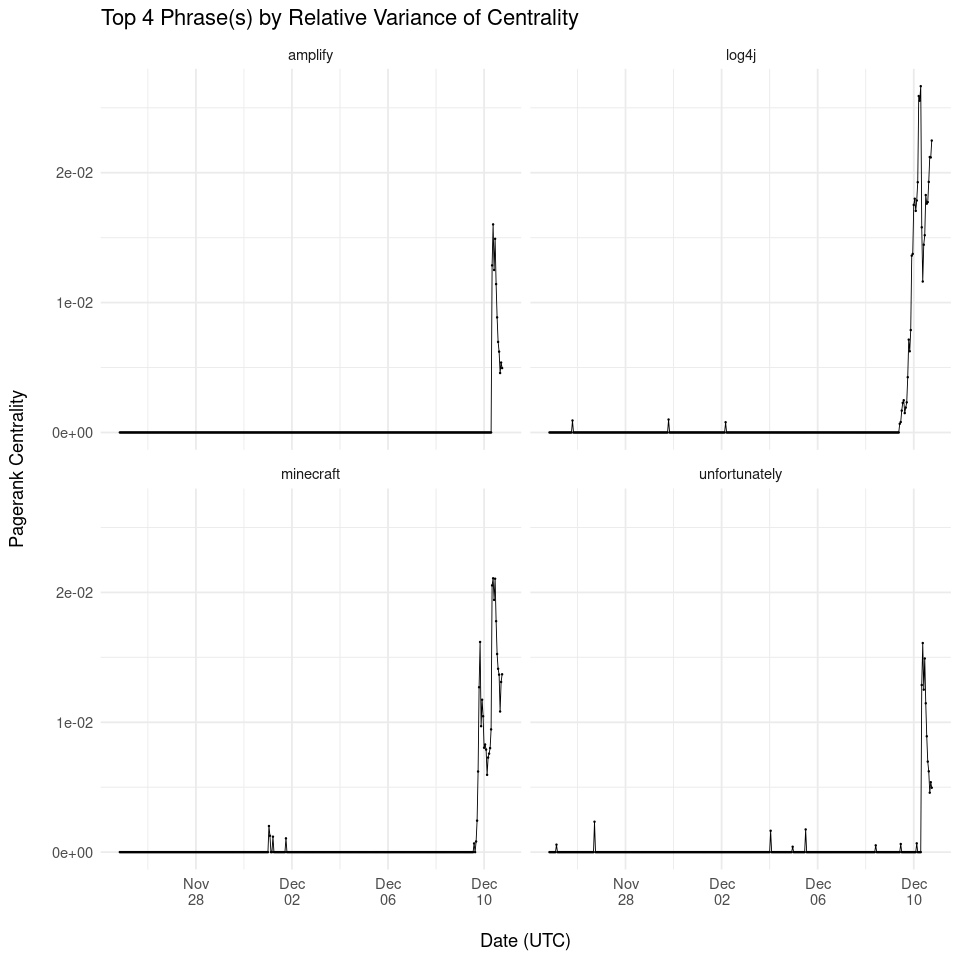
Top 4 Words by Relative Variance
-
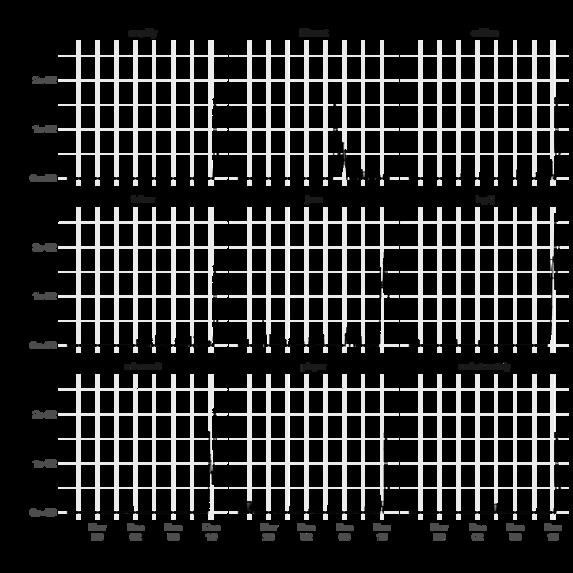
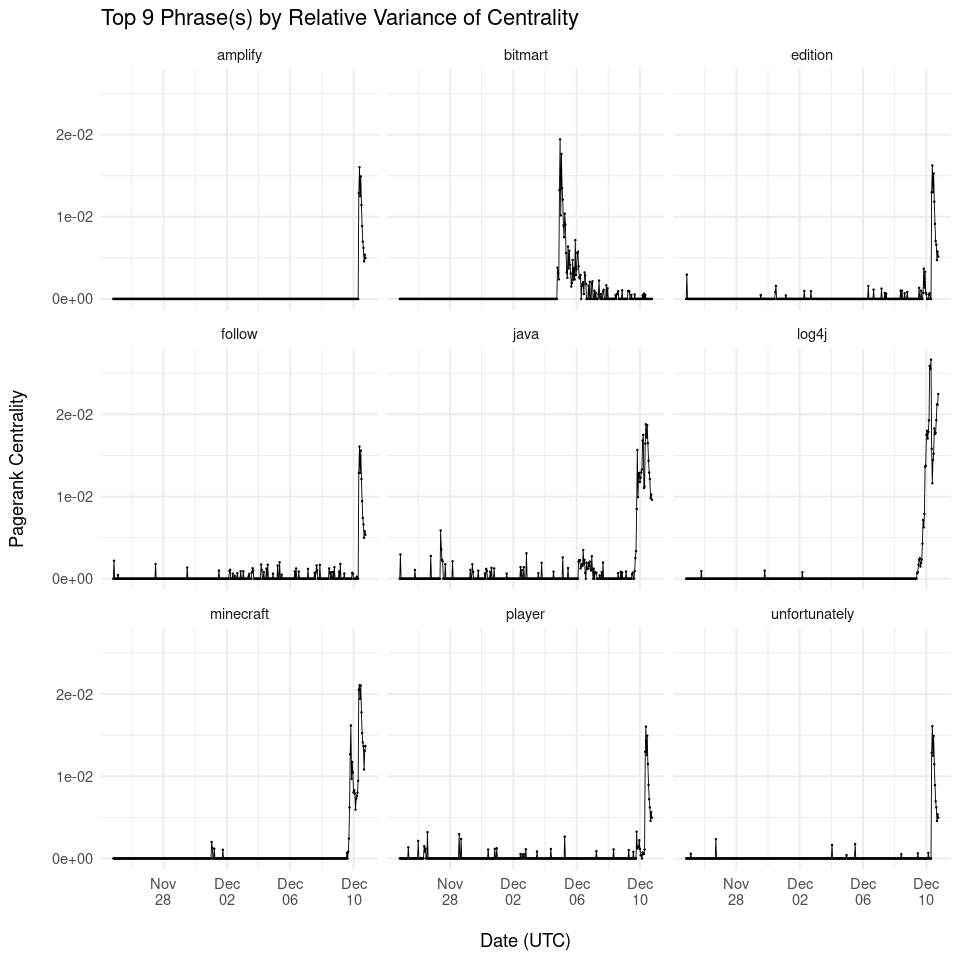
Top 9 Words by Relative Variance
-
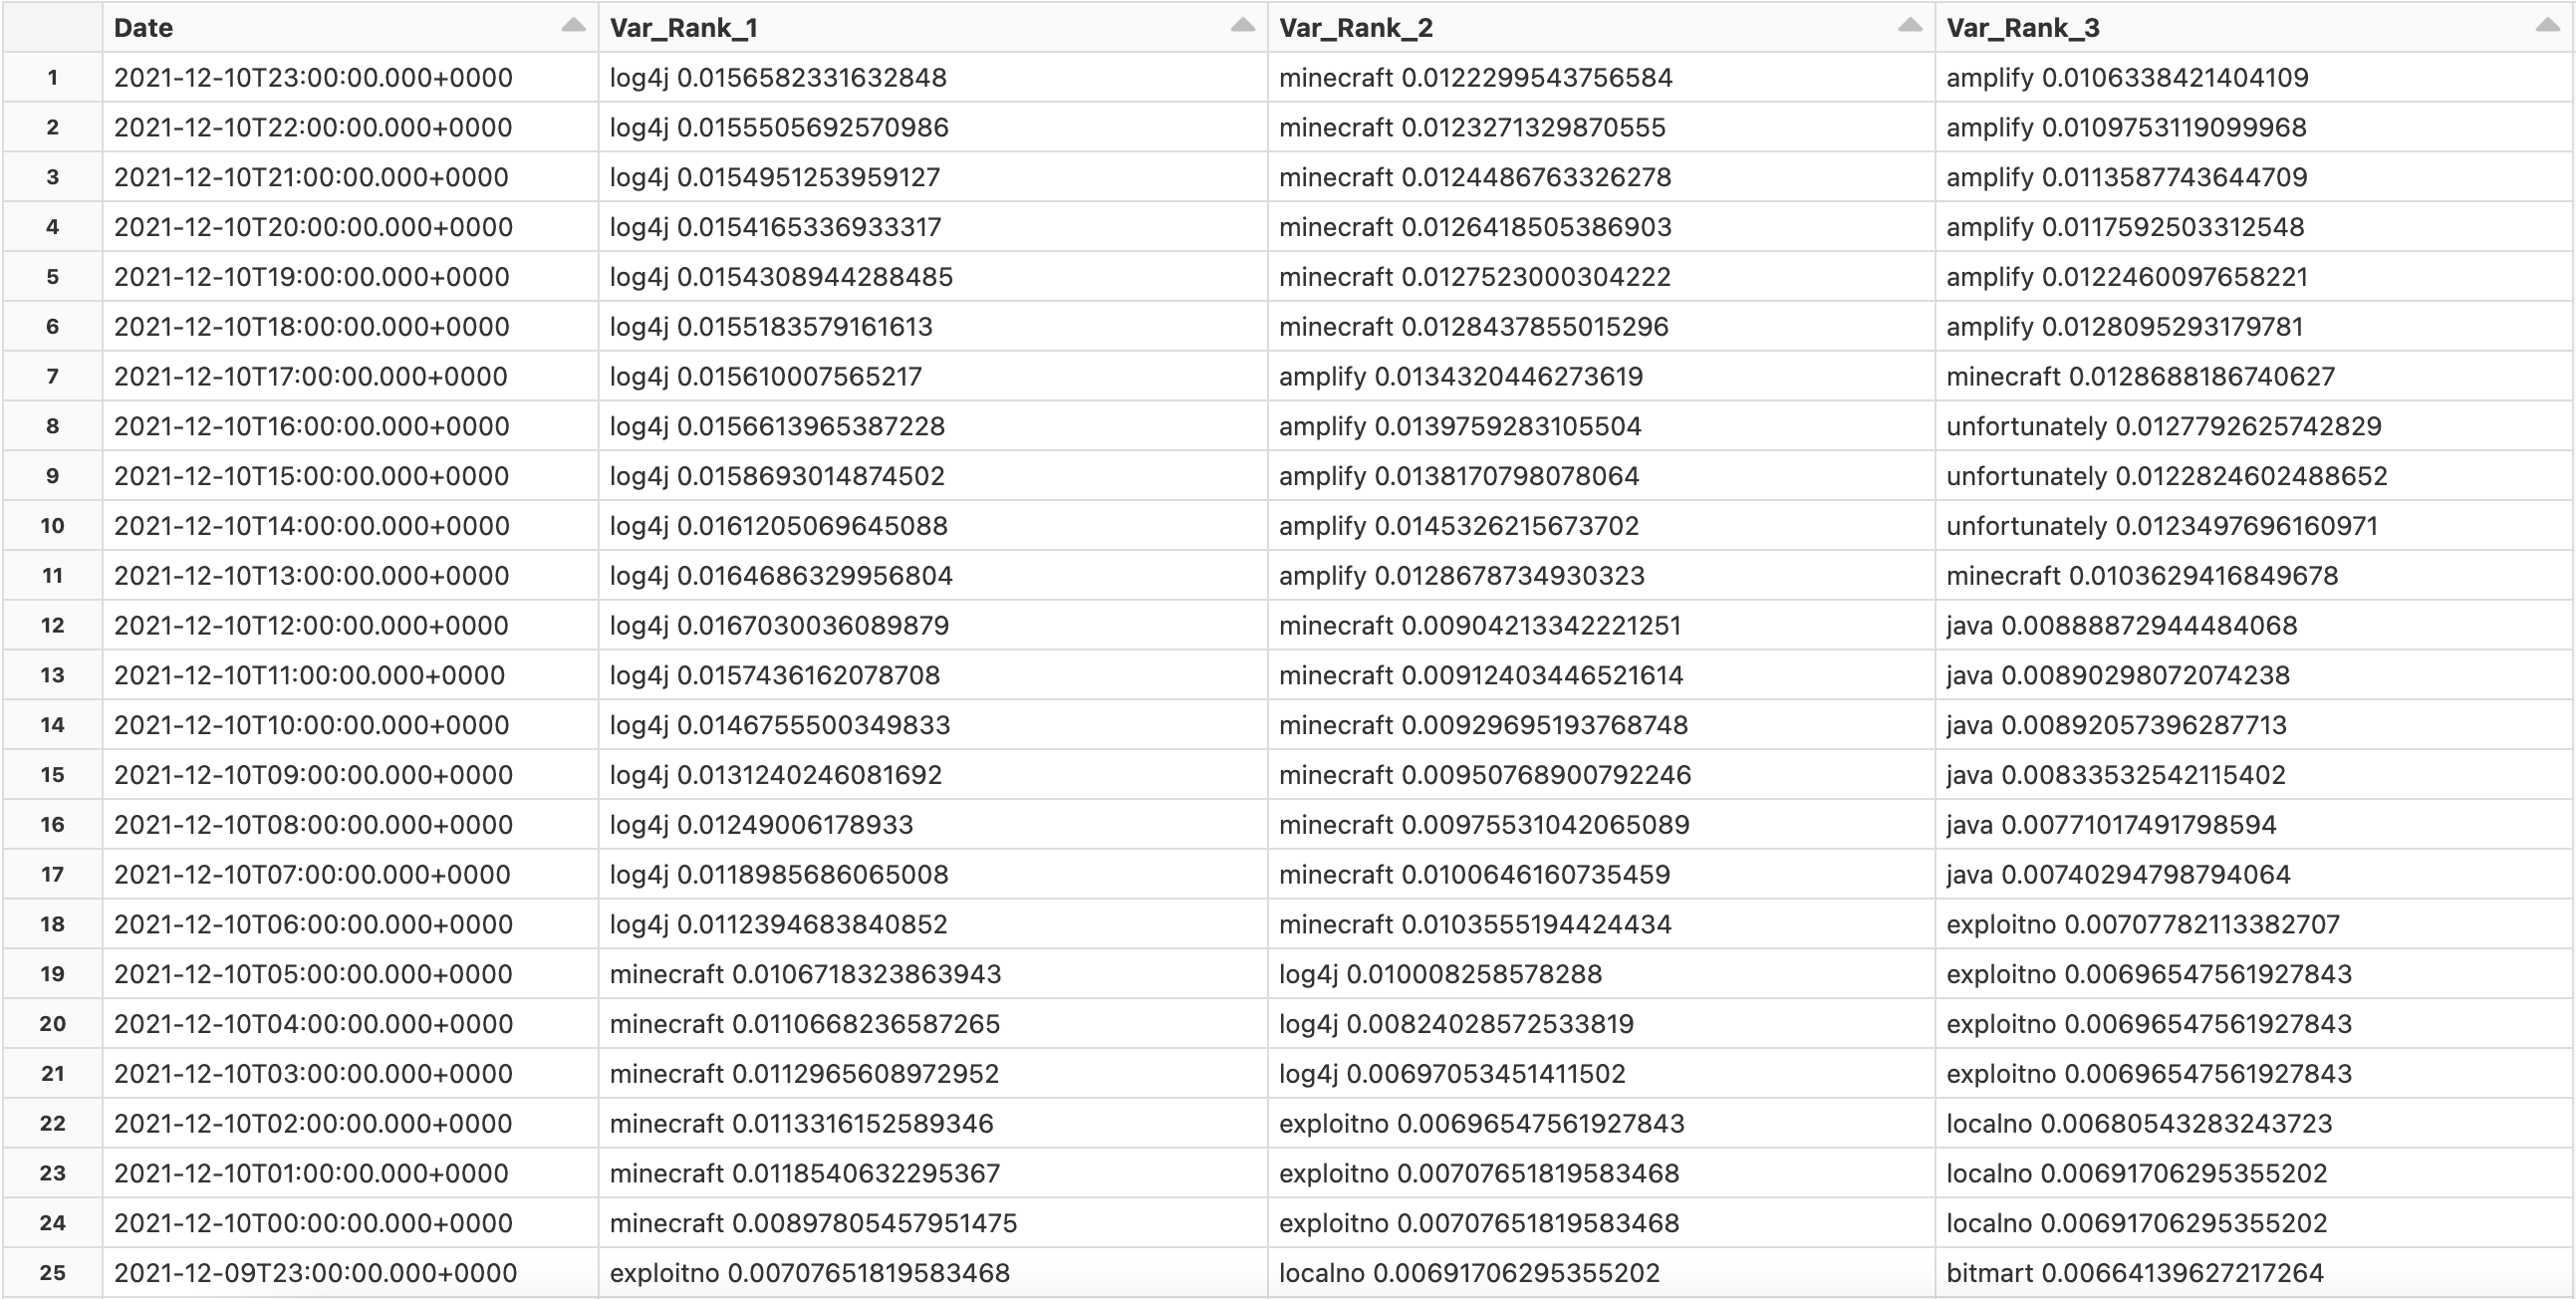
Rolling Window Results (UTC)
Inspiration
Global cybercrime damage is predicted to hit an annual $10.5 trillion by 2025. For organizations to mitigate this rise in cybercrime, the need for improved cybersecurity has never been greater. Cybersecurity is the practice of protecting critical systems and sensitive information from digital attacks.
A zero-day vulnerability is an unknown, in-the-wild exploit that exposes a vulnerability in software or hardware. Such vulnerabilities can create a myriad of problems long before the creator is made aware of their existence. The obscure nature of zero-day vulnerabilities means that combating them will always be reactive. Nevertheless, there is an urgent need to shorten the time between a vulnerability's initial discovery (often by a small group of good or bad people) and its broader announcement to the cybersecurity and defense communities for remediation.
On November 24th, 2021, Zhaojun Chen, a security engineer at Alibaba Cloud, was identified by Bloomberg News as the first person to discover the Log4j vulnerability and report it to Apache. The Apache Foundation confirmed this vulnerability and issued a public warning on December 9th, 15 days after the initial disclosure. On December 17th, China's Ministry of Industry and Information Technology (MIIT) claimed in a statement that it was only made aware of the flaw on December 9th, the same day that Apache published its formal announcement. Consequently, the MIIT decided to drop Alibaba Cloud from its cyber threat intelligence partnership for six months, citing the company's failure to report the bug to the government agency first.
There exists substantial controversy over Chen's approach and MIIT's reaction, or more generally the debate surrounding regulation of vulnerability disclosures by a political entity. Despite this, in cybersecurity two principles permanently hold true: (1) Hackers or bad actors set requirements for cybersecurity practices, and (2) Cybersecurity professionals prevent cybercrime by all means.
Going back to the events of the Log4j exploit, the cloud computing company stated it would work towards improving its risk management and regulatory compliance if they identify vulnerabilities in the future. To our understanding, added compliance precaution will only prolong the time between initial discovery and public announcement.
As data scientists in the cybersecurity domain, our mission is to utilize our knowledge and technical skillsets for a better cybersecurity posture. The need for accelerated awareness of zero-day vulnerabilities already exists today; going forward, it will only be exacerbated as additional compliance requirements threaten to slow the industry reaction.
We have not yet seen our colleagues leveraging big data, ML, and graph algorithms to call out zero-day vulnerabilities ahead of the traditional protocol. Despite this, we believe that a graph-based approach can help to expose vulnerabilities faster by analyzing specific trends as they circulate through social media.
What it does
We want to hack a new solution by using real world data and graph algorithms to explore what happened between November 24th and December 9th, 2021. Our goal is to find signals related to the Log4j vulnerability within the timeframe specified above. Given any success, we will make our tool open source and share it within the community, together improving cybersecurity by accelerating the industry-wide response to zero-day vulnerabilities.
How we built it
Our solution was built using a variety of commercial software, open-source programming languages, and publicly available data.
Starting with the last of these, the majority of our solution's data comes directly from Twitter. We queried historical Tweets from the social media company's publicly facing API endpoints. The Tweets spanned our timeframe of interest (November 24th and December 10th UTC, 2021) and contain the words "vulnerability" or "exploit". While these parameters help to reduce the size and scope of the Twitter data down to a workable subset, we found that many of the resulting Tweets met the specified criteria without being related to cybersecurity and/or zero-day vulnerabilities.
To further limit the number of Tweets and filter out unrelated content, we turned to a pre-trained BERT model distributed by Hugging Face. Incorporating BERT provided a robust way to use contextual clues for determining if a given Tweet is cybersecurity-related. We started with a base, uncased version of BERT before fine-tuning it on manually classified Tweets from four disparate timeframes prior to the Log4j incident. We labelled these training Tweets with a binary classification system, where a 0 indicates a given Tweet was unrelated to cybersecurity and a 1 indicates a Tweet is indeed related to cybersecurity. While different training timeframes were used to expose our model to a variety of "trending" topics, the Tweets themselves were derived from the original query (contains "vulnerability" or "exploit") and underwent the same pre-processing steps. The finalized model was subsequently applied to Tweets from our November-December timeframe of interest, retaining only those with a positive prediction (i.e. being related to cybersecurity and/or zero-day vulnerabilities).
Having obtained a reduced subset of cybersecurity-related Tweets, we applied a series of transformations to coerce the data into a graph-friendly schema. Most importantly, individual words were extracted from each Tweet alongside that Tweet's identifier (ID). We then used a self-inner-join on the Tweet ID to create additional rows for each word-to-word occurrence within a Tweet. This relationship became the foundation for our graph, where vertices represent individual words and edges represent co-occurrence in a shared Tweet. Additional steps, such as filtering out English stop-words and keywords from the query itself (vulnerability and exploit), worked to reduce the overall connectivity of the graph and thus strengthen the signals of interest.
With our Twitter data now in a workable format, we turned to our commercial software, TigerGraph, for further analysis. Chief among TigerGraph's offerings, we leveraged the graph database capabilities and data science library to run our analytics. Working from Graph Studio, we defined a schema, set up data-mappings, and loaded in our edges and vertices. Next, we then began developing a modified version of TigerGraph's weighted Pagerank algorithm based on their open-source code from GitHub. These changes used multiple-hop patterns to allow for Pagerank calculation on a given subgraph, specifically a subgraph formed by an input date-time parameter. After writing and installing our query via Graph Studio, we pivoted to PyTigerGraph for integration with Python. Our script ran the query at the hour mark, capturing each node's Pagerank centrality at every given time interval. The time-series information was then loaded into a single data frame and saved for post-processing.
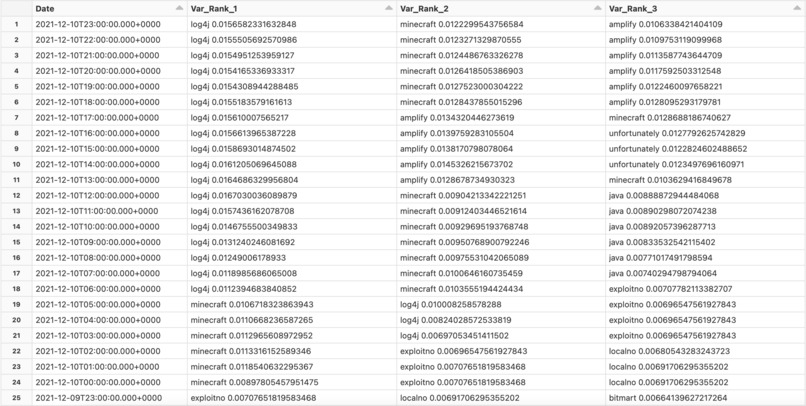
Our solution's post-processing is geared towards detecting changes in each node's Pagerank centrality over time. The rationale behind this approach is that new words (or words with a typically low centrality) that undergo a substantial spike could be related to trending exploits or vulnerabilities. To achieve this detection mechanism, we calculate the relative variance of each word on a 7-day rolling window. Relative variance is defined as the variance divided by the mean, which gives more weight to words with low average centrality but a high variance in centrality. The rolling window performs this calculation for each word/vertex, at each time interval. The words with the highest centrality can then be identified and extracted for review.
Results
Transitioning to our results, we were first able to detect the phrase “Log4j” as the word with the single highest relative variance on December 10th at 6:00 AM UTC (December 9th at 11:00 PM PT). “Log4j” remained as the number one word until the conclusion of our analysis, 17 hours later at 11:00 PM UTC. Prior to it becoming the number one phrase at 6:00 AM UTC, “Log4j” was the word with the second highest relative variance for three hours (3:00 - 6:00 AM UTC). While this timeframe is shortly after the Apache Software Foundation's original announcement on December 9th, it exposes the exploit ahead of any guidance from CISA and NVD's CVE publication on December 10th. Our work shows that such topics are picked up fairly quickly on Twitter, and thus afford the possibility of detection without delay.
Challenges we ran into
Our team encountered three major challenges while working on this project. The first, and easiest to overcome was adapting our graph schema to align with Tigergraph's support for a single edge between any two vertices. The graph solution we had in mind required multiple edges between nodes, each being associated with a given date-time. Our team bypassed this obstacle by creating an additional "dummy" vertex that represents what we initially called an edge. This dummy vertex housed information such as the date and weight of the original edge. Tigergraph's multiple-hop pattern matching enabled us to circumvent this issue quickly and accurately, updating the Pagerank algorithm accordingly.
Second, we encountered substantial noise in our graph resulting from common words associated with cybersecurity-related Tweets, but unrelated to specific zero-day exploits. While there is no work-around for this issue included in the current iteration of our solution, we mention some possible options for improvement in the sections below.
Lastly, the third and most significant challenge we faced was a lack of Log4j related signals in the data itself. Prior to December 9th, our query captured only three Tweets with a mention of the phrase "Log4j". This highlights the limitations of a generalized query to Twitter's API endpoint, in that not every Tweet about a zero-day vulnerability will explicitly use the phrase "vulnerability" or "exploit".
Accomplishments that we're proud of
Our team is proud of creating an end-to-end solution for gauging the relative importance of cybersecurity-related terms, and for calling out those that are currently trending. Throughout each step of the solution-building process we maintained a naïve approach to detection, equipping ourselves only with knowledge that was widely available at the time of the incident itself. While we were unable to discover mentions of the "Log4j" exploit ahead of Apache's guidance, our solution accurately depicts the size and scope of the vulnerability in the following days. This information is valuable in and of itself, as it informs the level of response organizations require to protect themselves.
What we learned
Participating in this hackathon was instrumental for strengthening our current skillsets, developing familiarity with new technologies, and applying our domain knowledge to a solution that we can continue to improve. API calls, natural language processing, graph algorithms and traditional statistics all played a substantial role in our finalized submission, and we are walking away from this competition with far greater competencies for every one of these concepts.
What's next for Graph for better cybersecurity
There are three primary areas of improvement that we are interested in pursuing. First, we believe that a similar solution could be applied to new data sources. The apparent lack of Log4j-related signals in the early days of our Twitter data could (in part) be alleviated by bringing in additional data. Reddit posts and GitHub repository comments stand out as two publicly available sources offering content that could lend itself to early detection.
Another area of future improvement is adding an additional modeling layer. Applying named entity recognition (NER) or part of speech (POS) extraction could further reduce the amount of noise present in our graph, thus making it easier to call out the relevant signals.
Finally, we believe that a more sophisticated time-series algorithm would yield better results for our post-processing detection method. The current approach applies relative variance on a rolling window, selecting the top n words at any given interval. By fitting an ARIMA model to the data instead, we could use confidence intervals and forecasting to detect future anomalies while accounting for potential autocorrelation within a given word.

Log in or sign up for Devpost to join the conversation.