-
-

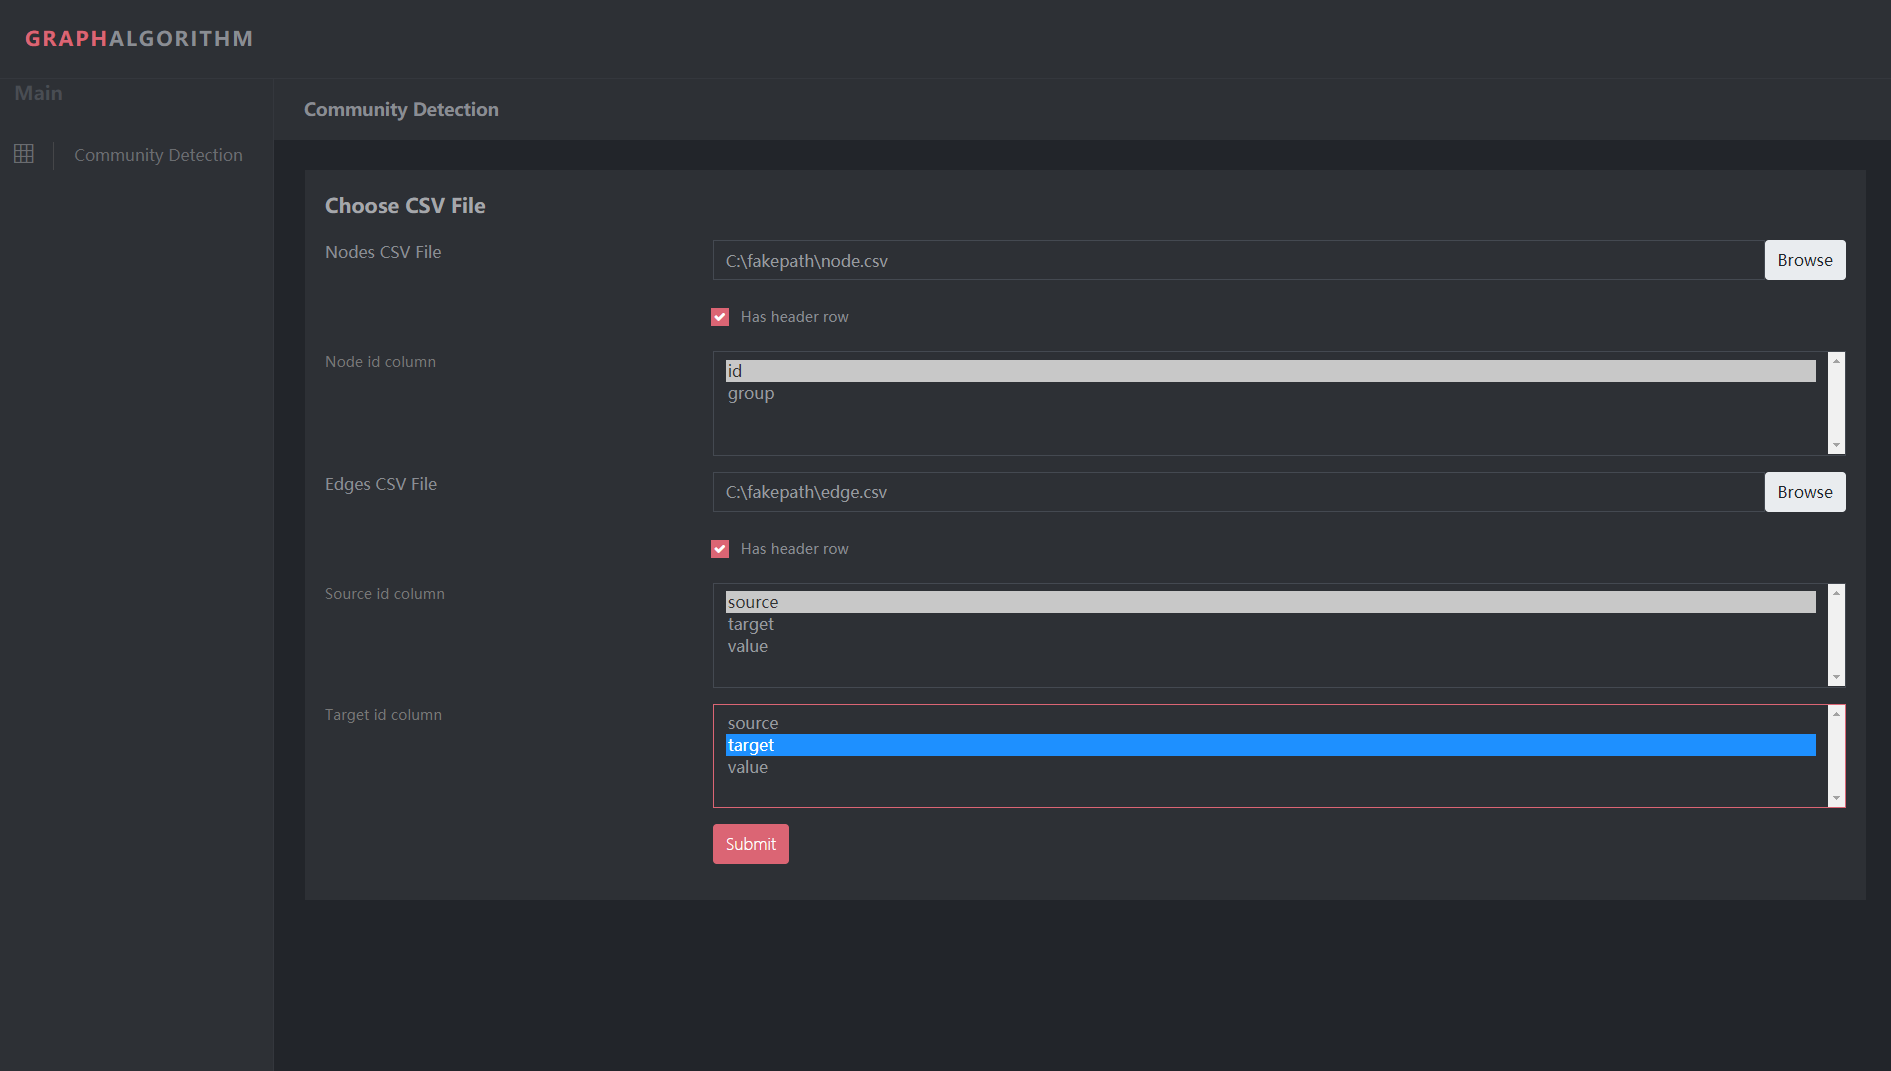
CSV File Upload Interface
-

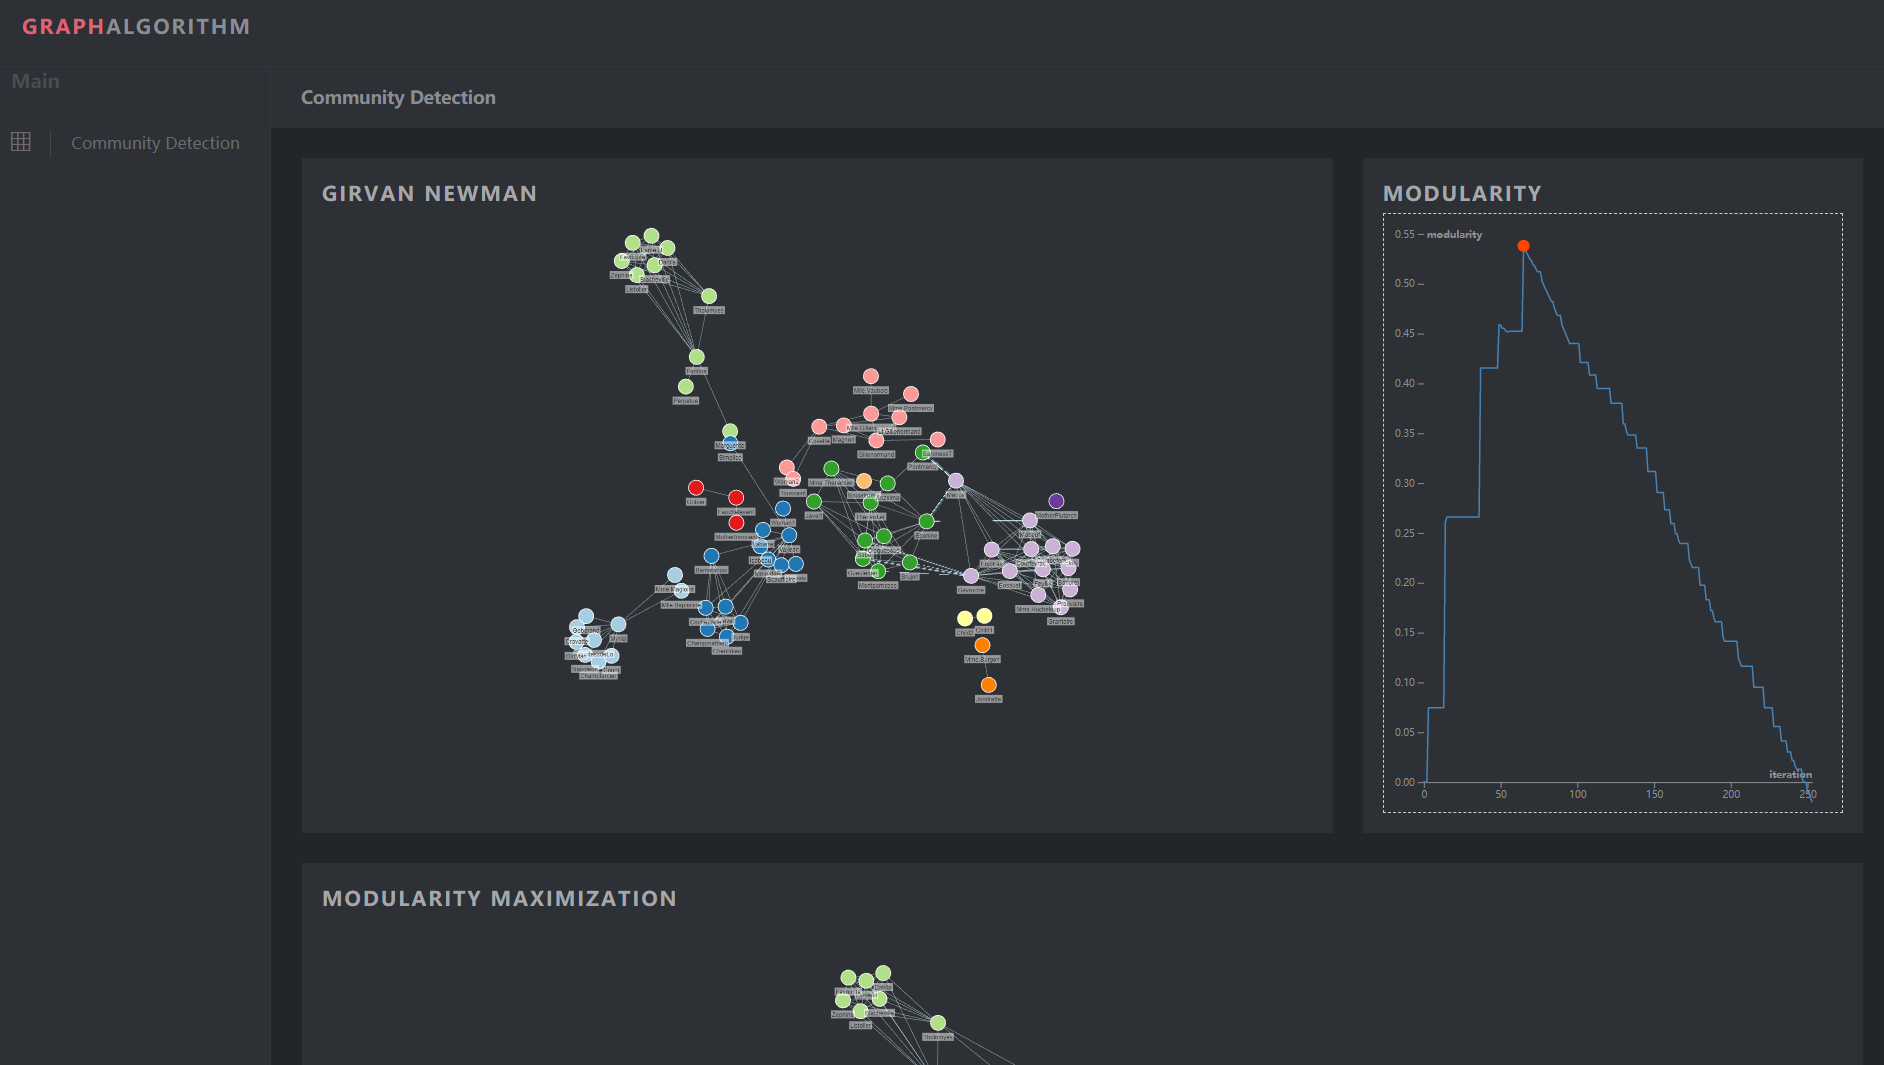
Result Dashboard
Inspiration
Recently we are doing some projects in the field of auto-insurance fraud detection. The behavior of insurance fraud is usually performed by a cluster of people. As we all know, community detection is one of the most important kind of graph algorithms that can be applied in this scenario. To get a full understanding of how community detection algorithm works and performance comparison between different types community detection algorithms, we develop this visualization tool.
What it does
With our visualizaton tool, you can upload your own csv files to define a graph structure. By clicking the submit button, you can see the each-step results of Girvan-Newman algorithm and modularity variation. Furthermore, the final results of other kinds of community detection algorithm such as Louvain are also illustrated below.
How we built it
Our project consists of two main parts: 1) back-end computation unit 2) front-end visualization UI interface. The first part is built with networkx python library and the second part is built with angular and d3 library.
Challenges we ran into
The main challenge that we have encountered is to find a proper way to demonstrate the computation process of community detection.
What we learned
We have become proficient with networkx, angular and d3 libraries and learned that collaboration is the key element for a team to overcome difficulties.
What's next for Community Detection Visualization Tool
Next we will extend our visualization tool to include more types of graph algorithms such as PageRank and add some functionality to interact with Neo4j in a better way.


Log in or sign up for Devpost to join the conversation.