-
-

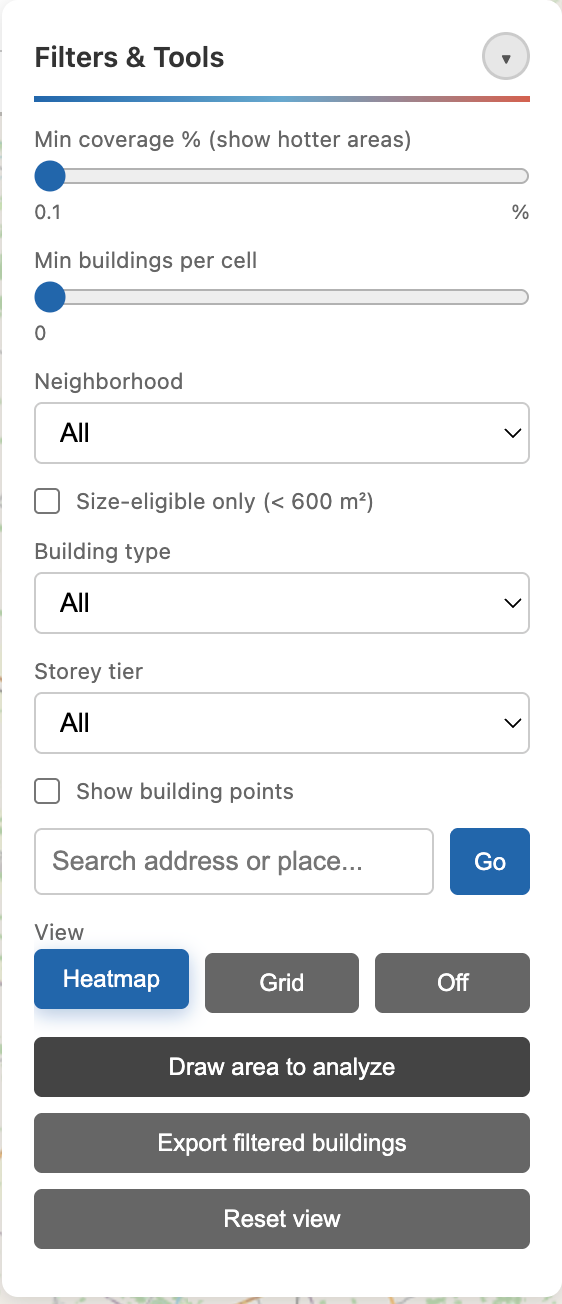
Filter Panel
-
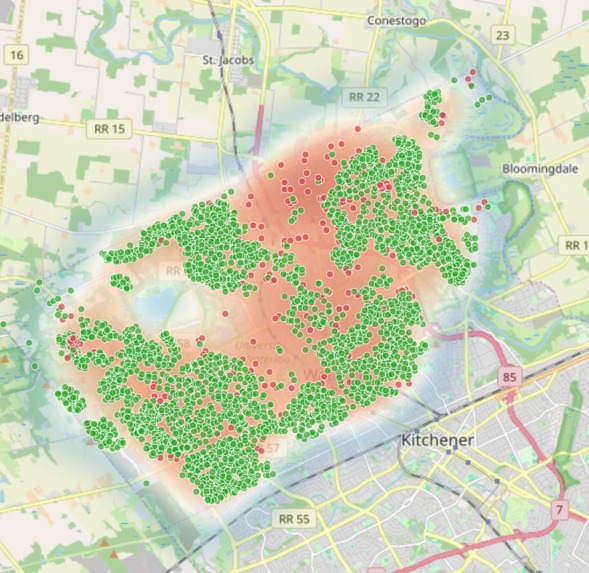
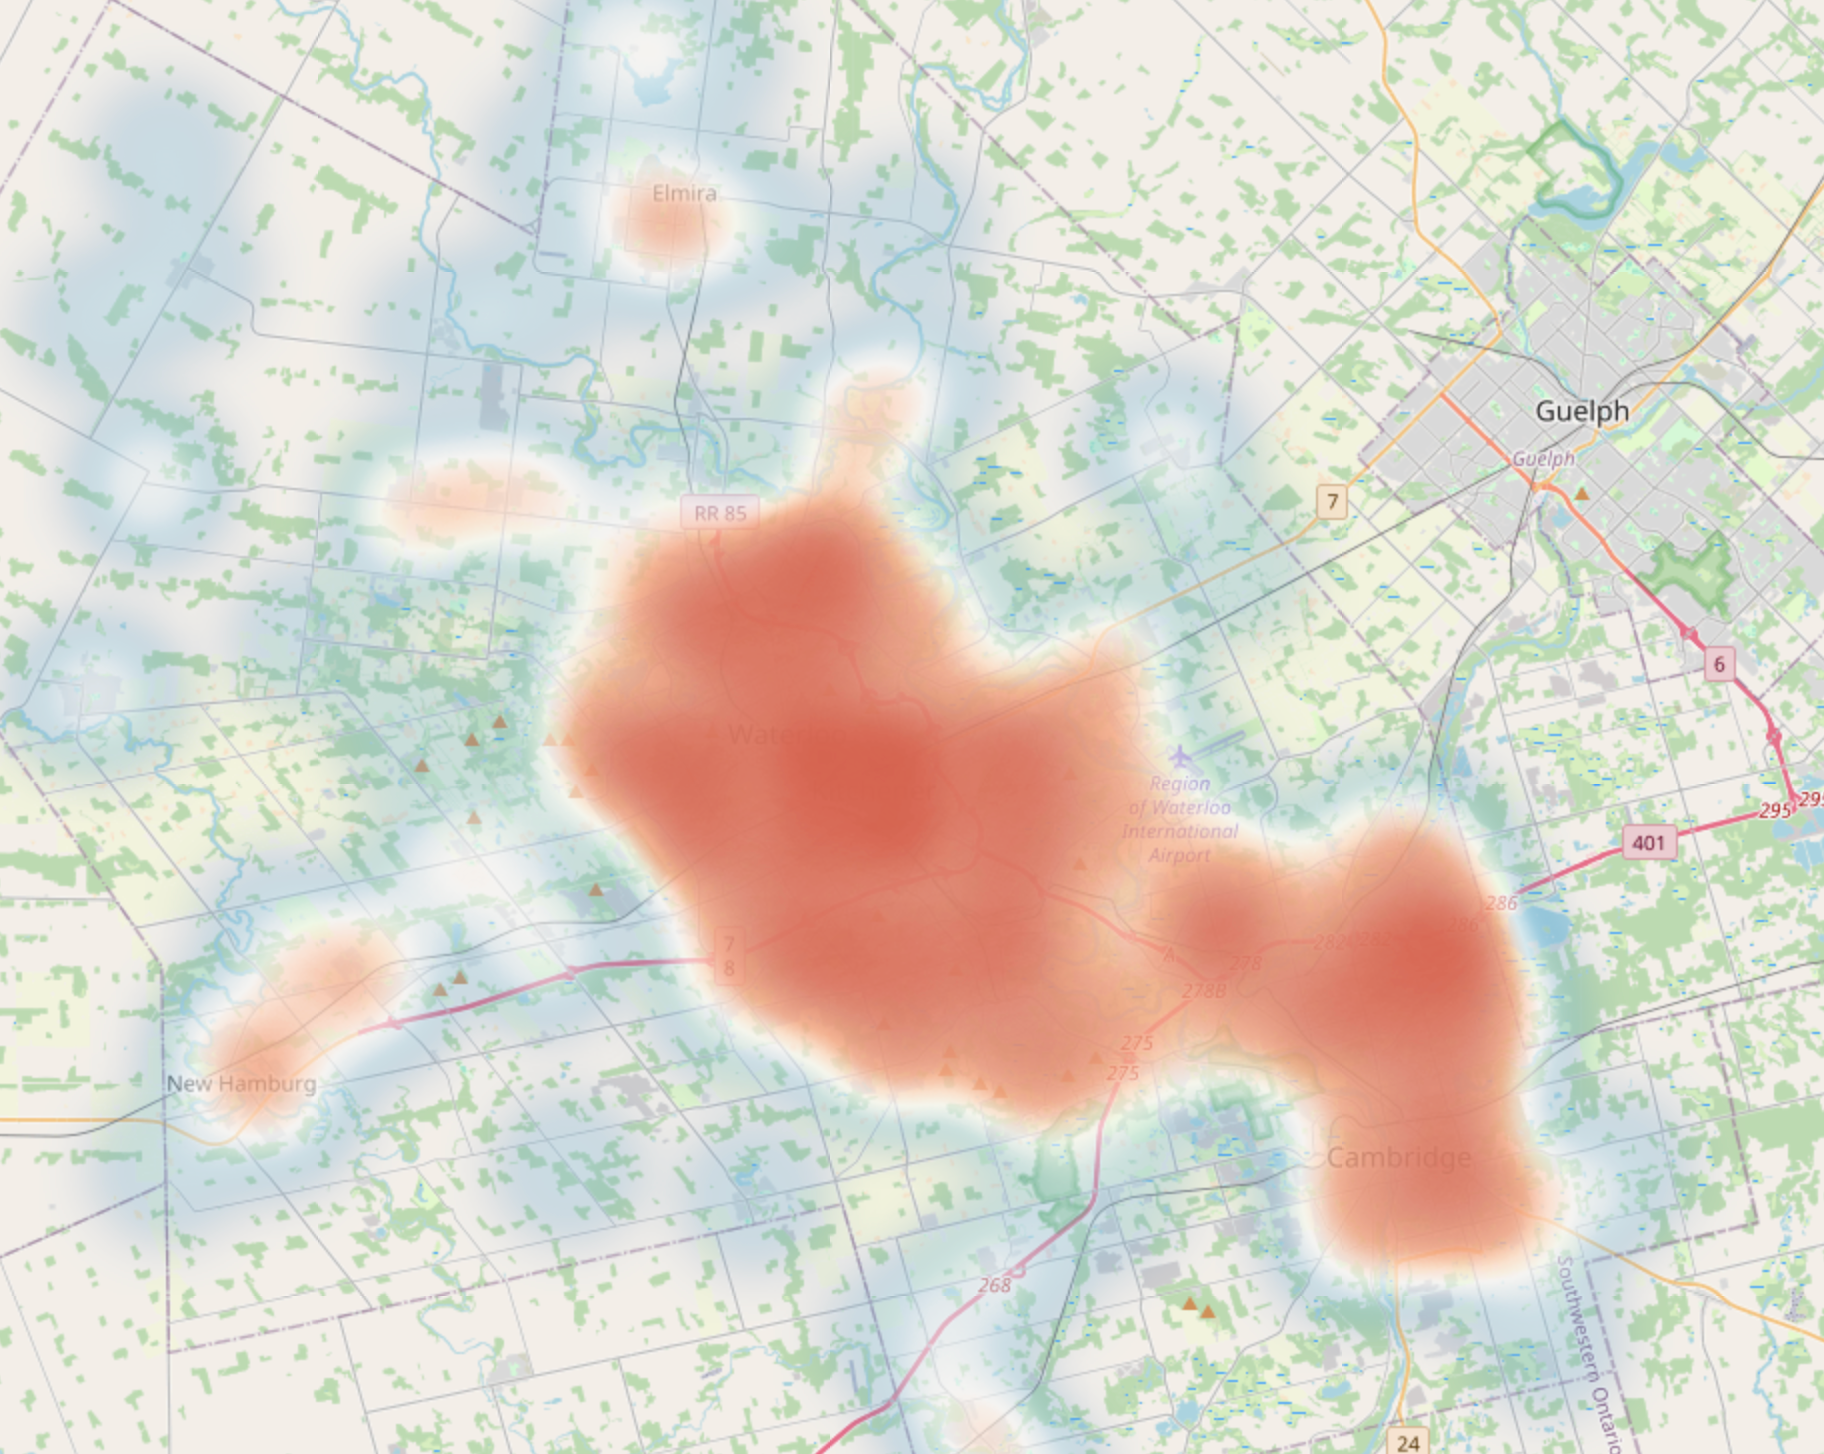
Heatmap with buildings
-
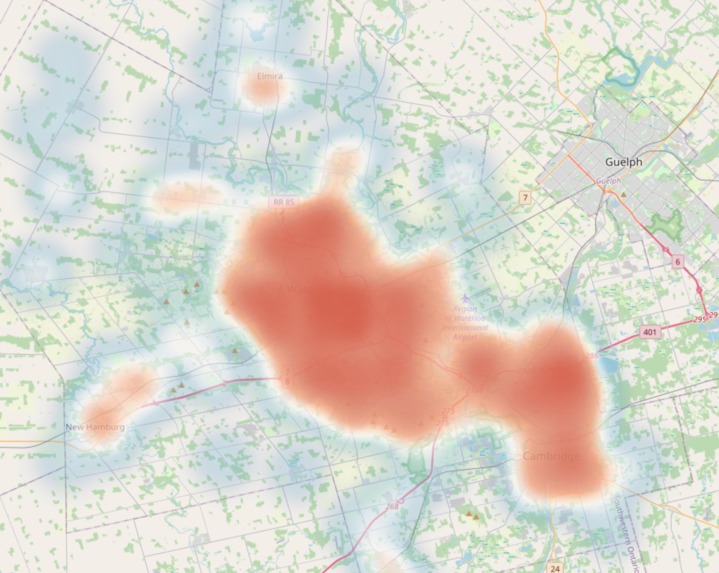
Heat Map

Inspiration
Municipal agencies across Canada have billions in retrofit and environmental grant funding (programs like Canada Greener Homes, IESO incentives, and provincial green building initiatives) but no efficient way to figure out where that money should go. Grant targeting today relies on manual site surveys, disconnected spreadsheets, and institutional guesswork. The result: funding goes underutilized and the neighborhoods that need retrofits most get overlooked. We wanted to build a tool that flips that equation so that grant money finds the right buildings, not the other way around.
What it does
Our platform transforms raw building footprint data into an actionable intelligence layer that helps agencies deploy retrofit grant funding with surgical precision. It ingests over 202,000 building geometries across the Waterloo Region, enriches each one with structural metrics such assquare footage, storey count, surface-to-volu me ratio, compactness score,... and classifies them against real grant eligibility thresholds.
The result is a live, interactive heat map that reveals urban heat island intensity at a glance. Zoom in and the view seamlessly transitions to a high-resolution grid where every cell is scored by building density, coverage percentage, and retrofit priority. Powerful filters let users slice the entire building stock by type, size eligibility, storey tier, and neighborhood, instantly surfacing the clusters of buildings where grant dollars would have the greatest impact.
But the real differentiator is the AI-powered Grant Targeting Advisor embedded directly in the map. It's not a chatbot that just answers questions, it controls the interface. Ask "Where are the most grant-eligible residential buildings?" and the AI highlights the settlement, zooms the map, activates building points, and applies the right filters, all in a single response through parallel tool calling. Agency staff can go from a vague policy question to a fully filtered, map-driven answer without touching a single control.
The platform also supports freeform area analysis (draw a polygon to get aggregate stats), one-click CSV export of filtered building lists, address geocoding scoped to the Waterloo Region, and neighborhood-level priority rankings that compare settlements head-to-head on density, eligibility rates, and composite retrofit scores.
Everything runs from a lightweight local stack - no cloud infrastructure required - making it deployable in any municipality that has building footprint data.
How we built it
Data pipeline (Python): Ontario Building Footprints GeoJSON -> enriched with storeys, building type, total square footage, SVR proxy, and compactness scores. Grid cells computed with building coverage density. Neighborhood-level priority scoring aggregated from per-cell metrics.
Frontend (Vanilla JS + Leaflet): Heatmap (leaflet.heat) for overview, GeoJSON grid for detail, with automatic view switching at zoom level 13 for better viewability as heatmap on a zoomed-in scale does not work great. Custom color scale with gamma correction to spread warm colors across the actual data distribution. Collapsible filter panel, toast notifications, geocoder search, and CSS animations throughout.
AI Chatbot (FastAPI + Backboard.io + GPT-4o): The assistant has four tools:
highlight_settlement,zoom_to_settlement,show_building_points, andapply_filters. It can call multiple tools in parallel in a single response.
Challenges we ran into
- Idea formulation: We spent a lot of time formulating what idea we would go with as all of us have different interests and passions.
- Color scale calibration: Building coverage data is heavily right-skewed (most cells under 5%, a few outliers near 55%). A linear color scale made everything look blue. We solved this with a gamma power curve (γ=0.30) that spreads warm colors across the real data range.
- LLM tool-call reliability: GPT-4o sometimes calls
show_building_pointsbut forgetsapply_filters, leaving all buildings visible instead of just eligible ones. We added server-side deterministic injection that detects the user's intent from keywords and auto-appends the missing action. - Thread corruption: When a chat request times out mid-tool-call, the conversation thread gets stuck with dangling tool calls that OpenAI's API rejects. We built auto-recovery that detects corrupted threads and transparently creates a new one.
Accomplishments that we're proud of
- The chatbot doesn't just talk about the map, instead it controls it. Asking a natural language question produces real map actions, making the tool accessible to non-technical agency staff.
- The entire data pipeline runs locally from raw GeoJSON to a fully interactive map in under a minute.
- A polished, animated UI that feels like a real product - collapsible panels, spring animations, loading states, styled tooltips - built in a hackathon timeframe.
What's next?
- Multi-program eligibility matching: map each building against multiple grant programs simultaneously and surface the best-fit funding options.
- Direct grant application links: one-click from a building on the map to the relevant program's application portal.
- Scale to other municipalities: the pipeline is data-source agnostic; any city with building footprints can be onboarded.
- Exportable reports: generate PDF summaries for agency grant proposals with maps, stats, and building lists included.
Built With
- backboard.io
- fastapi
- javascript
- leaflet.js
- python
- react

Log in or sign up for Devpost to join the conversation.