Inspiration
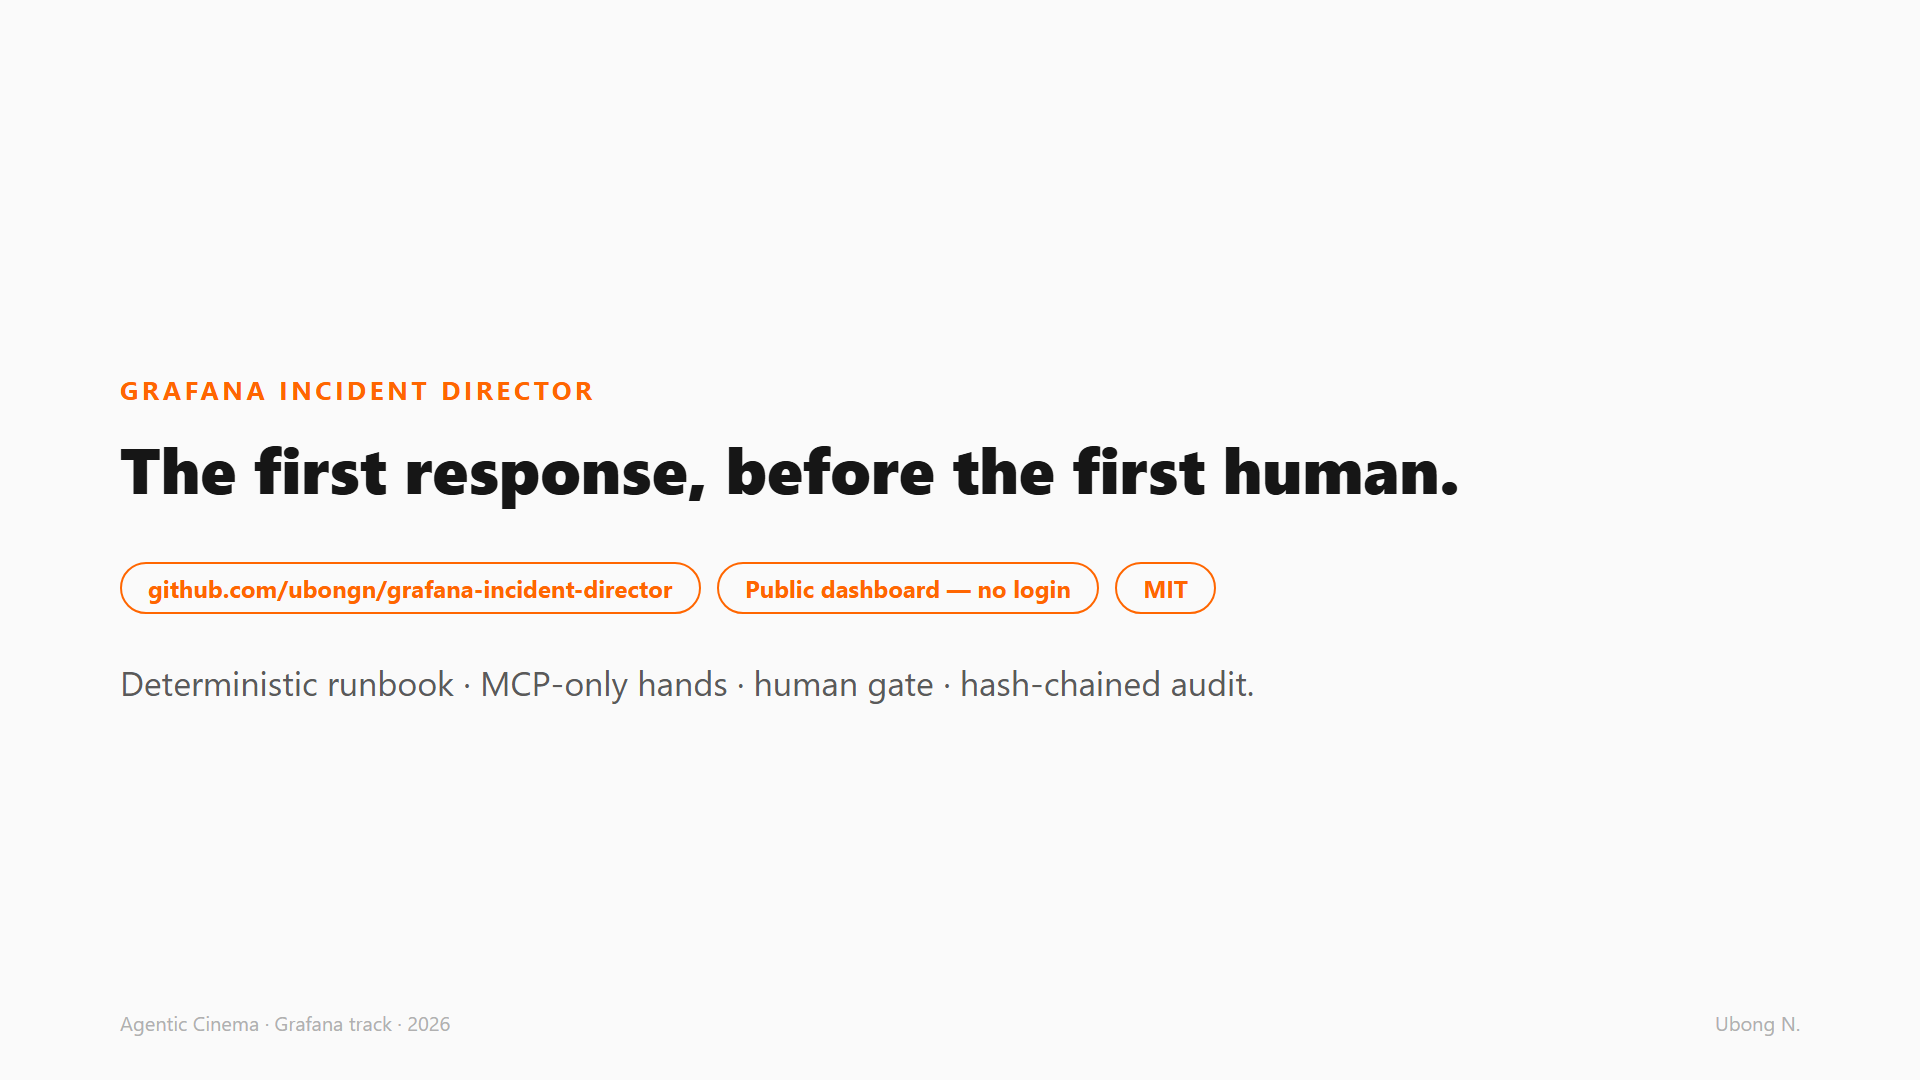
When an SLO burns at 2 a.m., a human opens fifteen tabs and starts guessing. Every Grafana-using SRE team already has the telemetry — what they lack at 3 a.m. is a directed first response. We built Grafana Incident Director to run that whole first-response loop inside the Grafana stack: detect, triangulate, diagnose, remediate, report — and stop at a human-approval gate.
What it does
An autonomous five-phase runbook agent — not a chat loop:
- Detect — reads the live alert state and isolates the one firing SLO rule (4.56 s).
- Triangulate — pulls the dashboard's own PromQL and scopes the blast radius live: cdn-fra1 at 1620 ms p95, 5xx at 3.75%, eu-west playback errors elevated — every other region normal (13.67 s).
- Diagnose — grounds root cause in Loki logs: upstream fetch timeouts cascading into 504s at that exact edge, confidence 0.9 (15.52 s).
- Remediate — proposes a surgical fix (
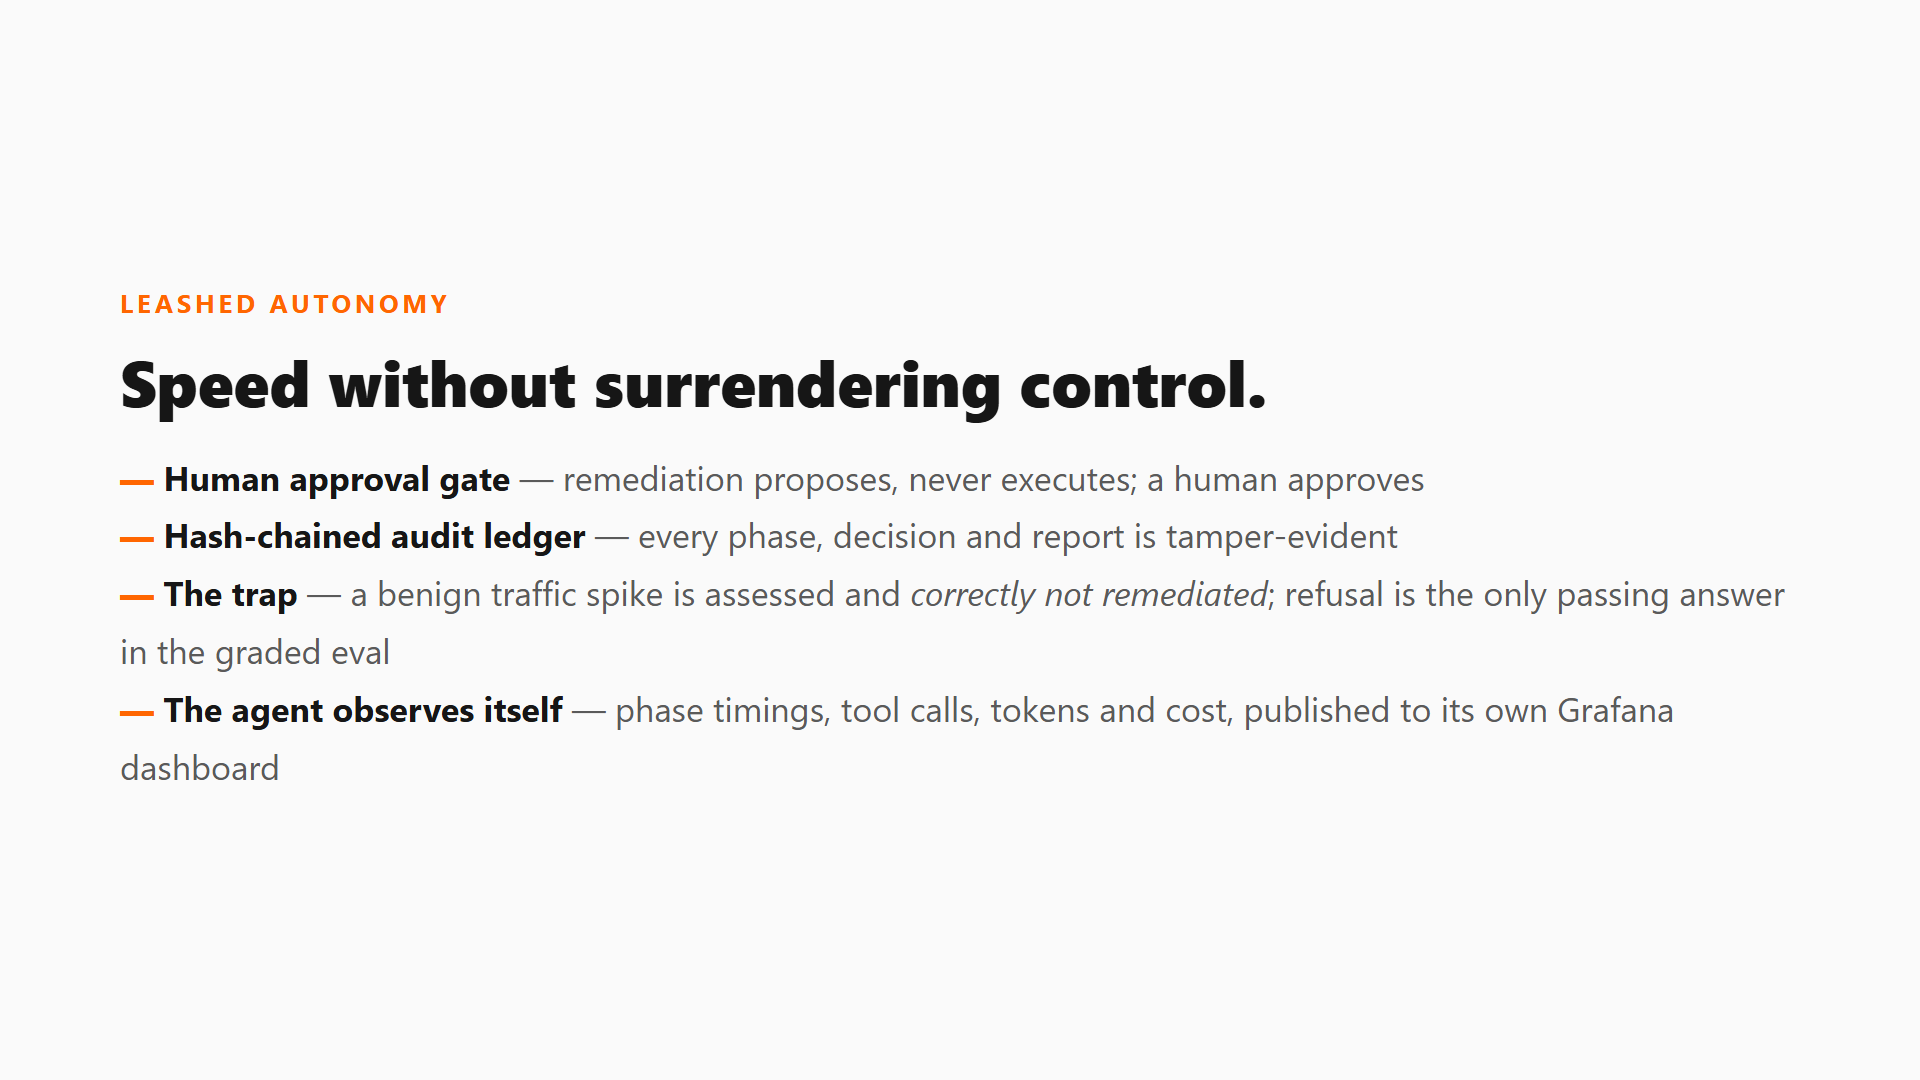
drain_cdn_edge, with explicit effect, risk and rollback). Zero tool calls by design: proposing is not executing (3.62 s). - Gate — the framework-enforced approval gate refuses: unattended runs never touch production. A human approves, or nothing happens.
- Report — writes the incident back into Grafana as a dashboard annotation, runs a verification query, and records an honest post-state: "latency still ~2,025 ms — remediation denied" (8.41 s).
≈46 seconds, alert to report, every phase first-attempt — and the agent still never touched production. Fast, and leashed.
How we built it
- Google ADK + Gemini 2.5 Flash on Vertex AI — one
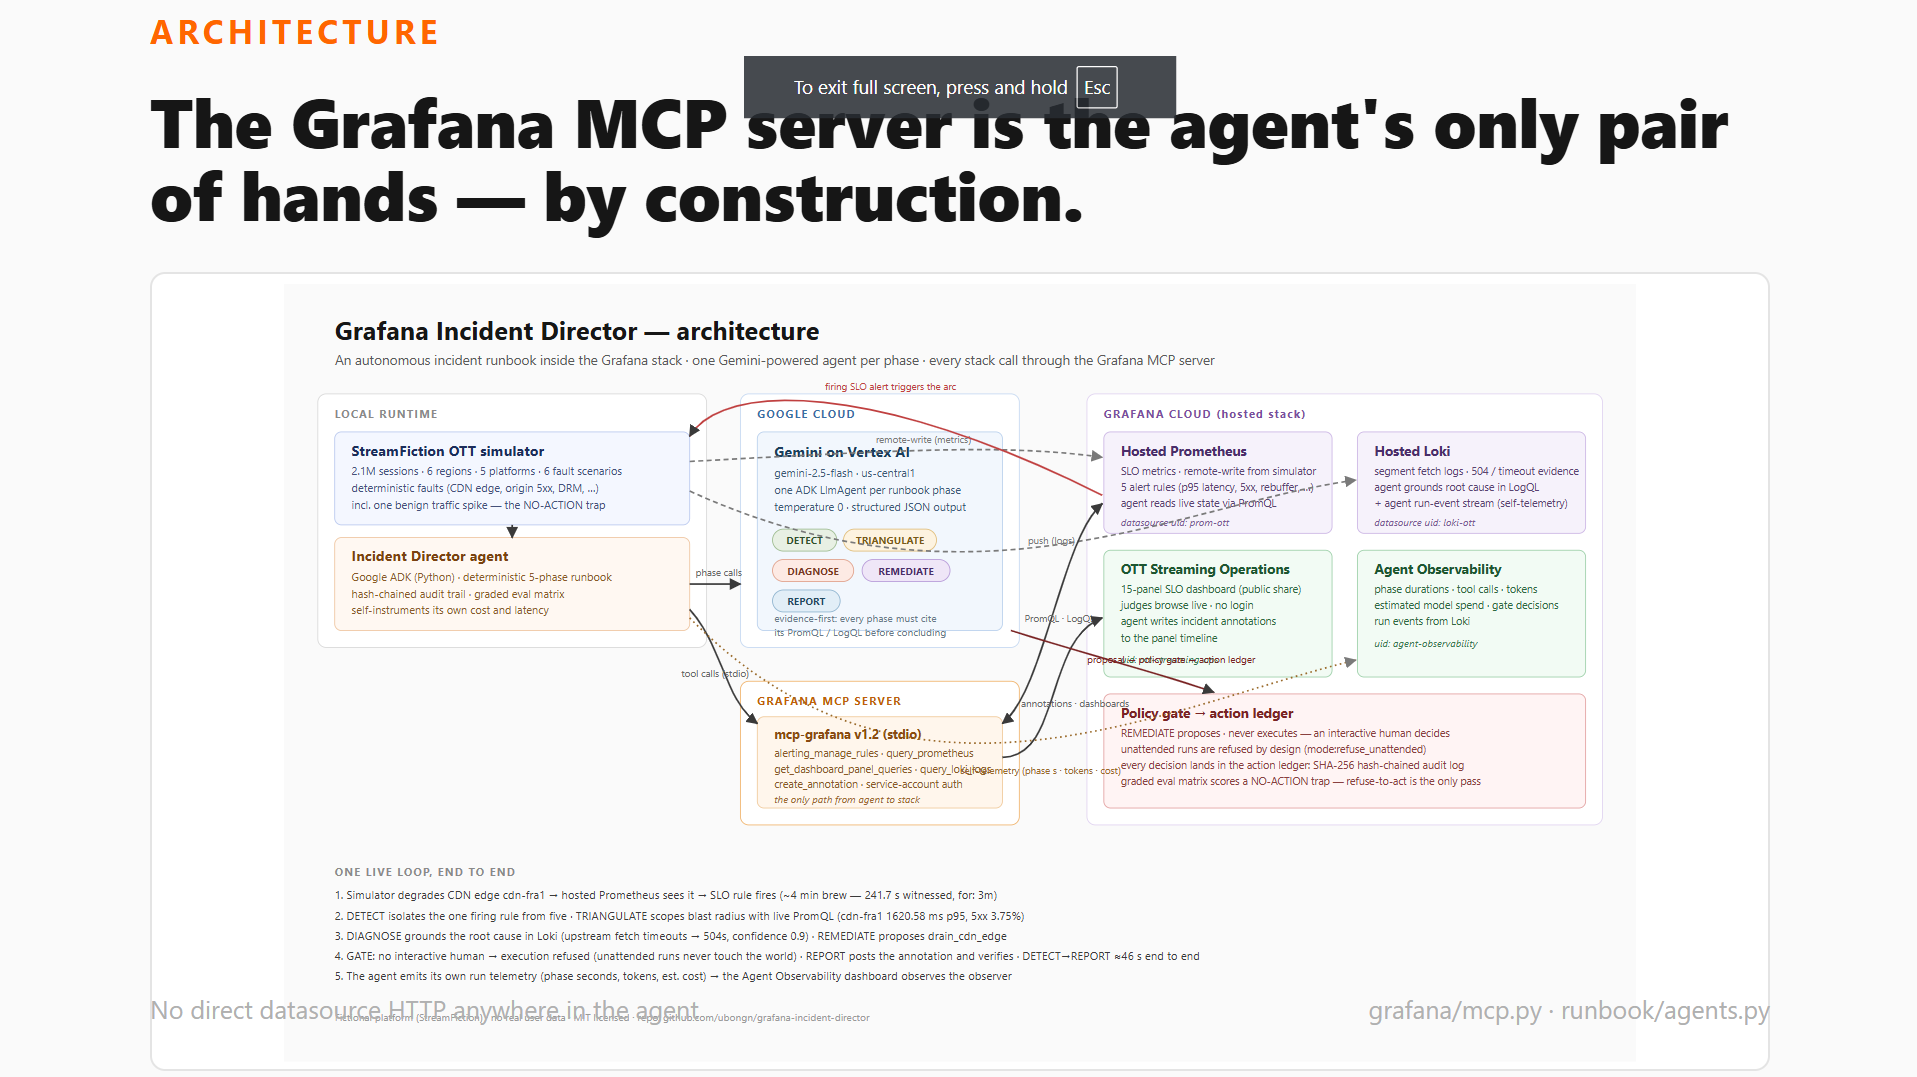
LlmAgentper phase, temperature 0, structured JSON outputs. Google Cloud is the only AI provider in the codebase. - The Grafana MCP server is the agent's only pair of hands, by construction. Every stack interaction at runtime is an MCP tool call — no direct datasource HTTP anywhere in the agent (
agent/incident_director/grafana/mcp.pybuilds one phase-narrowedMCPToolsetper phase; the audit log records the exact tools per phase:alerting_manage_rules,get_dashboard_panel_queries ×8,query_prometheus ×8,find_error_pattern_logs,query_loki_logs,create_annotation). - A simulated OTT platform (StreamFiction: 2.1M sessions, 6 regions, 5 fault classes + one benign traffic-spike trap) remote-writes into Grafana Cloud hosted Prometheus/Loki — the agent runs against the real hosted stack, triggered by a real firing alert, not a script flag.
- Hash-chained audit ledger — every phase, proposal, gate decision and report is SHA-256 chained (
incident-director audit verify= chain OK). - The observer, observed — the agent publishes its own phase timings, tool calls, token counts and cost estimate to the same Grafana it manages (the Agent Observability dashboard).
Challenges we ran into
- Engineering demo honesty. Grafana 13 public dashboard shares strip the annotations layer — we verified this live and structured the demo around it: the public link shows the arc through its data footprint; the annotation write-back is demonstrated on the internal dashboard.
- Making "safe autonomy" provable. The NO-ACTION trap: a benign traffic spike must be assessed and not remediated — the eval harness grades refusal as the only passing answer.
- The 4-minute SLO brew (
for: 3m+ eval cadence) — the gap between inject and FIRING — we turned into narration time rather than hiding it.
Accomplishments we're proud of
A complete incident arc — real firing alert → log-grounded diagnosis → gated proposal → annotation write-back — in about 46 seconds of agent time, against the real hosted Grafana Cloud stack, with every action auditable and the safety story graded by an eval matrix rather than asserted.
What we learned
Operators don't want a chatbot on-call; they want a runbook executor that stays leashed. Speed earns attention, but the gate earns trust — "it diagnosed everything and still didn't touch production" is the sentence that changes minds. And publishing the agent's own cost and latency to Grafana turns AI spend into a first-class observability problem, which is where it belongs.

Log in or sign up for Devpost to join the conversation.