Inspiration
The growing urgency of climate change and the clear impacts outlined by the UN Sustainable Development Goals (SDGs), we were inspired to use technology to tell a data-driven story. We saw the power of Grafana not just for monitoring systems, but as a tool for raising awareness about critical global issues by creating dashboards. We wanted to explore the relationship between industrial development (SDG 9), responsible consumption (SDG 12), climate action (SDG 13), and their effects on our planet's and human's health.
What it does
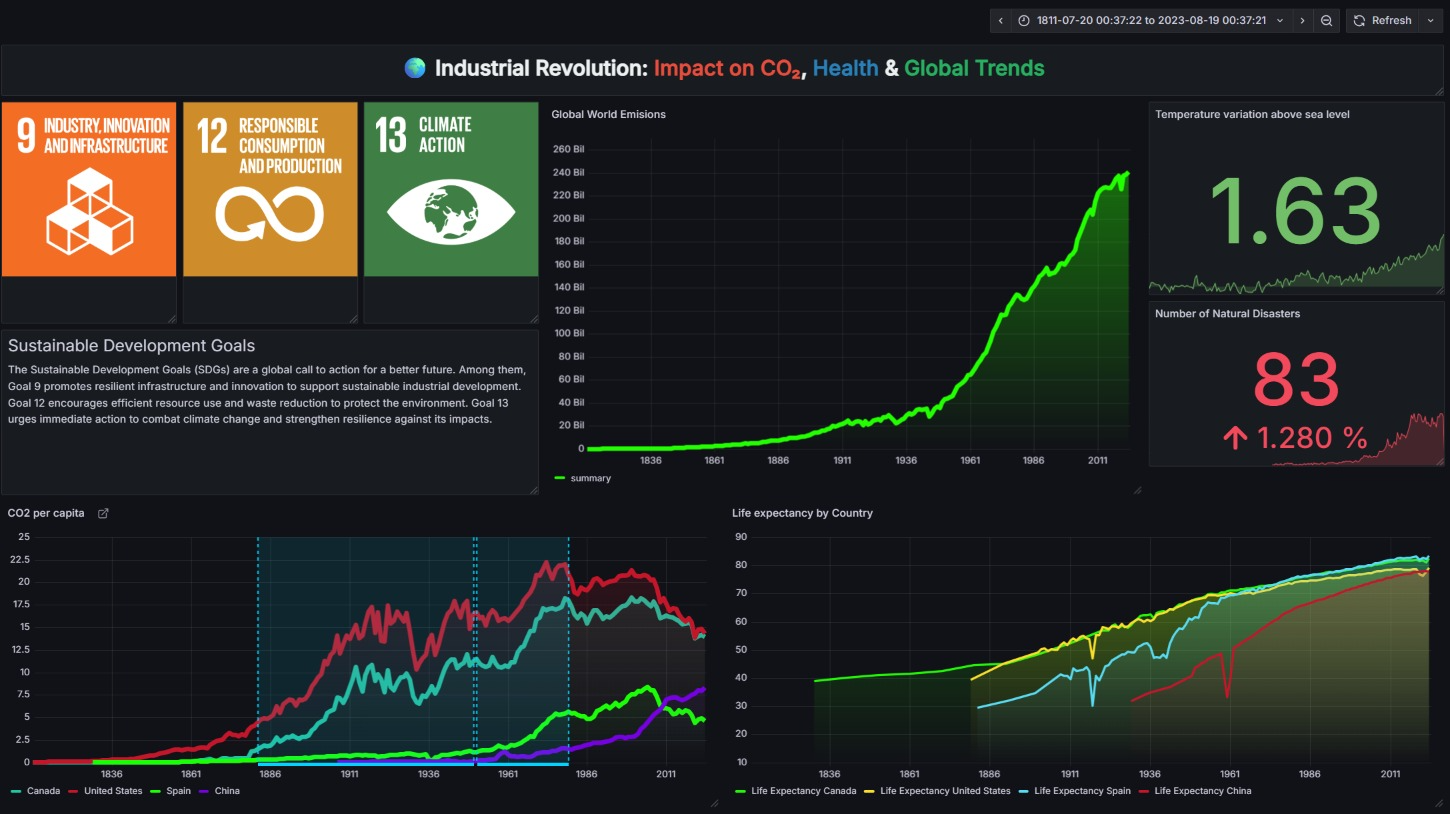
Graf-Anna is a comprehensive Grafana dashboard that visualizes the impact of the Industrial Revolution and human activity on CO2 emissions, global climate trends, and human health. It aims to:
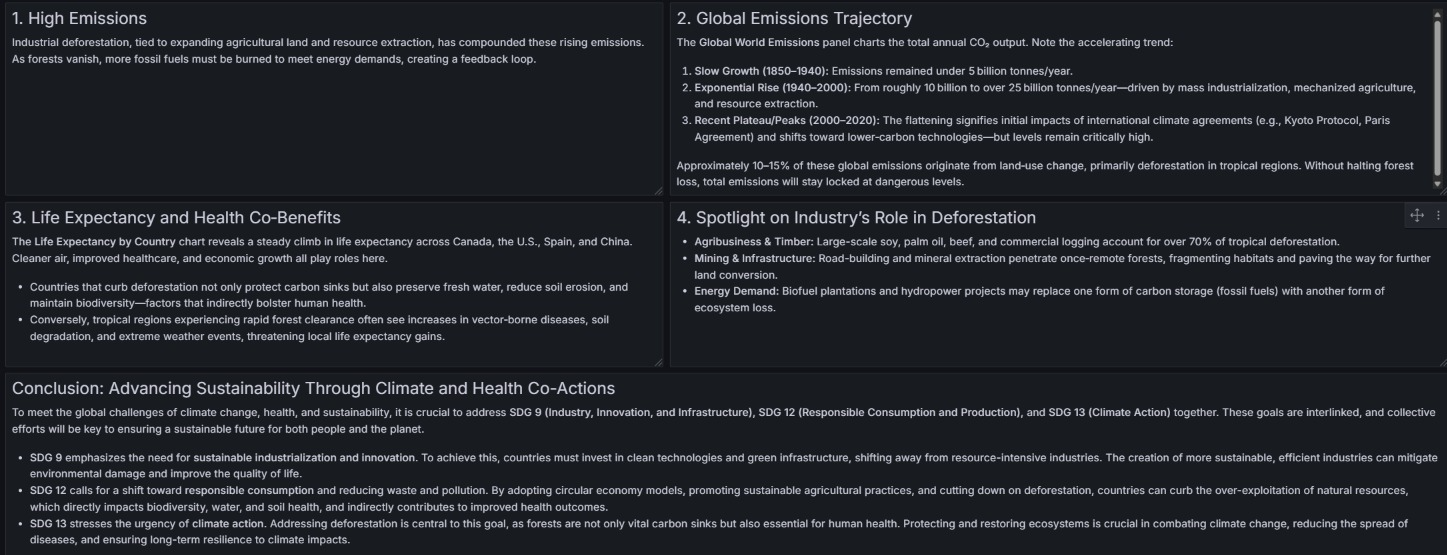
- Show Historical Trends: Displays the rise in global CO2 emissions, corresponding temperature increases, and the alarming increase in natural disasters since the industrial era began (~1850).
- Compare National Impacts: Visualizes CO2 emissions per capita and life expectancy trends for major countries (the US, China, Canada, Spain).
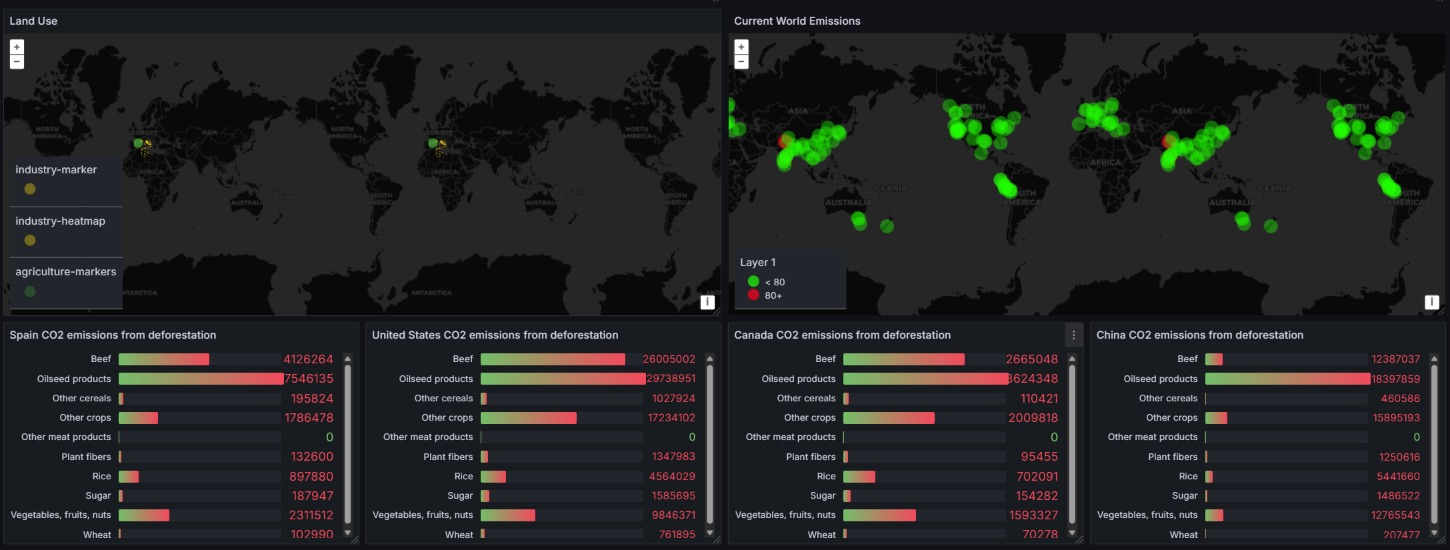
- Analyze Deforestation: Breaks down CO2 emissions specifically caused by deforestation, attributing them to different agricultural products (beef, oilseed, cereals, etc.) for key nations, illustrating the link between consumption patterns and environmental impact (connects SDG 12 and 13).
- Map Global Footprints: Uses Geomap panels to visualize current emission hotspots and land use patterns (industry vs. agriculture).
Graf-Anna serves as an educational tool to understand the historical context and current state of climate change drivers and impacts, using data to tell a compelling story. It uses both historical and live data to combine different SDGs.
How we built it
We utilized Grafana Dashboards as the core framework. We gathered data from various public sources (like https://ourworldindata.org/, OpenAQ API... ) covering:
- Historical global CO2 emissions and temperature anomalies.
- Natural disaster occurrences over time.
- CO2 emissions per capita and life expectancy by country.
- Detailed CO2 emissions from deforestation linked to specific agricultural commodities (likely sourced from environmental or agricultural statistics databases).
- Geospatial data for land use and emission mapping.
We used the Infinity plugin to ingest data from CSV files or APIs where necessary, and we employed a variety of Grafana panels:
- Time Series Charts: For historical trends (emissions, temperature, disasters, life expectancy, CO2/capita).
- Bar Charts: For comparing deforestation emissions by country and product.
- Geomap Panels: For visualizing land use and emission hotspots.
- Stat Panels: For displaying key metrics like current temperature anomaly and disaster counts.
- Text Panels: To provide explanations, context, and conclusions.
- Polystat/Image Panels: For displaying SDG logos.
We focused on structuring the dashboard logically, using rows and panel arrangements to guide the user through the story. We tried to apply the visualization best practices regarding layout and clarity that appeared in the slides.
Challenges we ran into
Our initial ambition was to develop a custom Grafana App Plugin using Scenes, potentially incorporating more advanced features like LLM integration for insights or dynamic image generation. However, we encountered technical difficulties and time constraints in implementing these features. This forced us to pivot our strategy. We realized that effectively sourcing, integrating, and visualizing the existing data to tell a clear story was a significant challenge in itself. So, finally, we opted to divert our efforts into finding consistent, comparable data across different domains (climate, health, agriculture, deforestation).
Accomplishments that we're proud of
We are proud to have successfully pivoted from our initial complex plugin idea to deliver a comprehensive and informative Grafana dashboard within the time limit. We successfully integrated diverse datasets from multiple domains to create a cohesive narrative about the interconnectedness of industrial activity, consumption, climate change, and health.
What we learned
This project reinforced the power of data visualization as a storytelling tool. We learned that even without custom code, Grafana provides immense capability for building insightful dashboards. It was our first time with a technology of this kind, so we had to learn it from scratch.
We also deepened our understanding of the specific challenges and data points related to SDGs 9, 12, and 13.
What's next for Graf-Anna
Future development for Graf-Anna could include implementing the custom plugin, incorporating more interactive elements and live-data, adding more SDGs...
Built With
- api
- grafana


Log in or sign up for Devpost to join the conversation.