GENERAL TRACK SUBMISSION
Inspiration
I originally made a similar diagram in draw.io for my own graduation project, and thought that it would be useful for other people too - not just in my university and major, but anyone taking classes at any university or even high school!
What it does
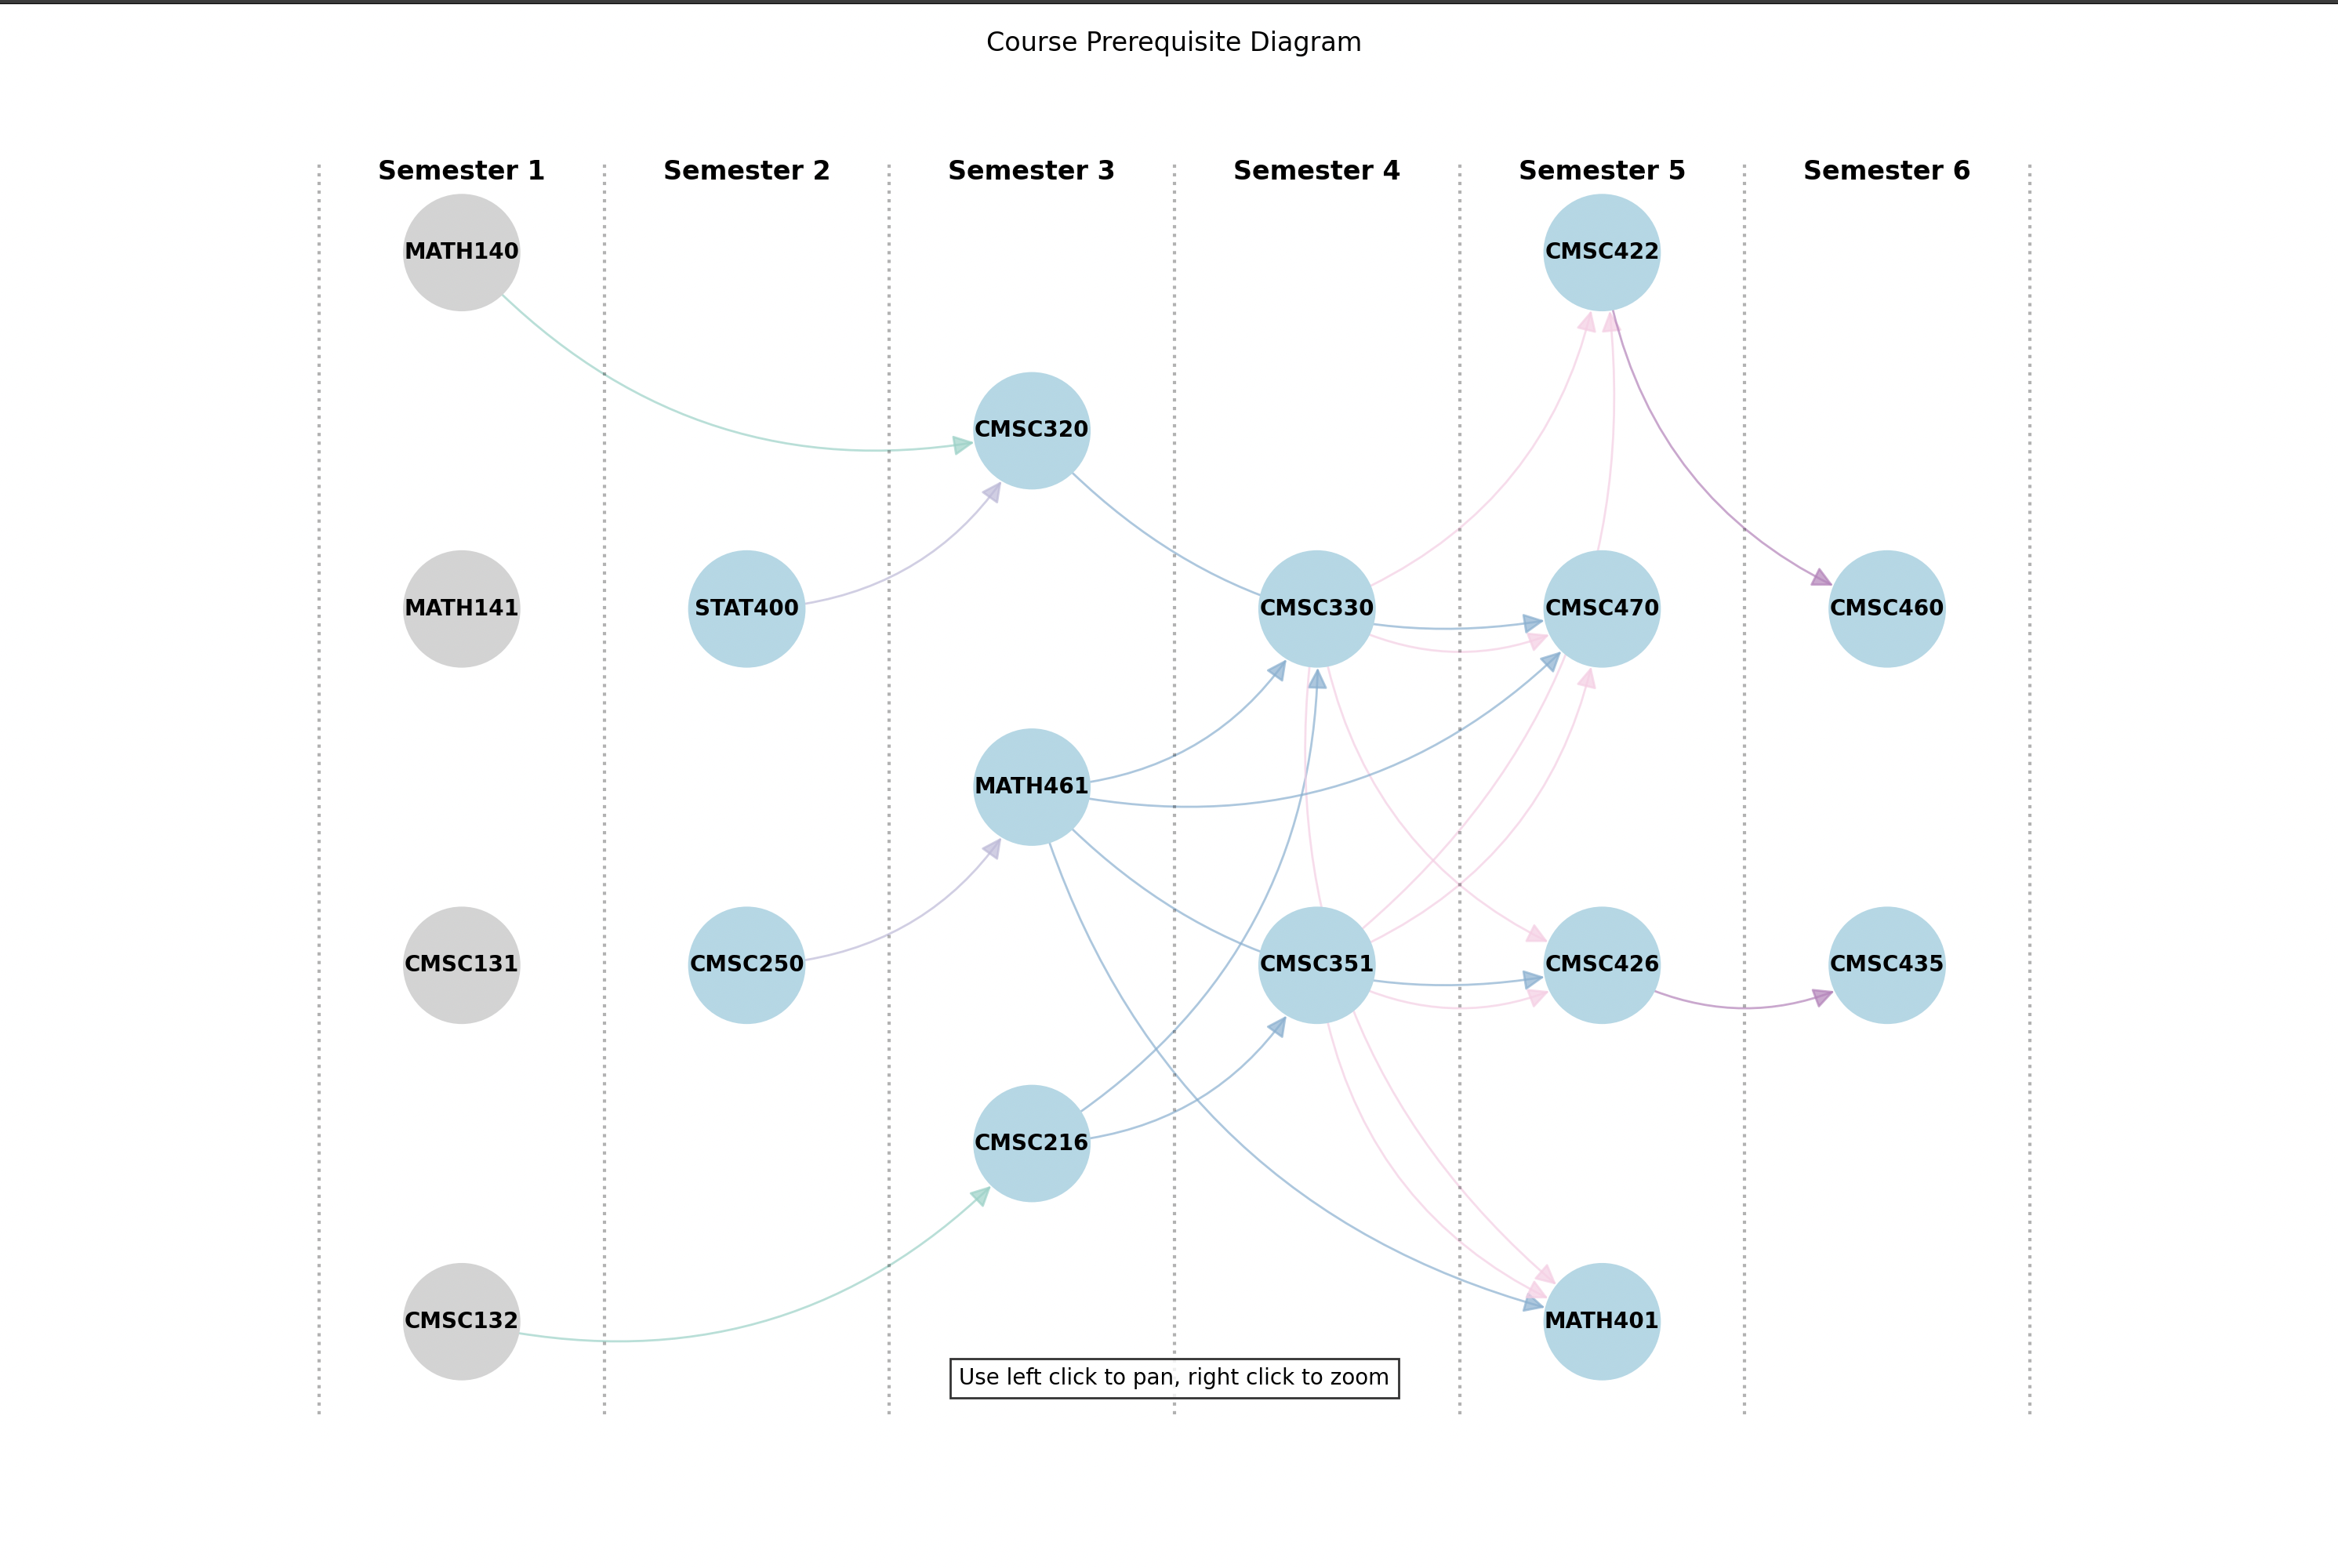
The program automatically generates a roadmap of the courses you will take, based on prerequisite information gathered from the university catalog.
How I built it
I used Python for all of my code. I also compartmentalized my code into modules:
- declaring a custom Course and GraduationPlan class
- drawing a roadmap diagram using
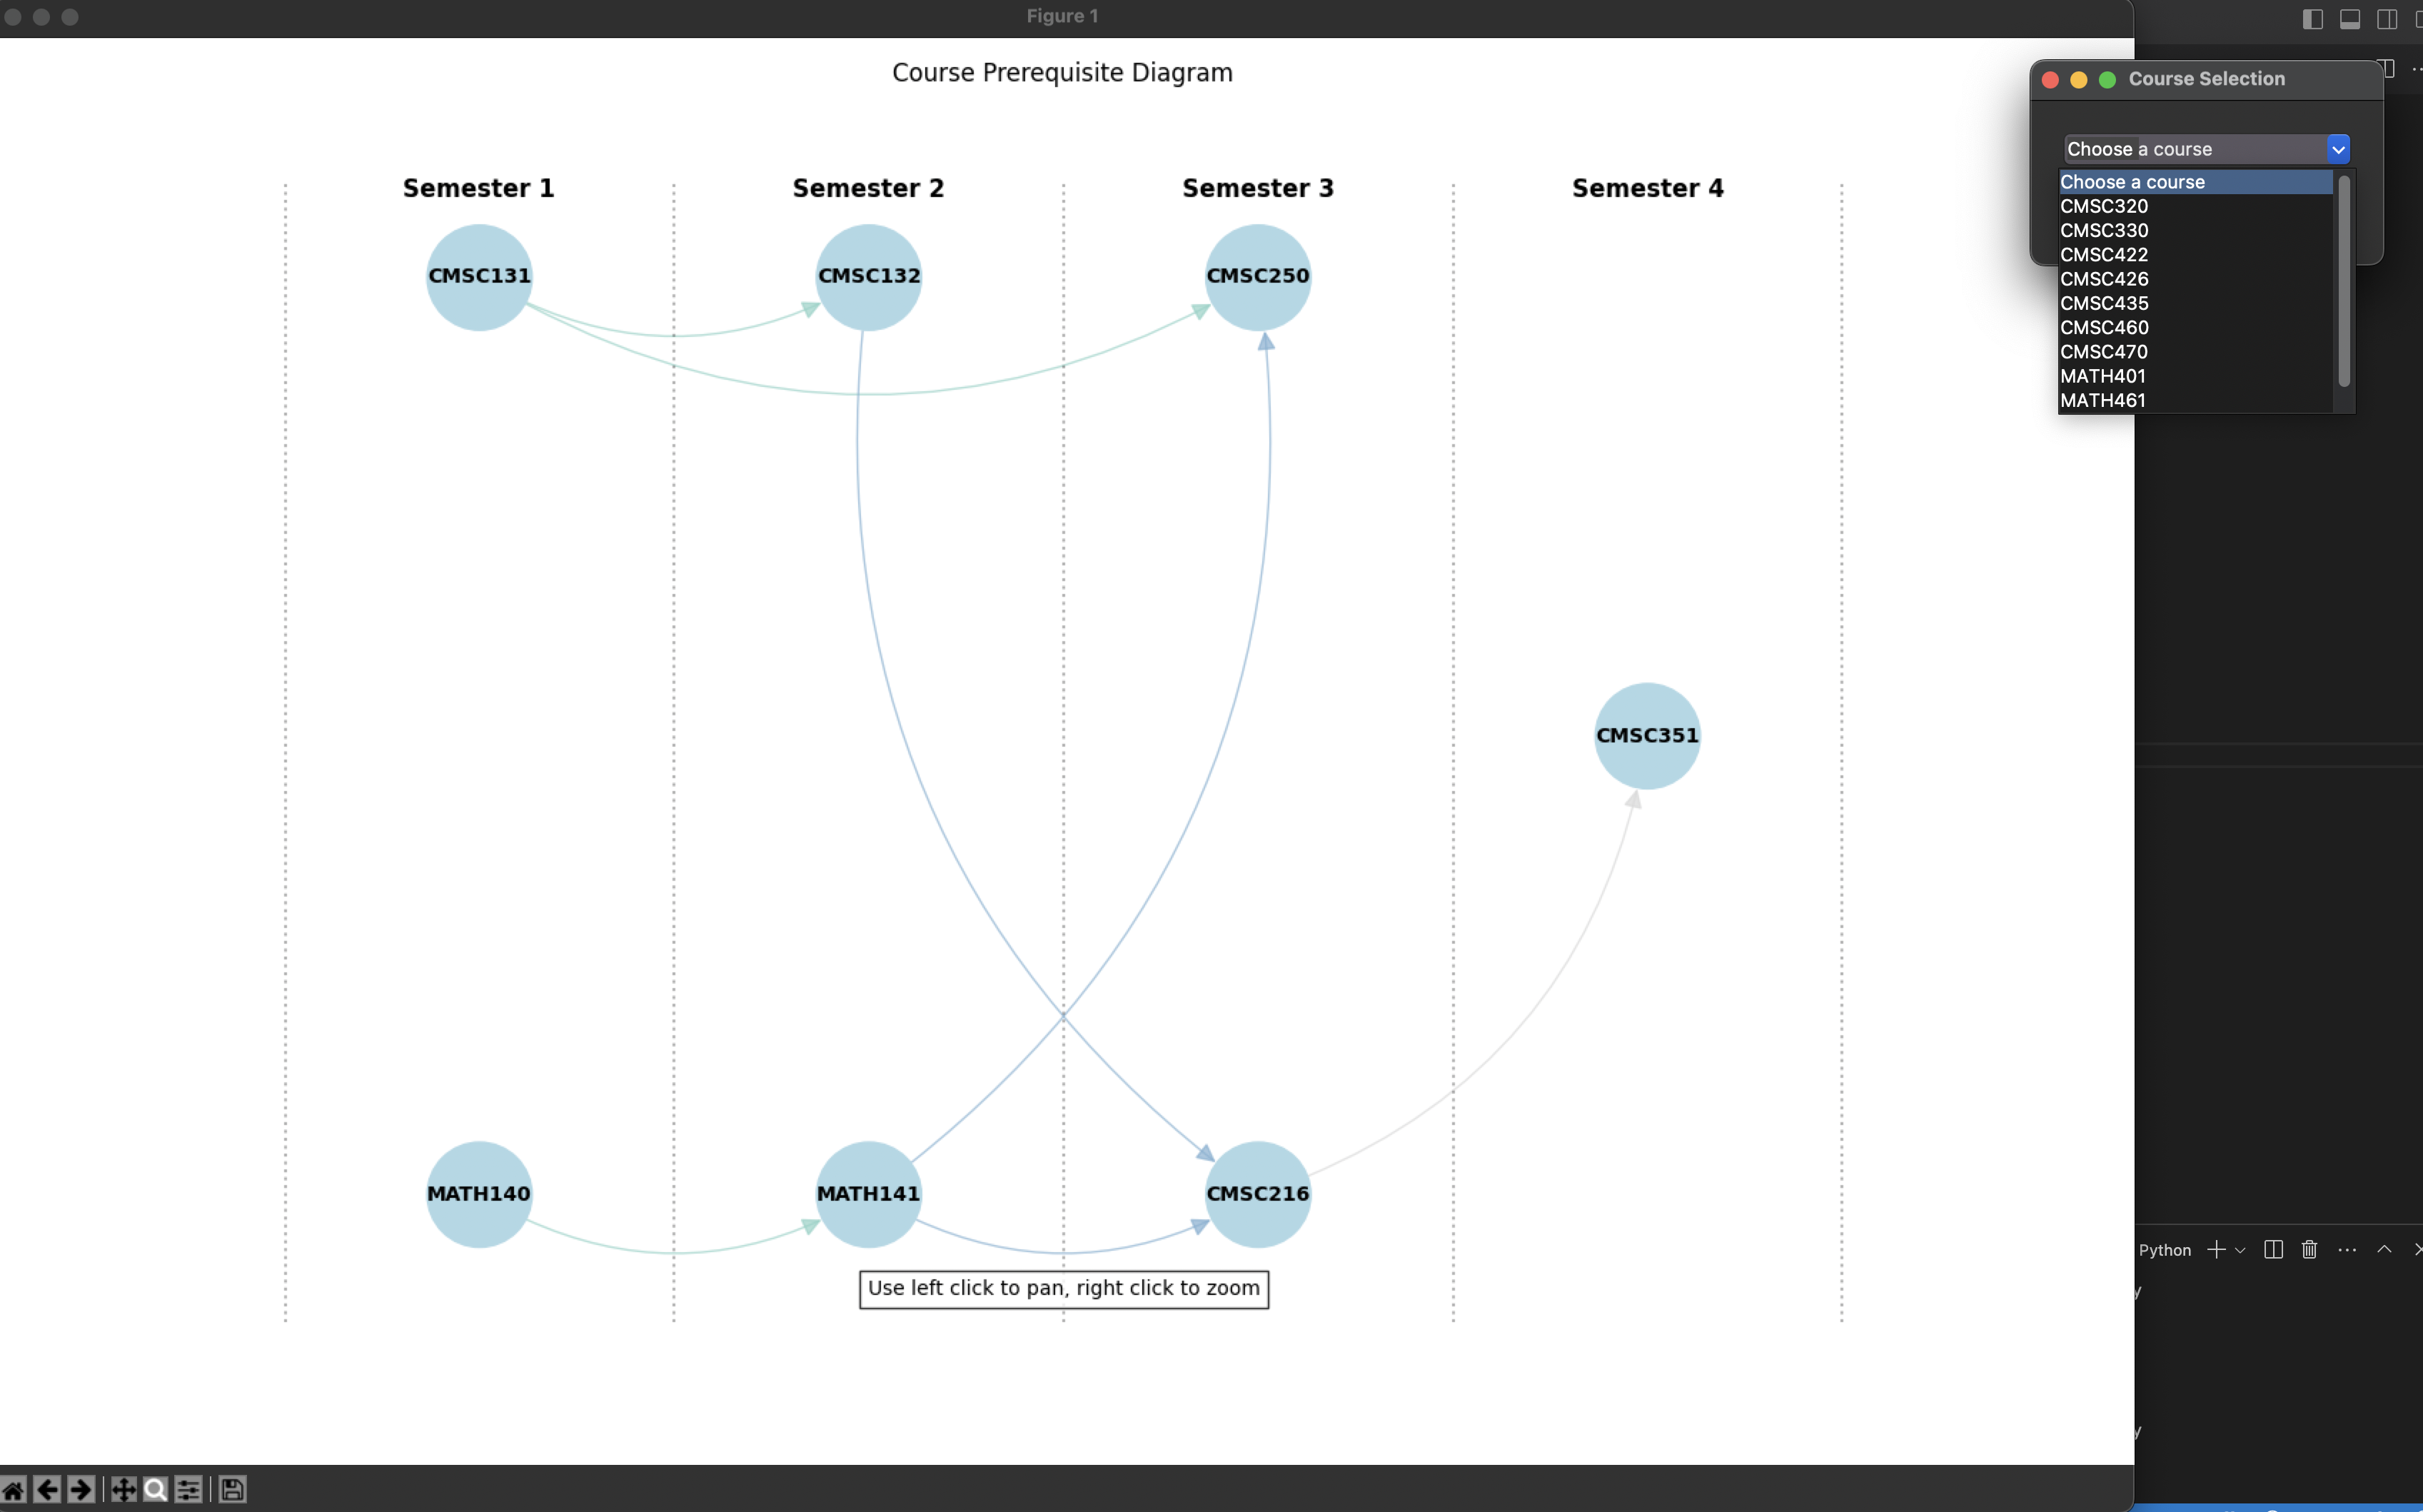
networkxandmatplotlib - creating a dropdown menu using
tkinterthat updates the diagram - retrieving and storing the real course catalog data using the umd.io API
- an algorithm that assigns semesters and links courses together based on prerequisite information
- bringing all the functions together and running the main program
- unit tests (incomplete) for my Python code
Data I used (JSON format)
- real university course data
- real university transfer credit data
- real university degree requirements
- sample course prerequisite data
- sample degree requirements
Challenges we ran into
I had trouble brainstorming the best technology to use for creating this diagram. At first I tried using react flow but the edge customization did not have what I needed, and visual tweaking was taking too big of a chunk out of my time.
It took a while to figure out the recursive logic that assigned semester numbers to the courses, since prerequisites can chain together.
I had to create an algorithm that minimized the number of edge crossings in the diagram. The courses would be linked up correctly but would make the diagram messy, so I had to optimize the vertical order of each course.
One challenge was figuring out how to get tkinter and matplotlib to work together (with both the dropdown menu and the diagram) - there were compatibility issues that caused a segmentation fault.
It was also a challenge to create the hover 'annotations' that showed more course information.
Accomplishments that I'm proud of
I was able to get a full diagram working, without bugs like duplicate courses and things like that.
Also, I didn't think i would be able to make the diagram update so smoothly when selections were made in the dropdown, but matplotlib had a draw() feature that helped with updating the diagram.
I am proud of my discipline - keeping up with type declarations, using custom classes, writing unit tests, and proper git/github usage. If you check my repository, you will see that I have multiple closed PRs for different features and milestones of the project.
What we learned
I learned a lot about graph and tree visualization, and how to modify or update matplotlib plots dynamically.
I also gained experience in the object-oriented side of Python which I don't usually do.
What's next for GradPath
In GradPath's future, I see a program that can pull degree requirements from a wide range of schools and universities, and will automatically create a diagram showing the required courses. Then you would be able to pick and choose your elective courses and dynamically see how it affects your graduation plan using the GradPath diagram.
Built With
- matplotlib
- networkx
- python
- tkinter

Log in or sign up for Devpost to join the conversation.