-

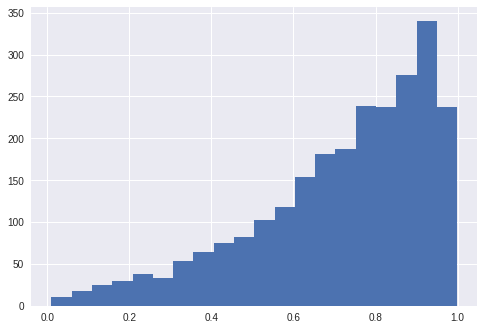
Histogram of randomly generated grades
-
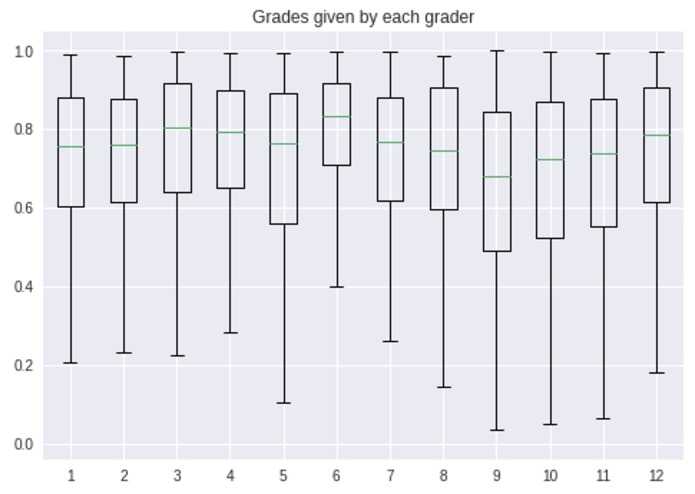
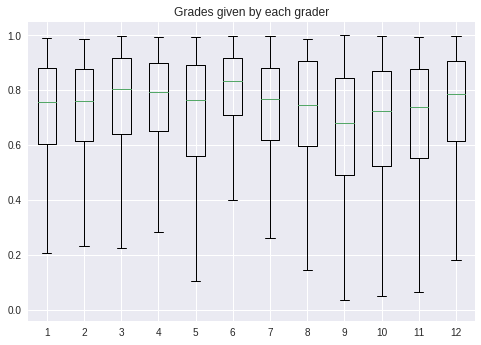
Box and whisker plot of grades by grader
-
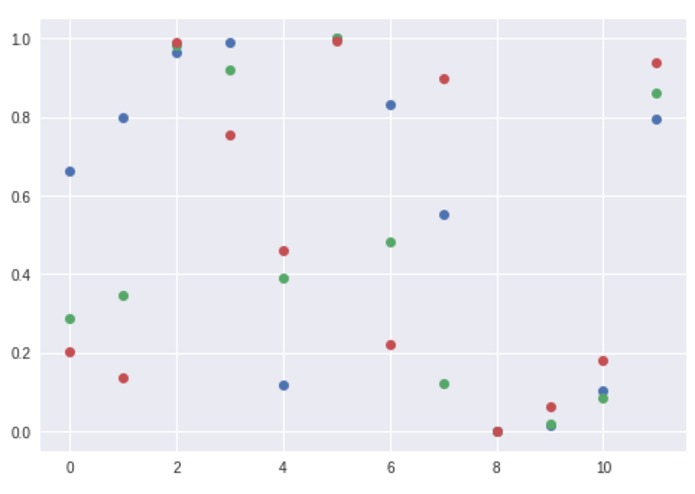
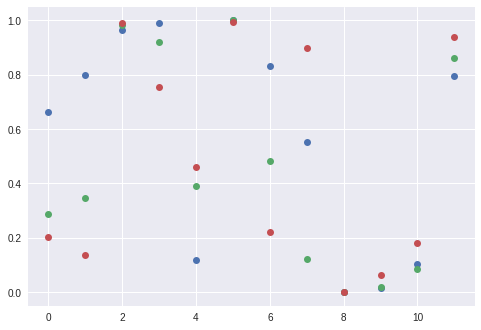
Plot of hypergeometric probability according to the quartiles at 25, 50, and 75
-
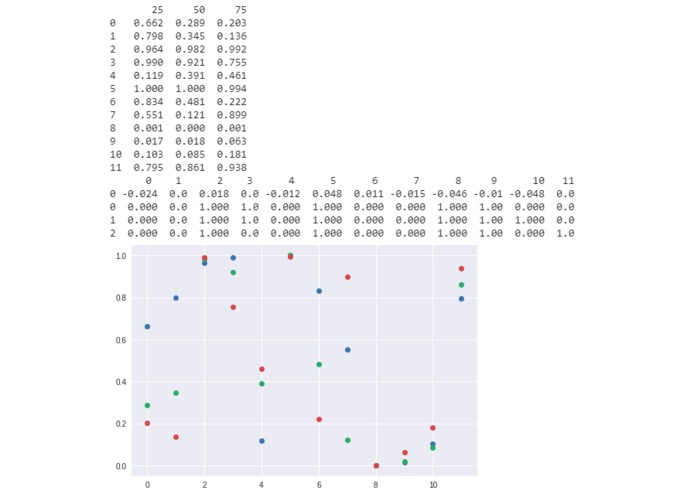
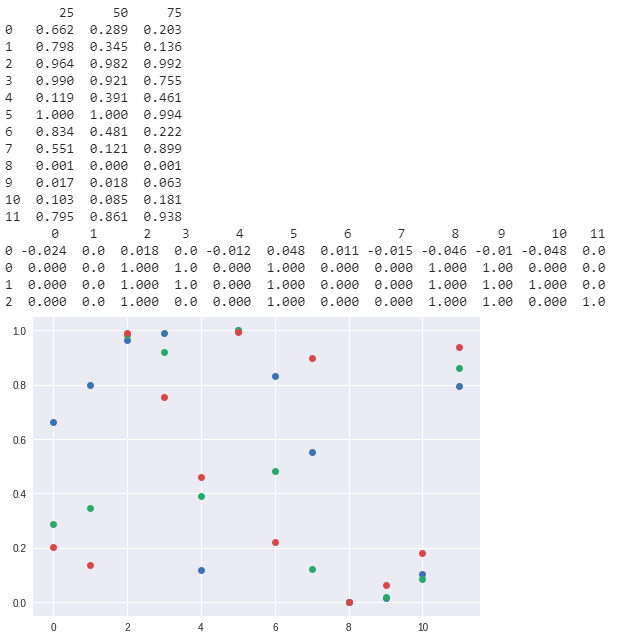
Plot of hypergeometric probability with the table of corresponding data
-
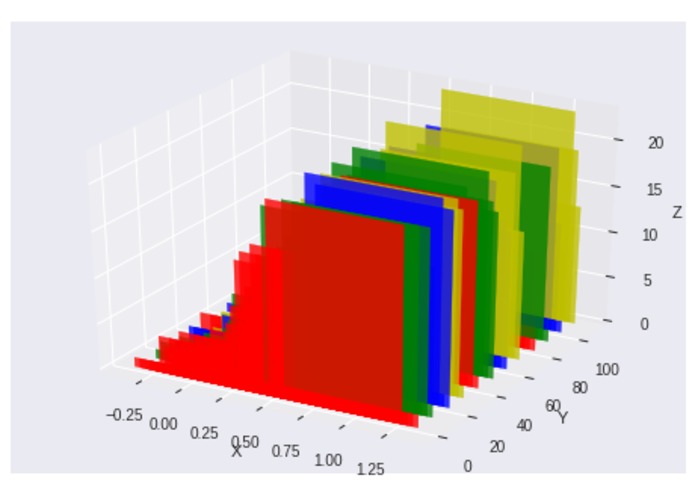
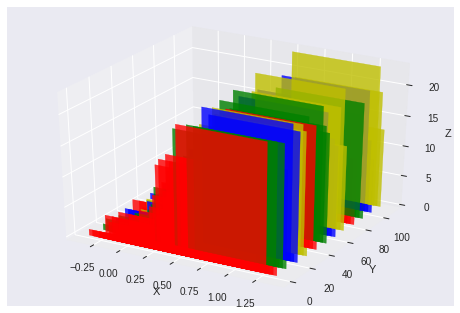
3D histogram of all the grades given by each grader
Introduction
When a class has a lot of student, there is A LOT of homework to grade! These classes are likely to have either automated grading or student graders to help out with all of the paperwork and feedback. However, some graders may be... a little bit too nice to the students. On the other hand, some graders may be extremely picky (though less likely if there is a well defined rubric). By having inconsistencies in the grading, students may complain about how they got the "nice" grader or the "mean" grader. Additionally, it is simply unfair to all the other students. How do we statistically find these overly nice or picky graders?
Inspiration
Am I grading my students too harshly? Am I being too nice to my students? How does my grading compare to that of other students? I wanted to find a way to answer this question while having some kind of evidence to support my answer. This lead to a statistical approach to analysing grading bias from graders.
Method
To begin with this project, we need some grades. For the demonstration of the procedure, randomly generated data is used, since the use of real grades may violate FERPA laws. The first code block creates projects, graders, and students. Average grades are created for each project according to a uniform distribution. Then, each grader is given an average bias (by a gaussian distribution) depending on a coin toss and each project for each grader is given a bias according to their average bias. Then, each student is given an offsetted bias to simulate their performance in the class.
Grades are created for each project for each student according to a beta distribution that follows the mean according to the grader bias, student bias, and average. A mode is assigned based on half the distance from the mean to 1. This creates a formula to find alpha and beta for this beta distribution.
What it does
This python notebook demonstrates one approach to statistically determining the likelihood that a grader is being too nice or too mean to his/her students. It provides a script to randomly generate a set of grades according a gaussian distribution for the grading bias and a beta distribution for generating the actual grades between 0 and 1. The grades are then analysed by comparing them to a hypergeometric distribution (while making a few assumptions for statistical purposes) and finding the probability of getting a "more extreme" distribution of grades from that grader.
How I built it
This is built using Python 3 Jupyter Notebook in Google Colaboratory. It's like Google Docs but it's Jupyter Notebook. In the cloud. mind blown
Challenges I ran into
I am still a noob with numpy, pandas, and data visualization. I am not sure how correct this statistical analysis is, since I am not a professional in the field. However, the approach does seem to provide a good indication of bias, since I have tested this approach with real grades from students.
Finding the statistical significance of the grades for each grader according to a hypergeometric CDF
This is the core section of this analysis. Assuming that each grader gets a random sample (this is not true, given that each grader gets assigned a moving-window group of students, but is likely "close enough" for this analysis) from the overall group of grades, and assuming that all the other students were correctly graded, this random selection models a hypergeometric distribution. Such a distribution models a scenario where, for example, there are 20 animals, where 7 are dogs. You randomly select 12 without replacing, what are the odds that you get X animals that are dogs?
This approach calculates the CDF to find, "What are the odds of getting a result more extreme?" or in other words, what are the odds that I get a random selection with more/fewer grades that are higher/lower than this number? The 1st, 2nd, and 3rd quartiles are used to roughly get a good idea of the distribution of the grades compared to the overall distribution.
Problems with this approach
If there are too many biased graders, the overall distribution gets biased, and unbiased graders may show up as biased as well.
There is no way to 100% detect if a grader is biased or not, since the bias may be subtle. As a result, this approach only serves as an aid to help detect any possible issues with graders. Any final decisions are up to the person in charge.
Since the "random samples" are not actually random, this may affect the results if certain groups of students do significantly better or worse than other groups.
The current execution of this data shows that at the 0.1 significance level (?) that all three quartiles indicate that graders 2, 5, 8, and 9 are biased in one direction. Note that if too many graders are biased in a particular direction, the unbiased graders may show up as biased.
Accomplishments that I'm proud of
I found motivation to make a presentable project on my own!!
What I learned
Statistical analysis is hard. Google Colaboratory is wonderful and easy to use. Visualization is both easy to do and hard to do well.
What's next for Grading Bias Detection Using a Hypergeometric CDF
Find someone smarter than me to verify that this works and to find a better approach to analysing this kind of data.
Built With
- jupyter
- python

Log in or sign up for Devpost to join the conversation.