-
-

Drug Prescription Anomaly Detection using TigerGraph
Inspiration
We are inspired by the humanitarian goal to improve healthcare by extracting useful insights from the usage of drugs, discovering anomalies and help saving life.
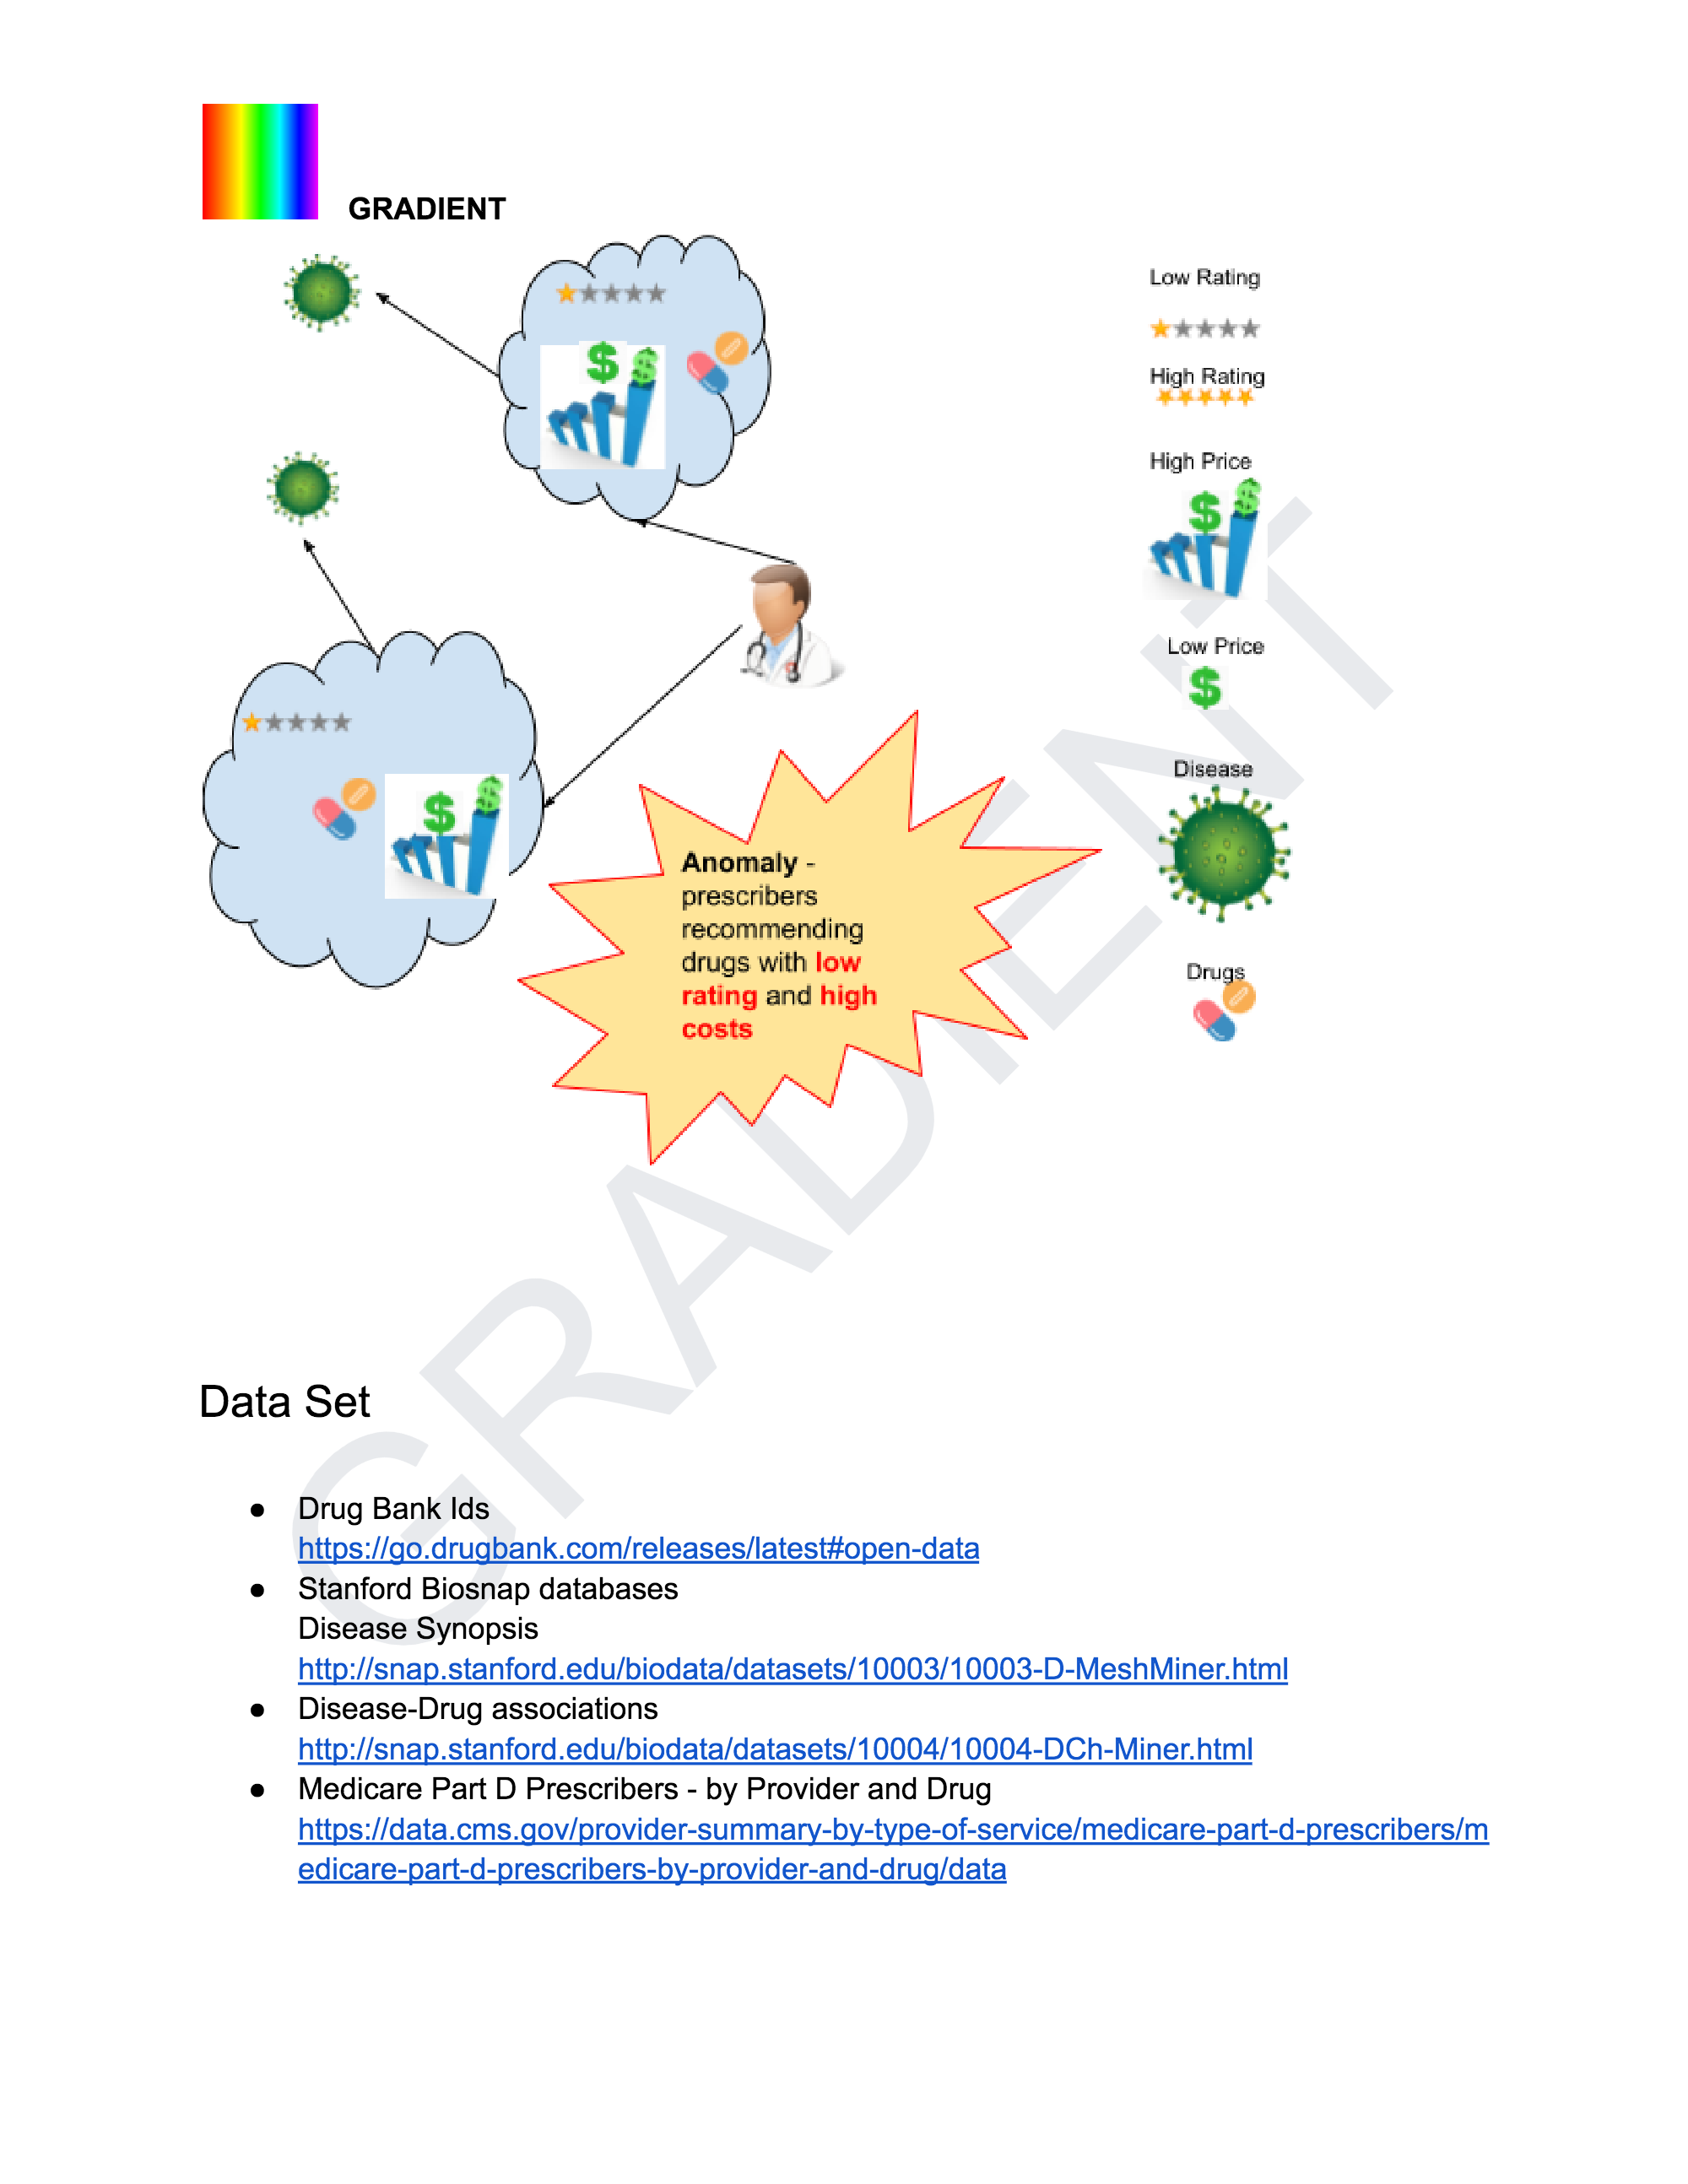
What it does
This project aims at developing functionalities using TigerGraph which can help review the quality of drugs used for treatment of diseases and identify potential anomalies like if the prescribers are using low rated drugs.
How we built it
We built the graph using the pyTigerGraph API and pandas dataframes for exploratory analysis. See our project report for more details on our schema and queries.
Challenges we ran into
We didn't find a great dataset which shows the diseases treated by the doctors. So we created the connections between Prescribers , Drugs and Diseases by combining multiple datasets. We wish we could get a long-running tigergraph instance. Our instance got terminated.
Accomplishments that we're proud of
We were able to leverage TigerGraph for detecting Anomalies.
What we learned
This graph helped discover that a low-rated drug was used for treating high blood pressure. This presents an opportunity to check if drugs with adverse effects of banned drugs being used for disease treatment.
What's next for GraDIENT (Graphical Drugs Insight for Effective Treatment)
Overall we have established a solid foundation for developing interesting features and discovering many anomalies which can improve healthcare and save lives.
Clustering & Community Detection
Our first improvement we are looking towards in in clustering the Prescriber and providers based on drugs prescribed
We have already identified prescribers recommending low rated drugs which are also very costly (for example drugs related to HIV Treatments). We would like to create a cluster of such prescriber-drug-disease groups. There is a great opportunity to find if banned drugs and drugs with adverse effects are being used.
Other analyses to be done
- Checking if any low rated drugs are being prescribed to the > 65 age group
- Finding similar prescribers based on similarities in patterns of drug prescription.
- Enriching the graph with social sentiment and drug usefulness by mining the drug review dataset (using NLP).
- Finding Adverse Drug Events and Key Terms from the Review Notes and linking them to the Drug Node in Graph.
- Performing time-series analysis on drug price and rating by capturing historical data in the graph.
- Leveraging other Data Science Algorithms such as k-nearest-neighbors and jaccard similarity
Built With
- python
- pytigergraph
- tigergraph


Log in or sign up for Devpost to join the conversation.