Inspiration
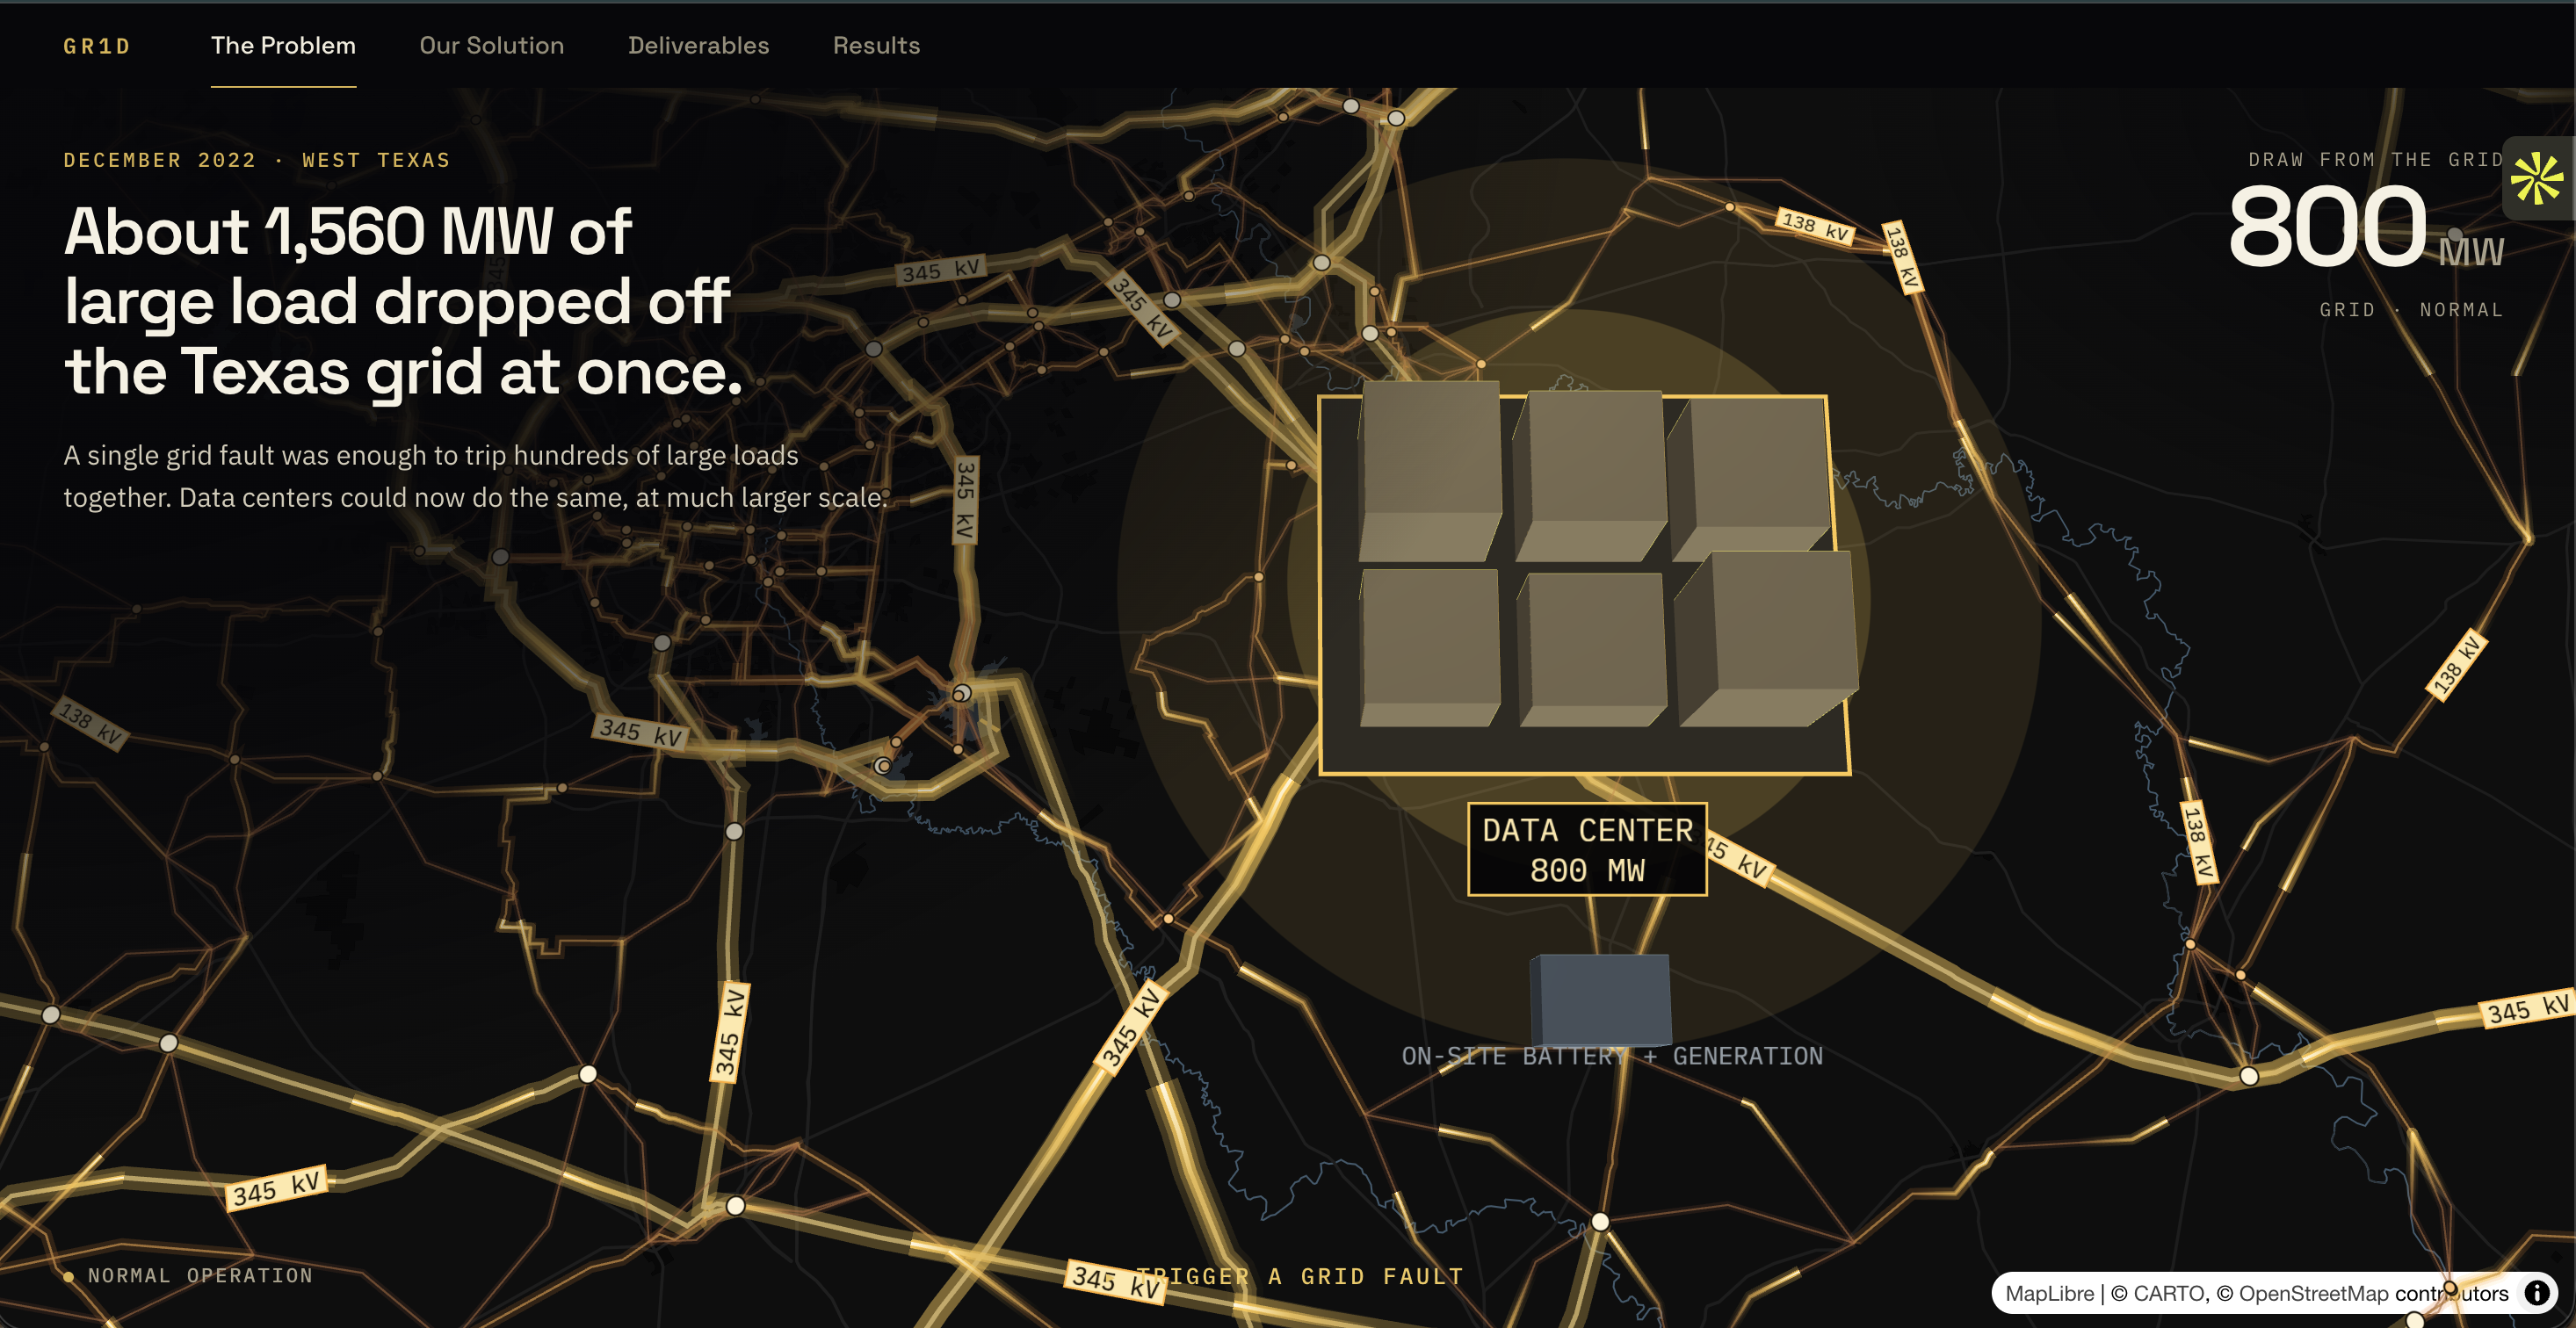
In July 2024, a fault on the grid in Northern Virginia dropped about 1,500 MW of data centers off the system at once. The voltage dipped six times in 82 seconds. At the third dip, 1,260 MW disconnected and stayed off for hours. Nothing was wrong with the grid's design. The data centers' own power equipment decided to protect itself.
What struck us is that no certification exists for this. A utility, a buyer, or a financier has no standard way to ask "will this facility ride through a grid dip?" Trust gets built one site at a time. Meanwhile the rules are arriving: ERCOT's ride-through requirement took effect August 1, 2026, and NERC issued a Level 3 alert on large computational loads in May 2026. NERC's 2026 State of Reliability expects these events to get larger.
What it does
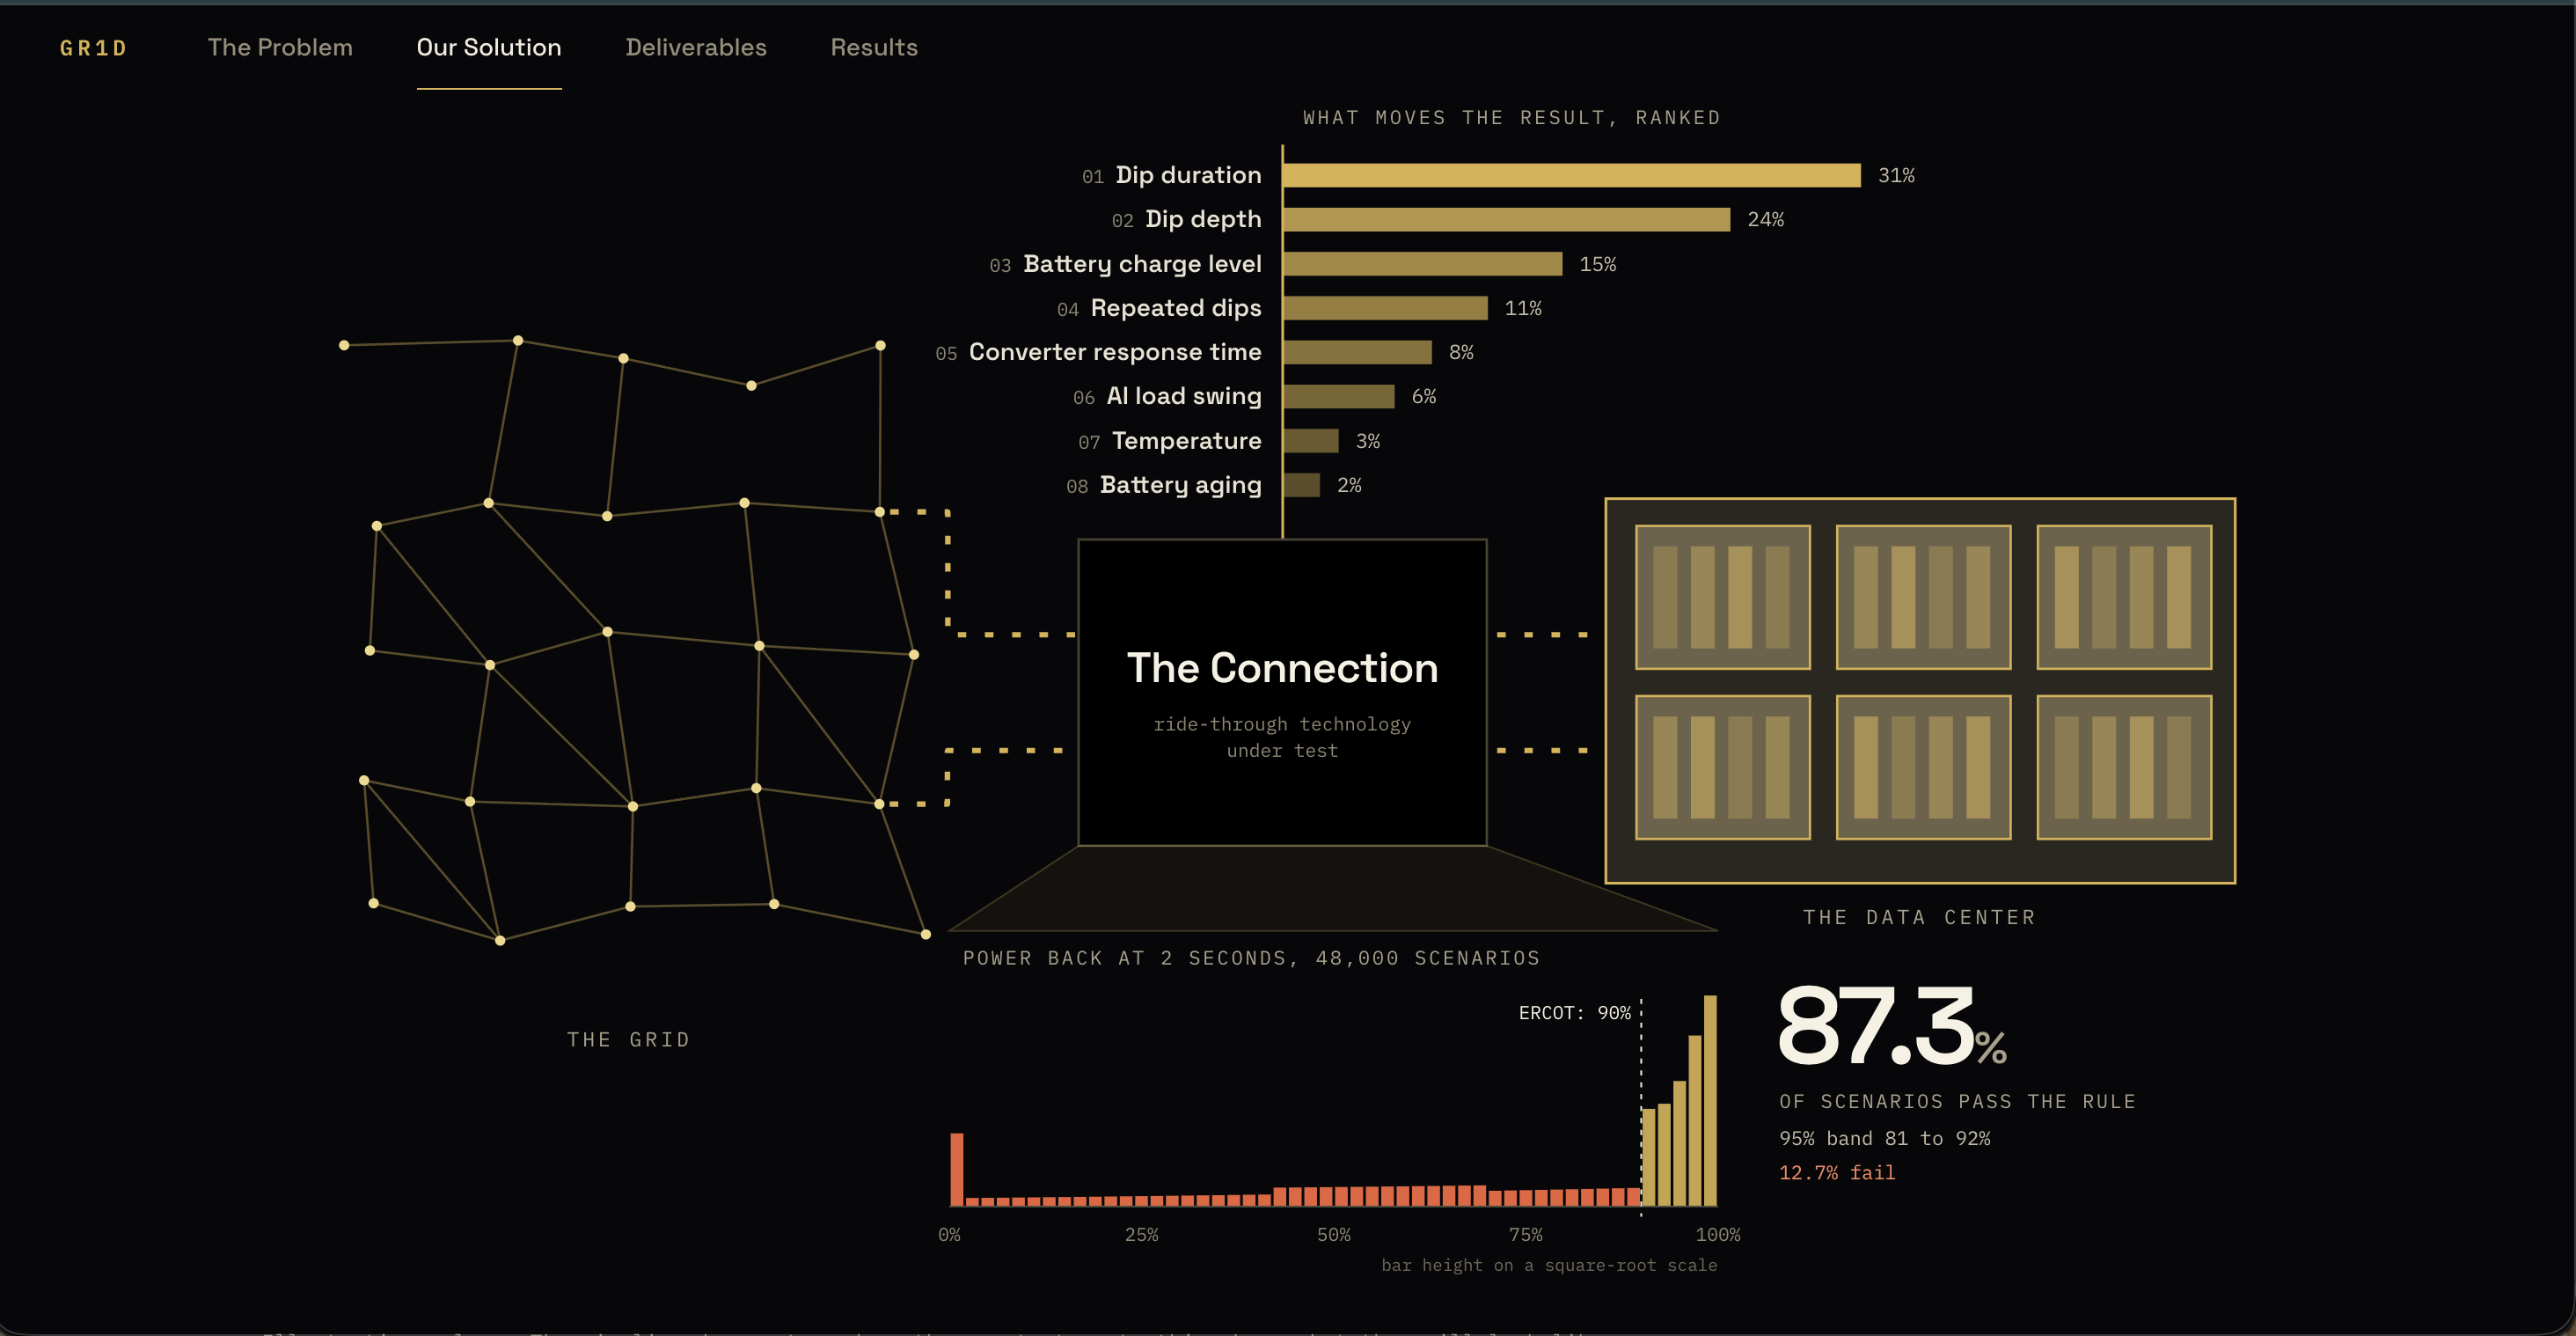
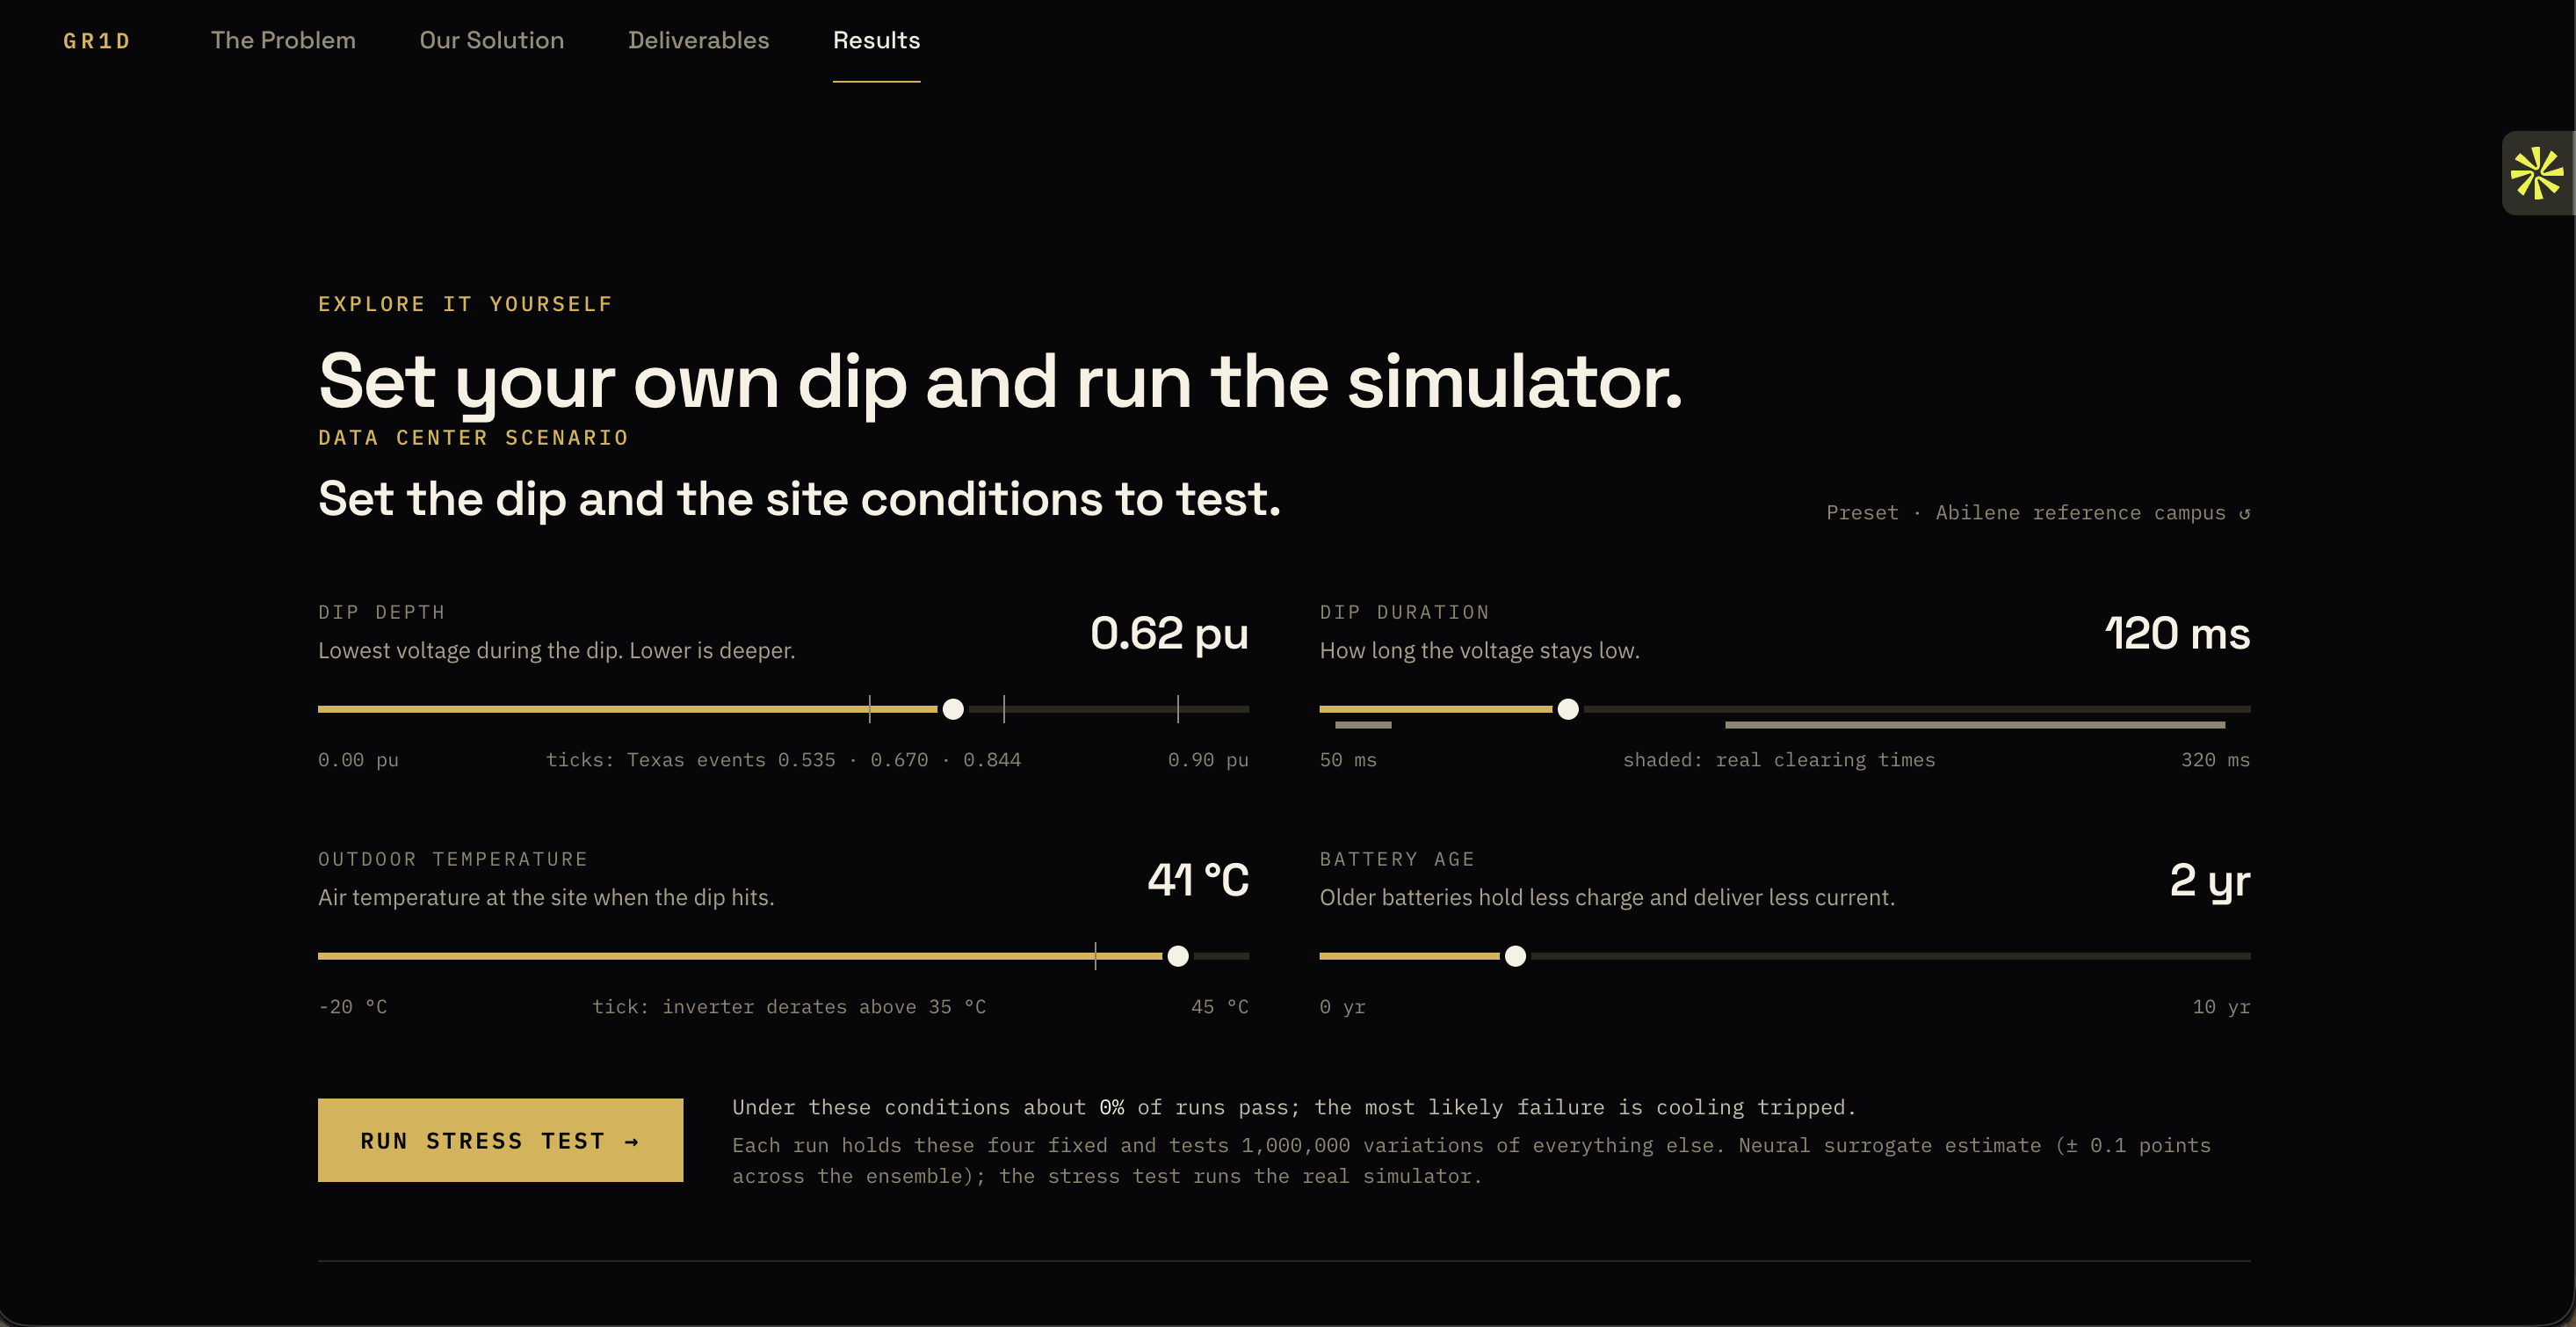
GR1D answers one question: what is the probability this data center rides through a grid dip, and how will it fail if it doesn't?
The report it produces has:
- a probability of passing the grid rule, with a band
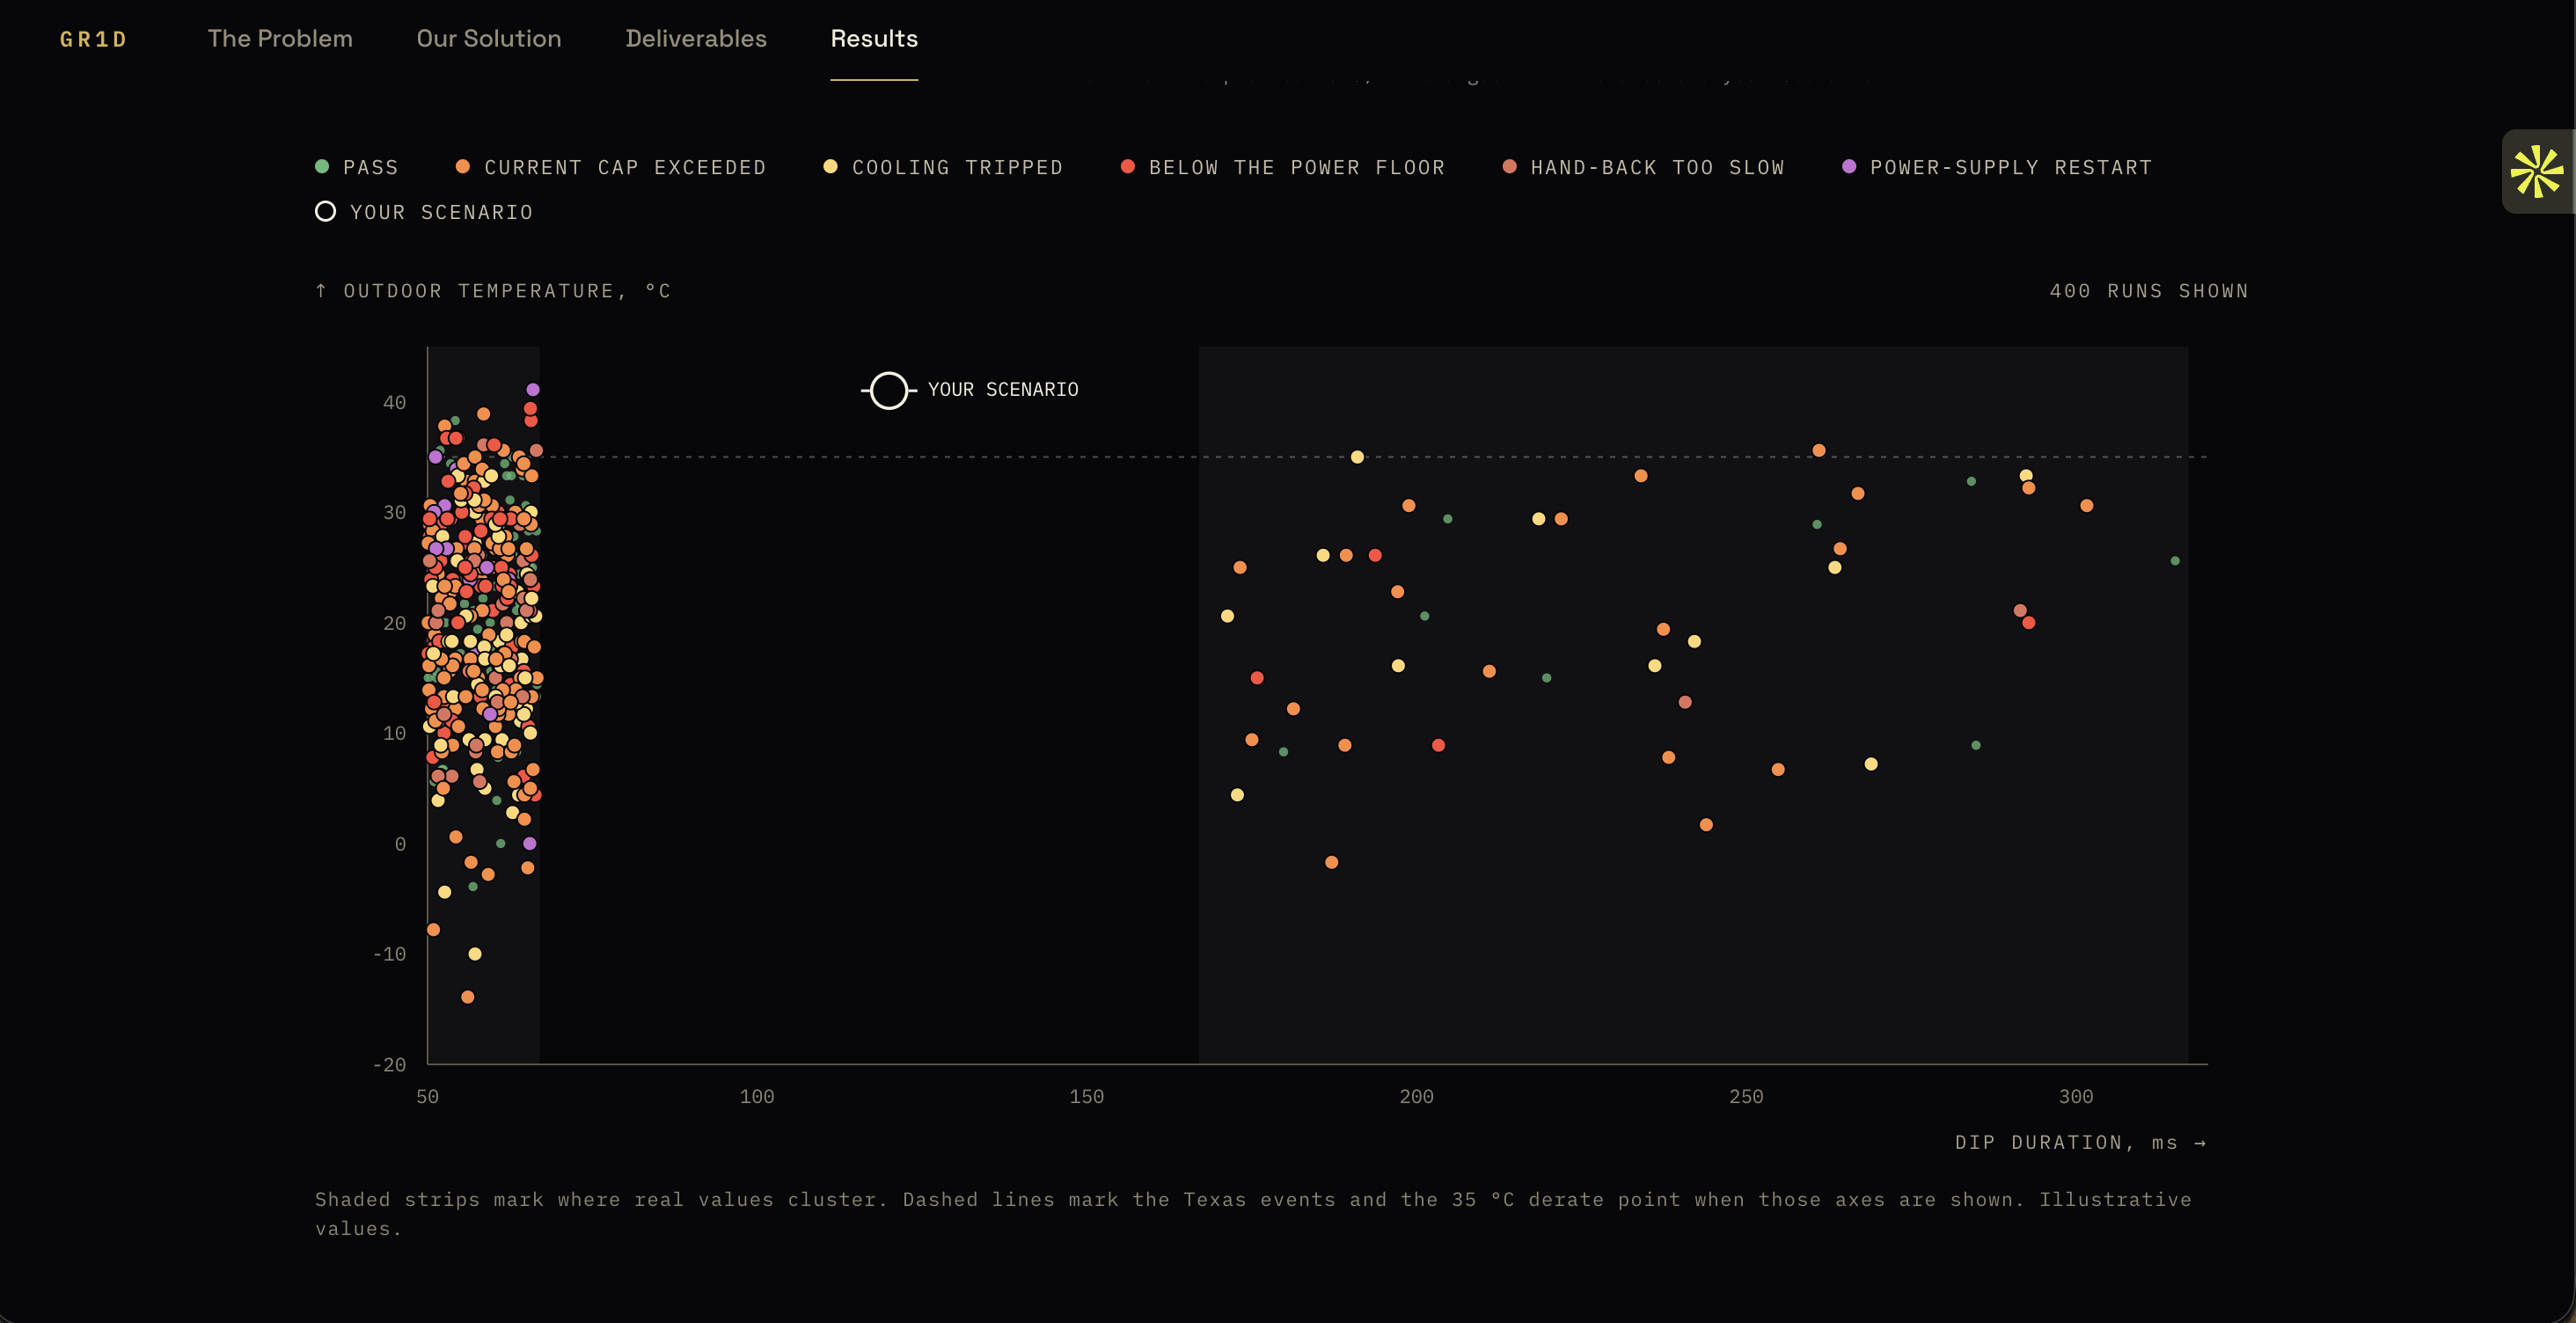
- the distinct ways the facility fails
- a ranking of which factors matter most
- the smallest fixes
- a separate checklist of settings that commonly mismatch between the design and the real equipment
How we built it
- Distributions for the real world. We built probability distributions for the grid conditions a data center sees and for hardware variation (battery state, converter limits, capacitor aging, power supply hold-up, cooling drive behavior), calibrated to ERCOT data.
- A Bayesian network over shared drivers. Many factors move together because they share causes such as temperature, load level, and equipment age. We model those drivers and let each factor respond to them, so the covariance between factors is
$$\Sigma_F = S\,\Sigma_D\,S^\top + \sigma^2 I$$
where $S$ maps drivers to factors and $\Sigma_D$ is the driver covariance. This is the linearized version of "draw the driver once and let the physics read it."
- A physics simulator in OpenModelica. We could not get a PSCAD license, so we built the simulator on open tools. The simulator computes derived quantities (for example, hold-up time falls as load rises) rather than us guessing them.
- A neural surrogate. We train a network on simulator runs so we can test thousands of scenarios quickly. [Add surrogate accuracy against the simulator.]
- A failure hunt and sensitivity analysis. We search for failing scenarios, then compute total-order Sobol indices with bootstrap intervals to rank what drives failure.
Early sensitivity results for IT-load failure: power supply loading (0.59, interval 0.47 to 0.70) and restart surge (0.37, interval 0.29 to 0.49) lead, followed by rail droop and board undervoltage thresholds. Capacitor age, battery charge, and backup failure rate were near zero over the ranges we tested. [Update with final numbers.]
Challenges
- No PSCAD. The industry tool is licensed, so we had to build a defensible open simulator instead.
- Two networks that did not agree. Our factor network and our simulator network used different conventions for load, hold-up time, and equipment age. Integrating them meant auditing each link and removing quantities the simulator already derives.
- Evidence. Many hardware parameters are not published. We graded every input as measured, published spec, general practice, or assumed, so the report shows what each result rests on.
- Honest uncertainty. Some of our rankings overlap within their intervals, and we report them that way.
What we learned
The biggest differences between real events were in design and logic choices (for example, how many dips a transfer scheme counts before switching), not in smoothly varying parameters. A model that only varies numbers misses them, so we include categorical design choices as scenario axes.
What's next
- Add a sag-counting transfer node to the simulator
- Validate against the 2024 Virginia event and ERCOT events
- Update to the final ERCOT rule text
- Replace assumed inputs with measured ones, starting with the highest-ranked factors

Log in or sign up for Devpost to join the conversation.