-
-
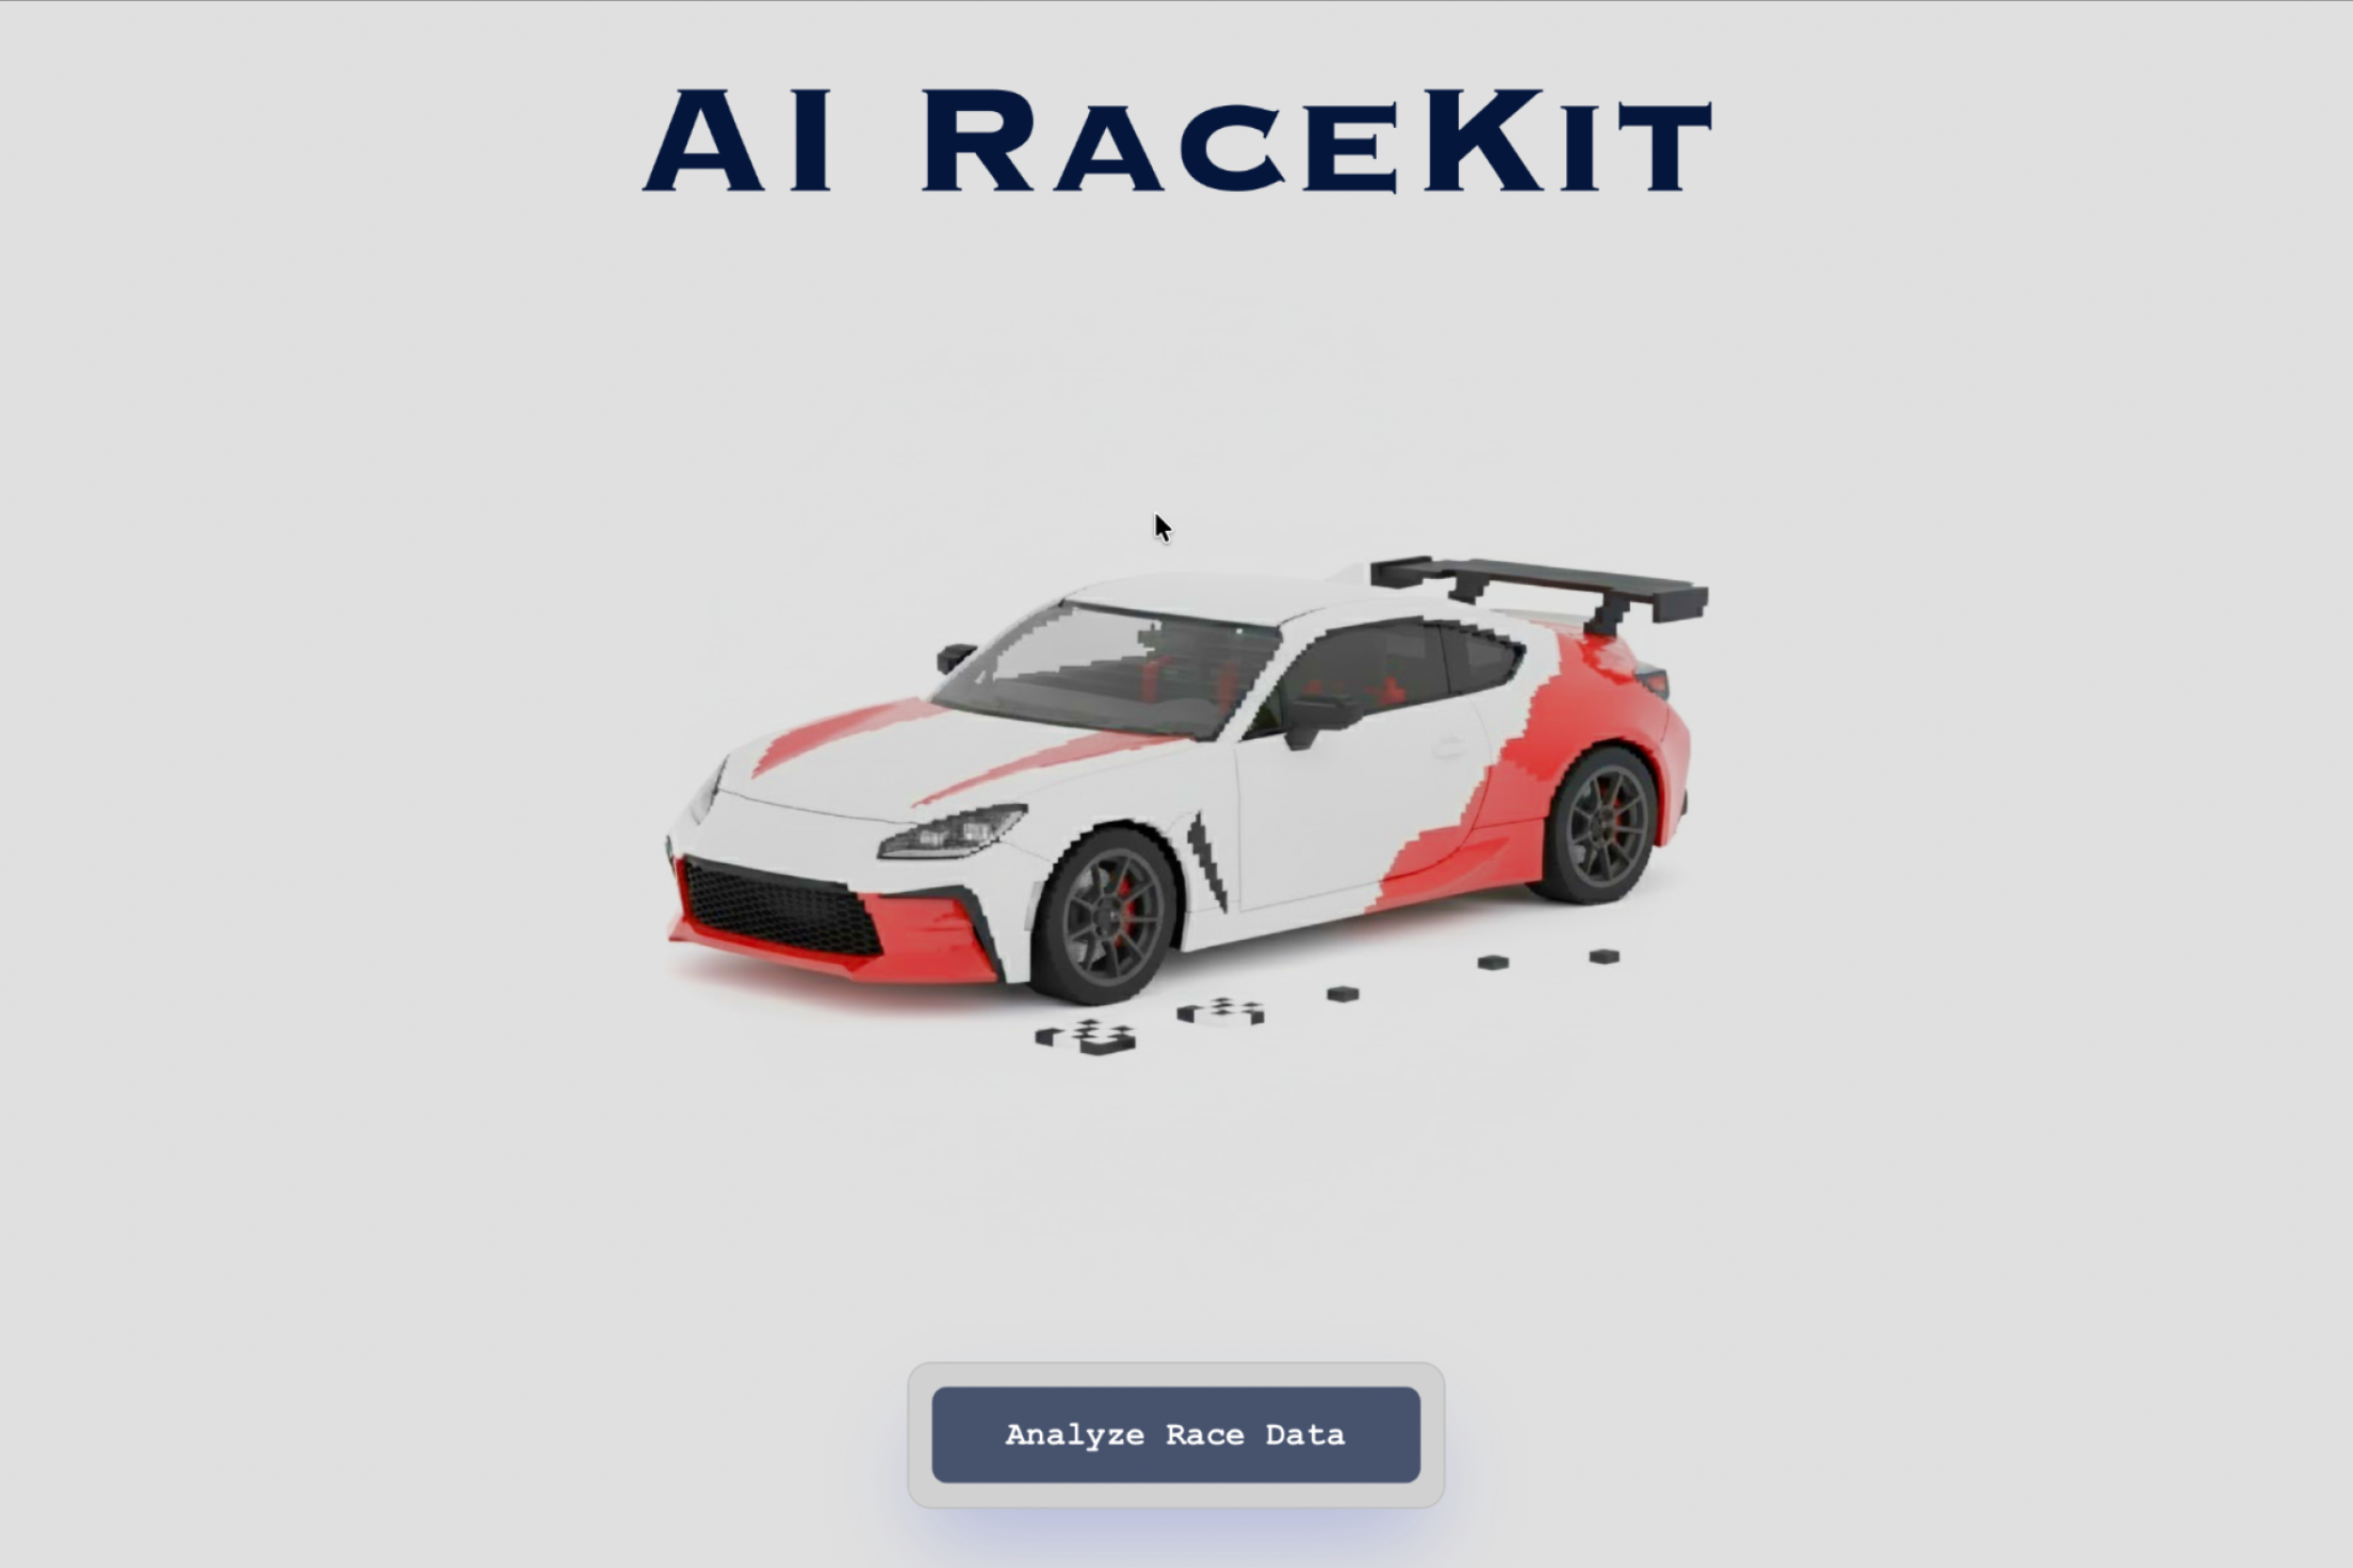
Landing Page
-
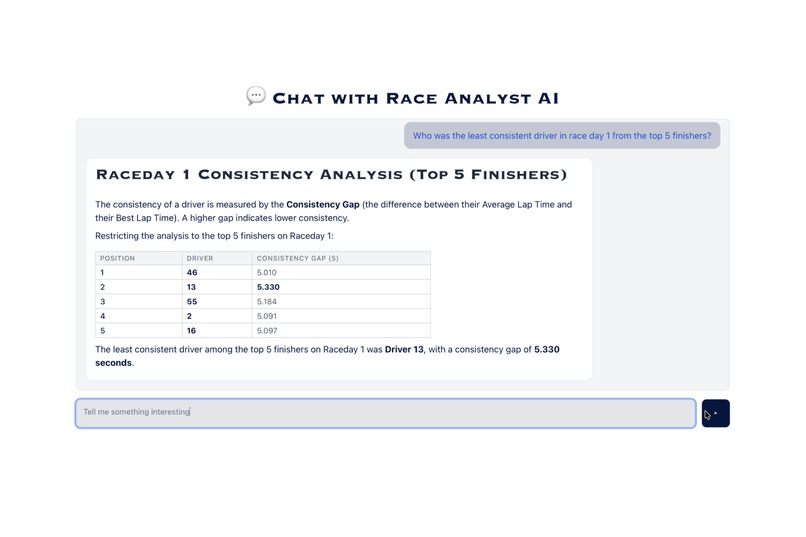
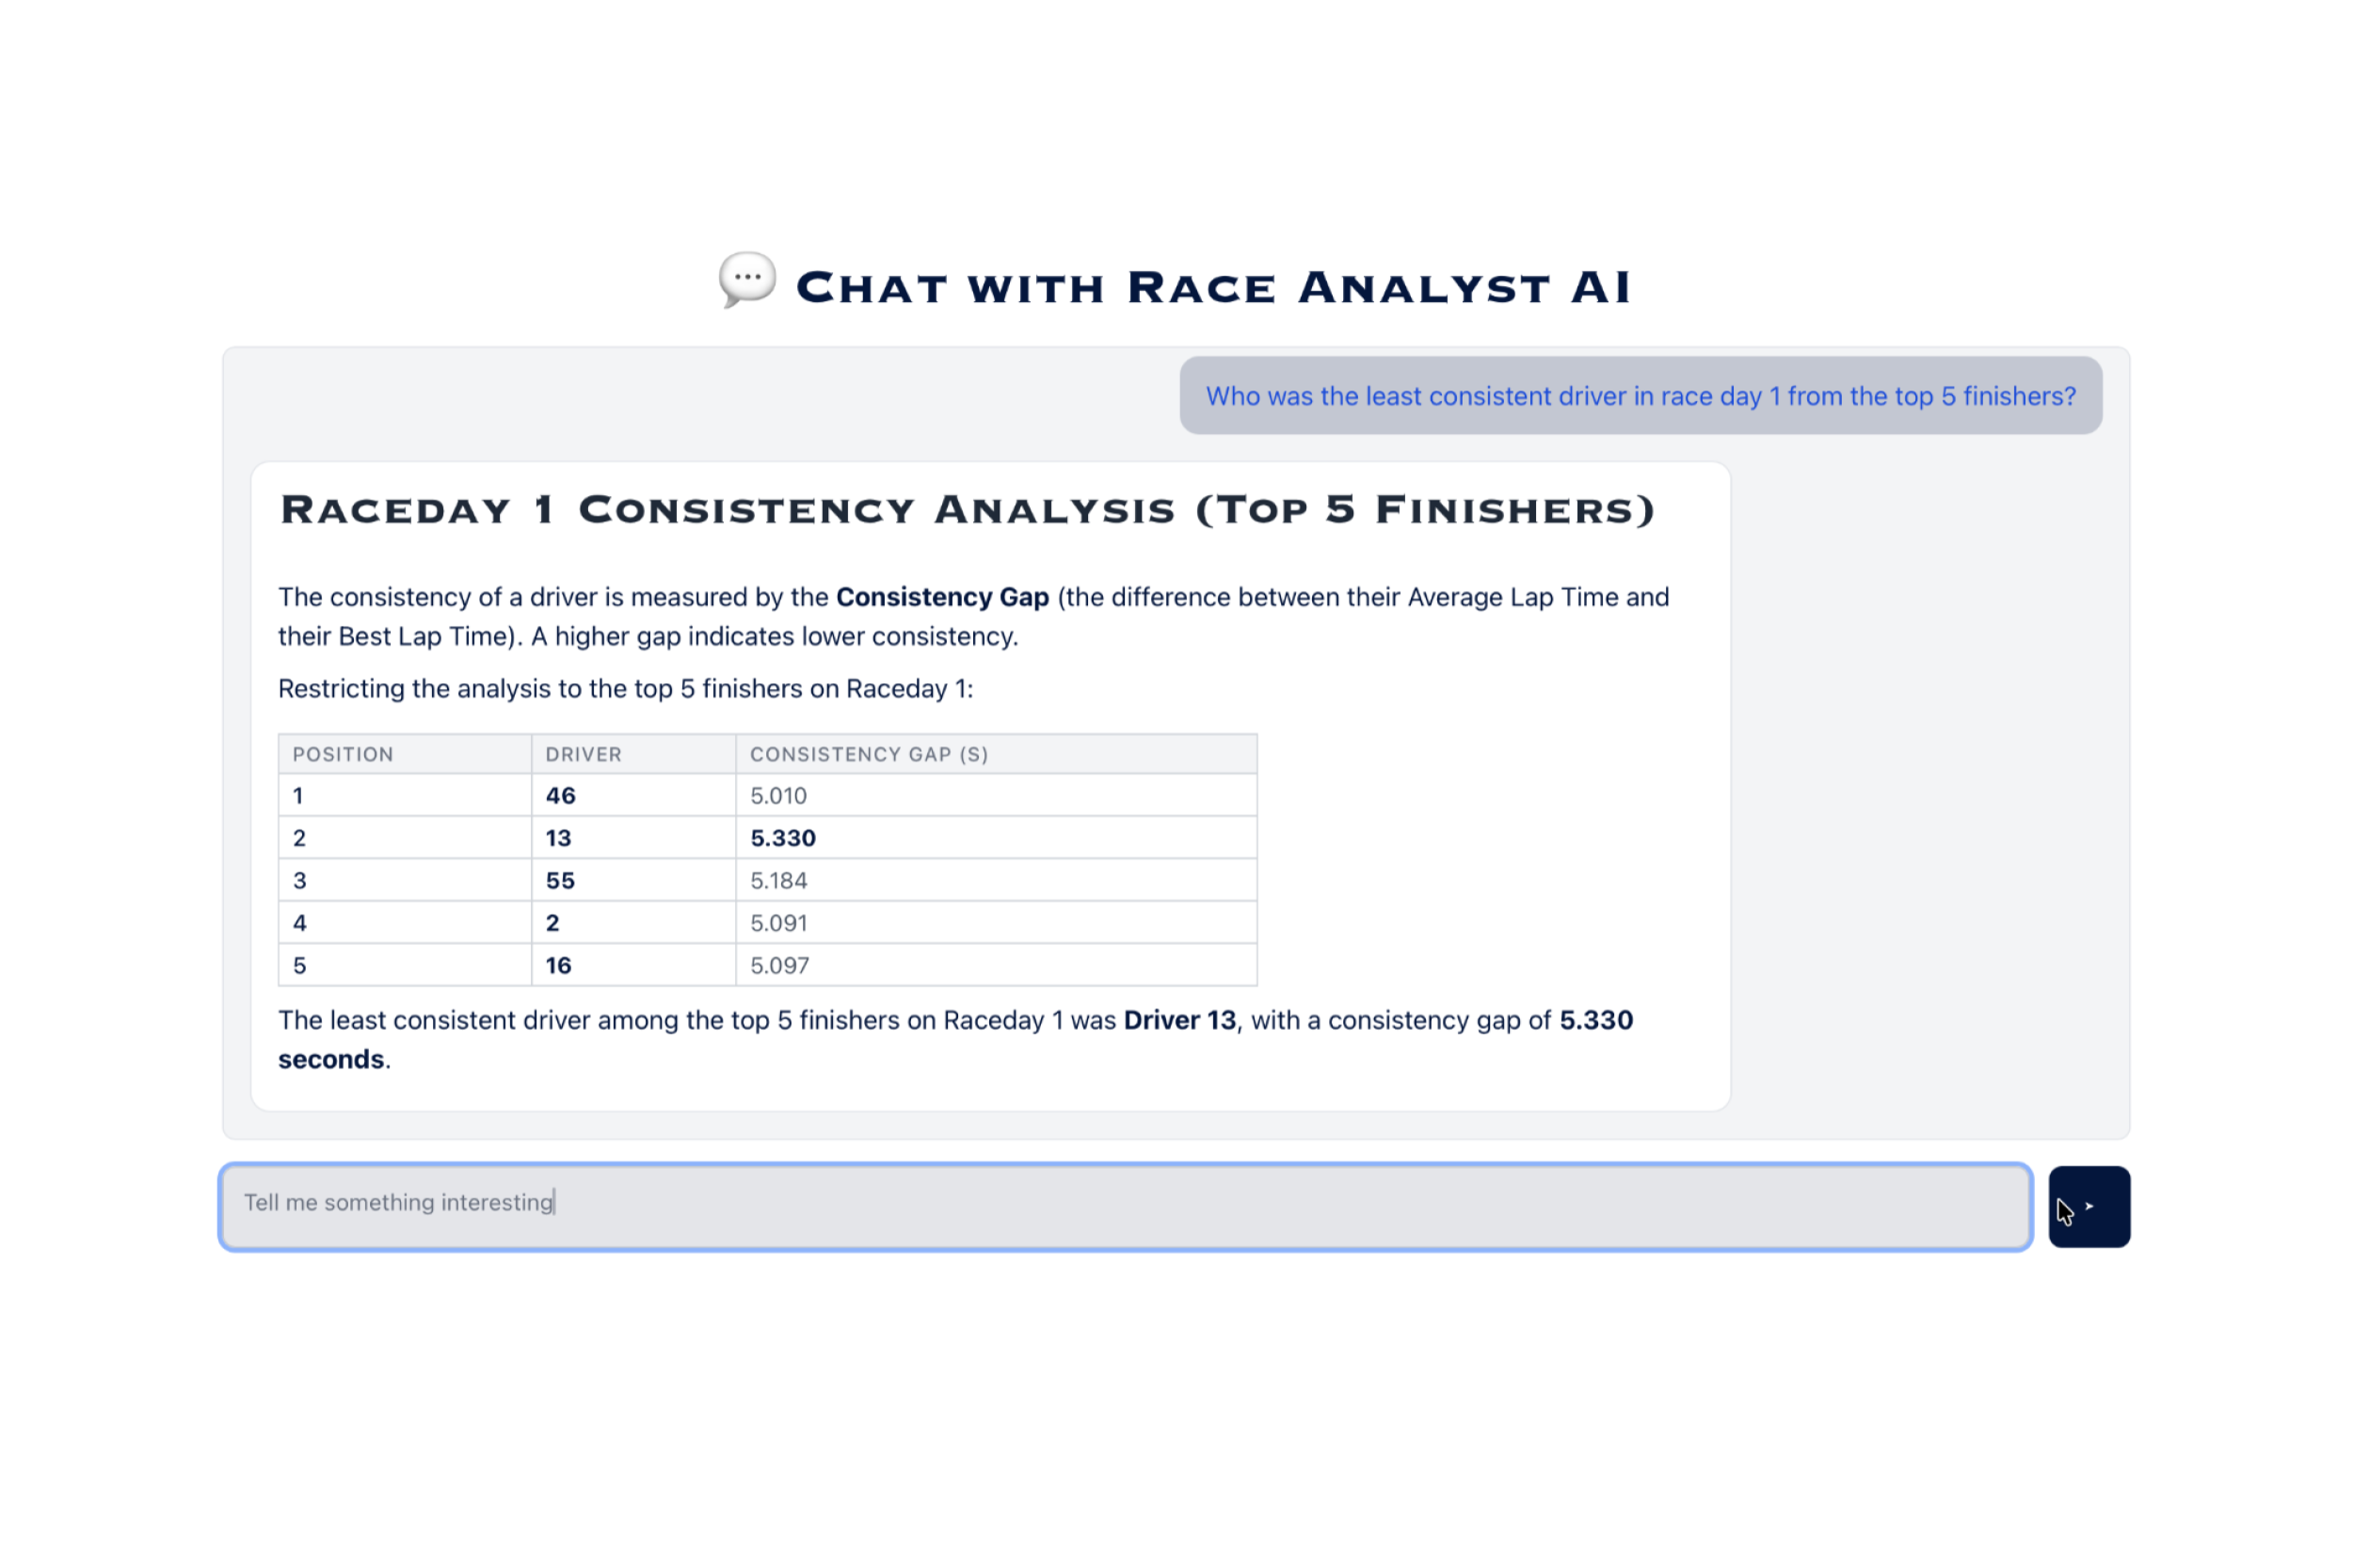
Chat
-
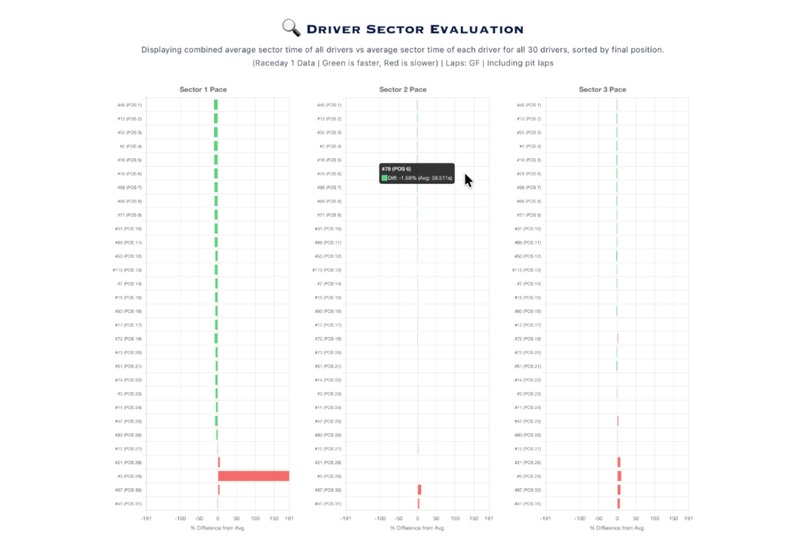
Driver Sector Evaluation
-
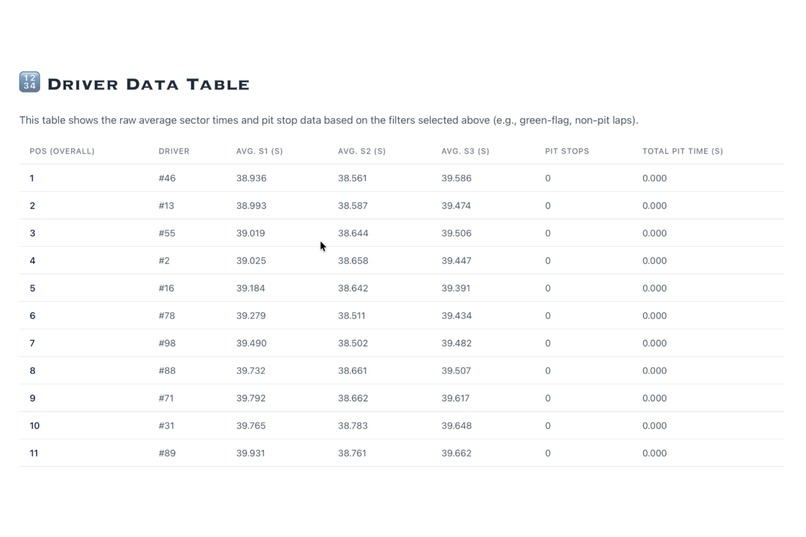
Driver Data Table
-
Theoretical Race
-
Race Position vs. Pace (Over/Underperformers)
-
Consistency Analysis
-

Pace Degradation (Stint Analysis)
-
Costly Mistake Analysis (Worst Lap Delta)
-
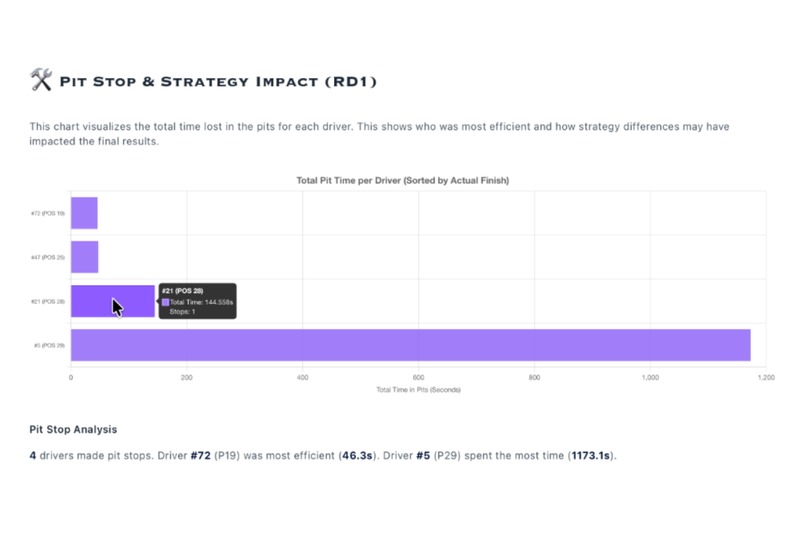
Pit Stop & Strategy Impact
-

Sector "Fingerprint" / Strength Profile
-
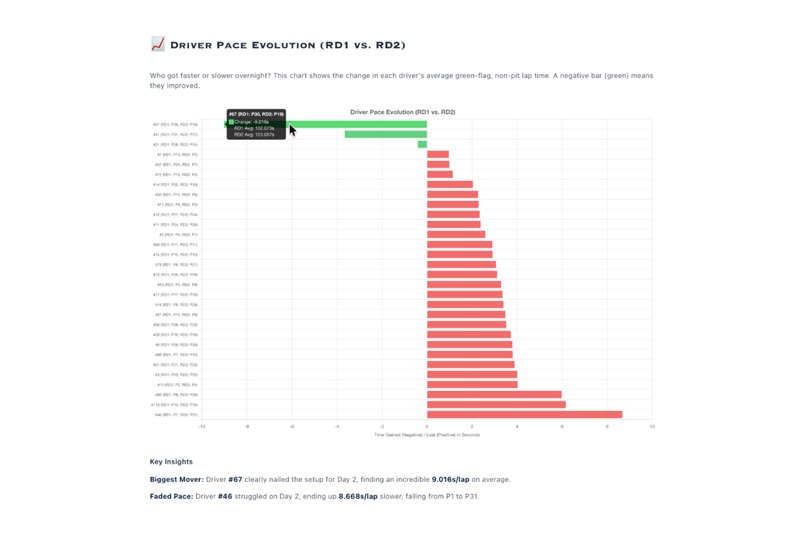
Driver Pace Evolution
-

Consistency Delta
-
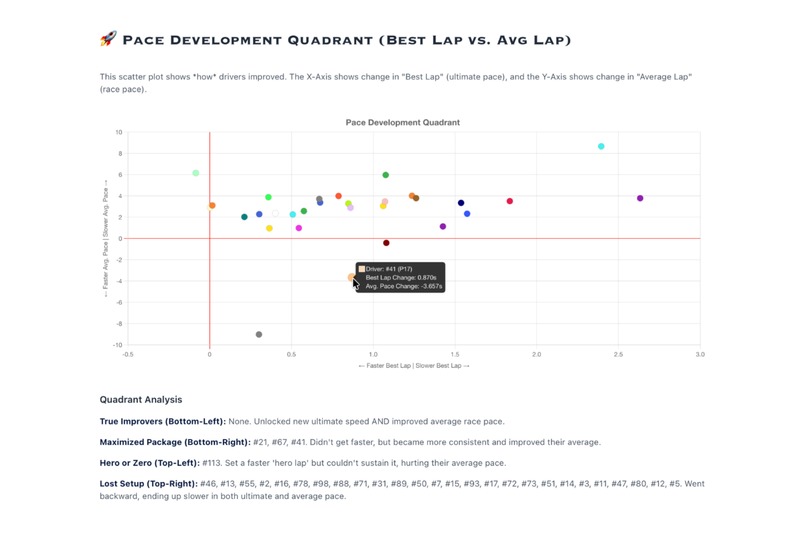
Pace Development Quadrant (Best Lap vs. Avg Lap)
-
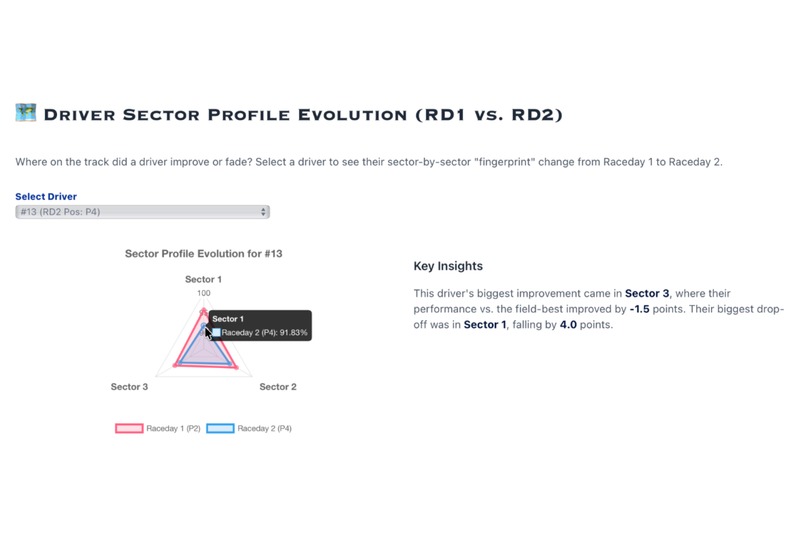
Driver Sector Profile Evolution
-
Racecraft Delta (Over/Underperformance Shift)
-
Track Lap Simulator


Inspiration
Standard race analysis only gives you a surface level insight into race data. I was inspired to build a tool that does an AI analysis to provide a different prespective at race data analytics. Not only did I want simple graphs and text to look at, I also wanted to be able to talk to the data and ask things about it.
A few problems I noticed:
- There's no simple way to "ask" the data questions directly.
- Fans and students of motorsports have no accessible way to explore data deeply.
- Insights are often locked behind complex software or expensive enterprise tools.
What it does
Solutions
- Conversational AI Interface
- AI-Driven Race Data Analysis
- Dynamic Graphs and Charts
- Accessible (Free + No Installation)
AI RaceKit is a powerful web-based analysis tool for motorsport enthusiasts and teams. A user uploads one or two race-day data files to generate an in-depth AI powered analysis, which you can also chat with.
Below is a list of all the available features/tools.
- 🔍 Evaluation
- 🔍 Driver Sector Evaluation: Calculations and display of combined average sector time of all drivers vs average sector time of each driver.
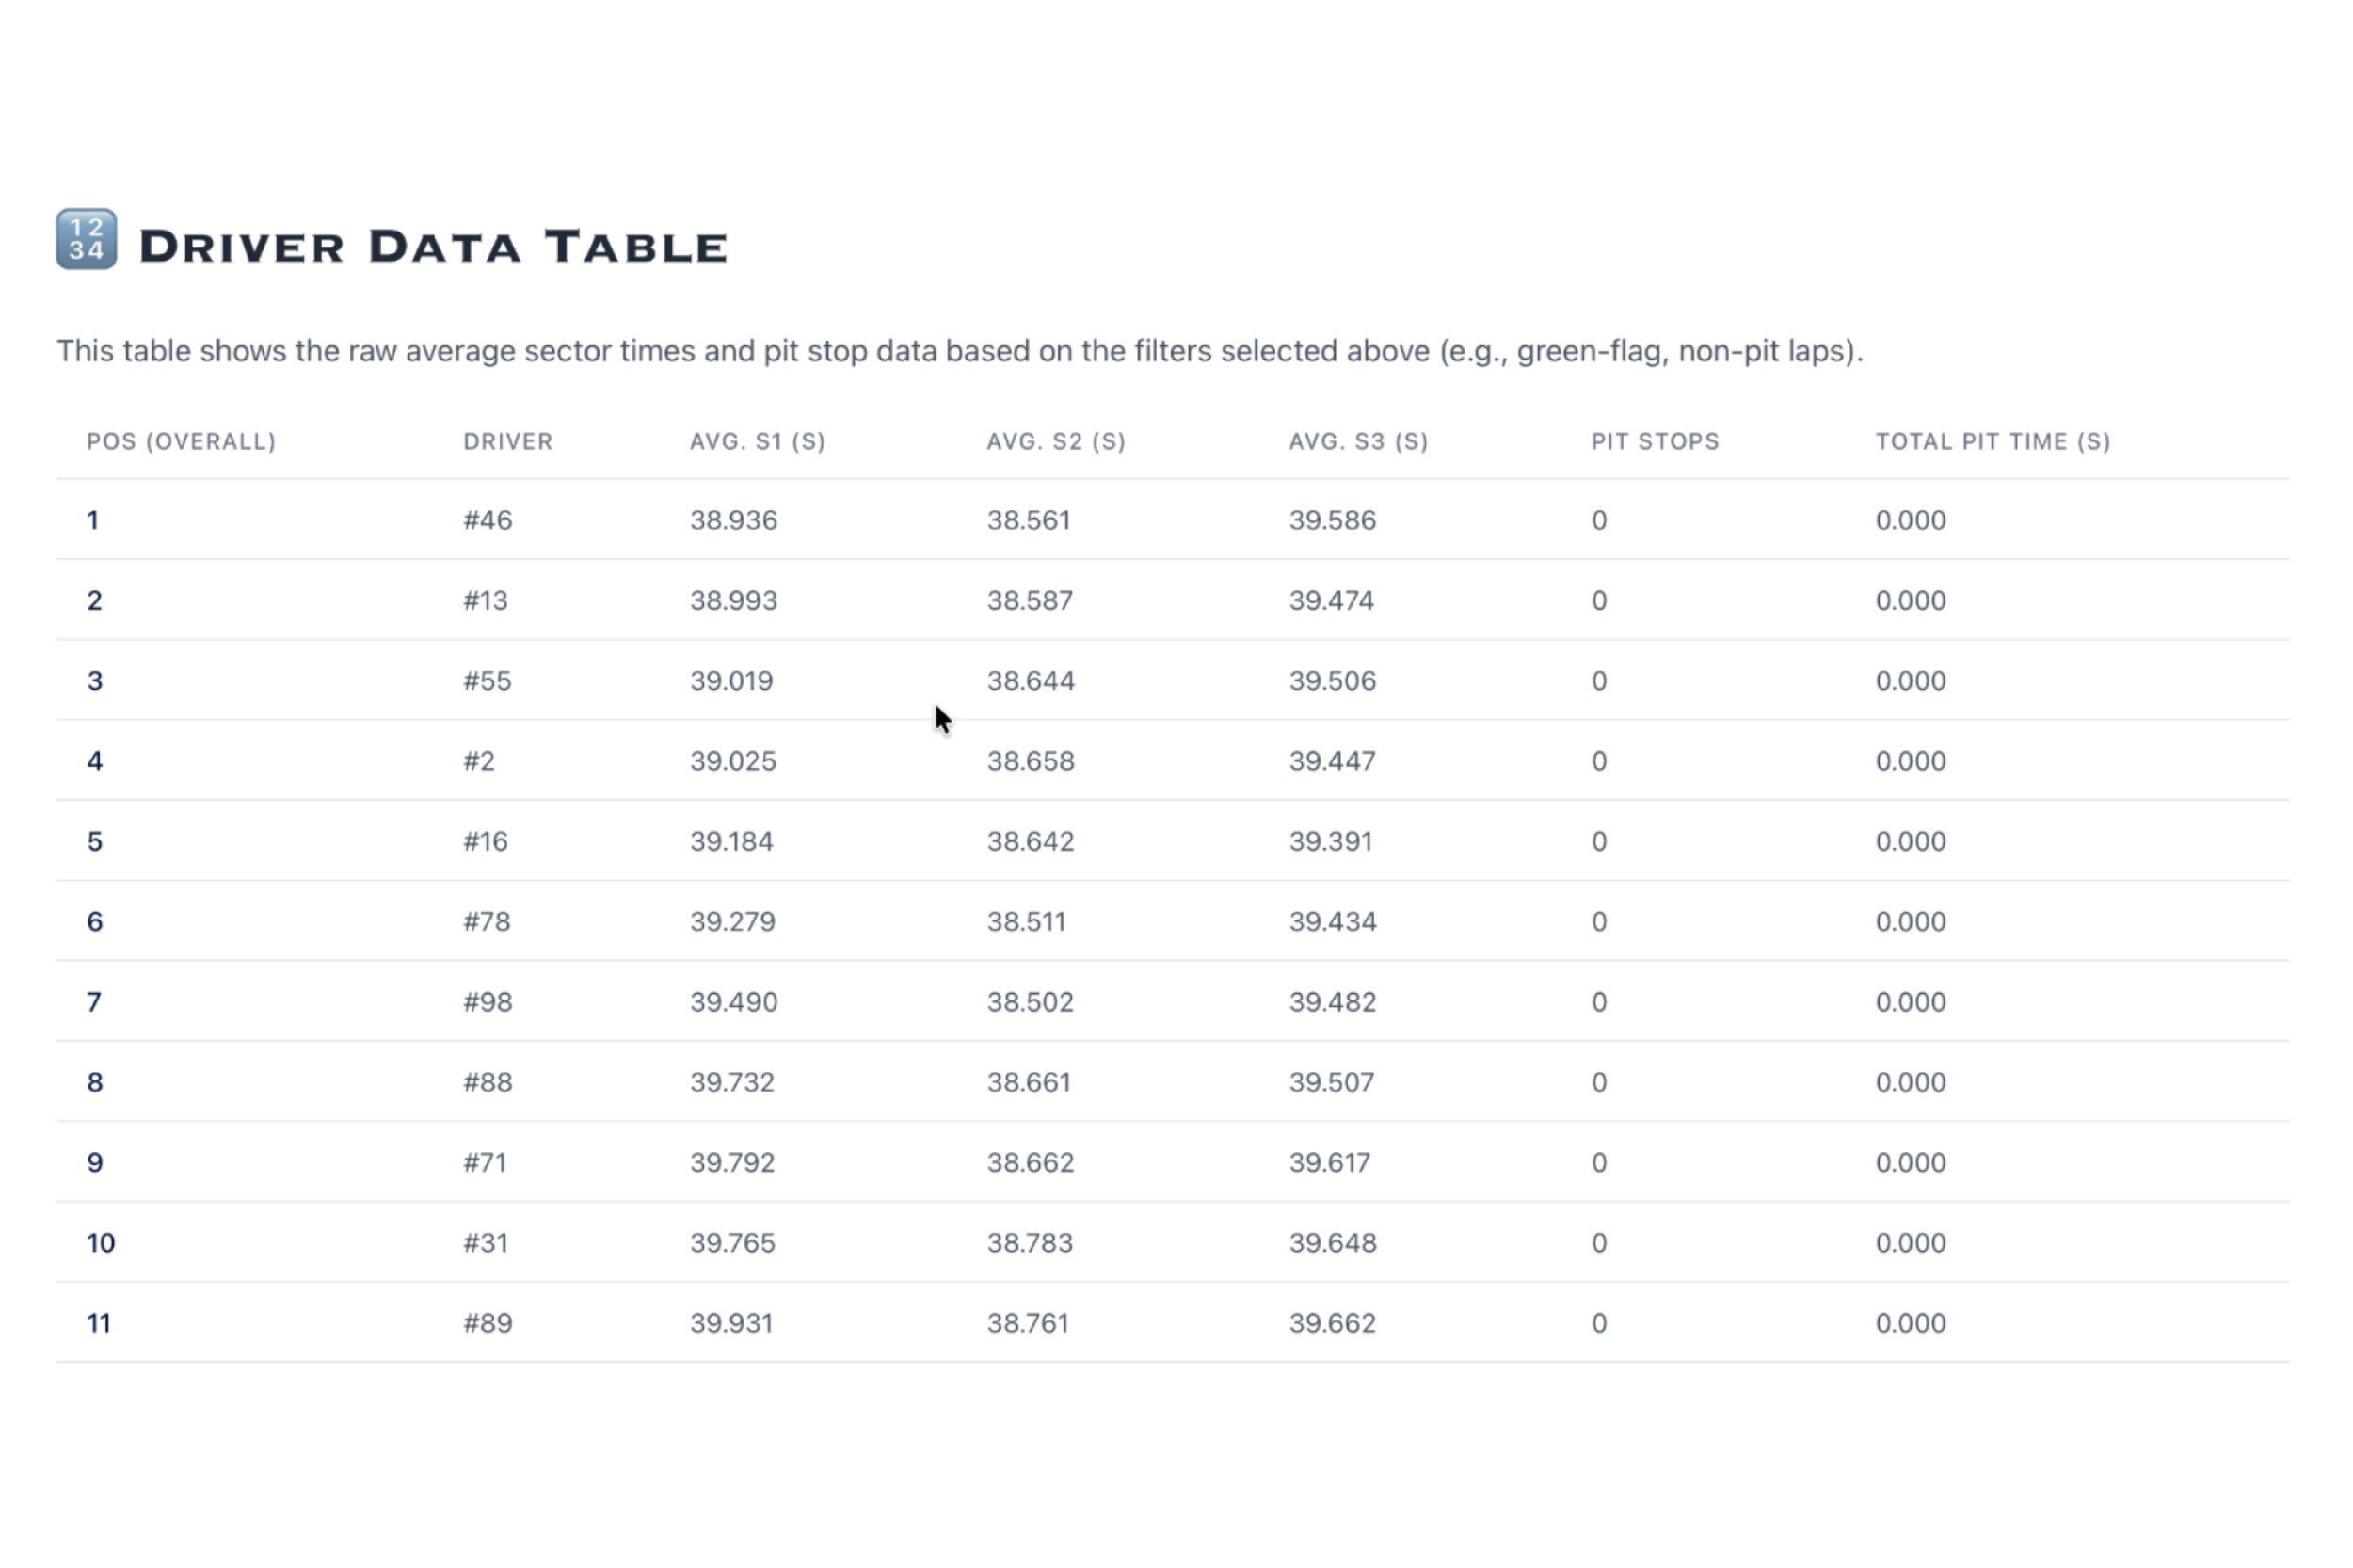
- 🔢 Driver Data Table: A data table with calculations displaying raw average sector times and pit stop data.
- 🔧 Tools: Options to filter evaluation by lap flags and an option to exclude pit stop laps.
- 📊 AI Analysis
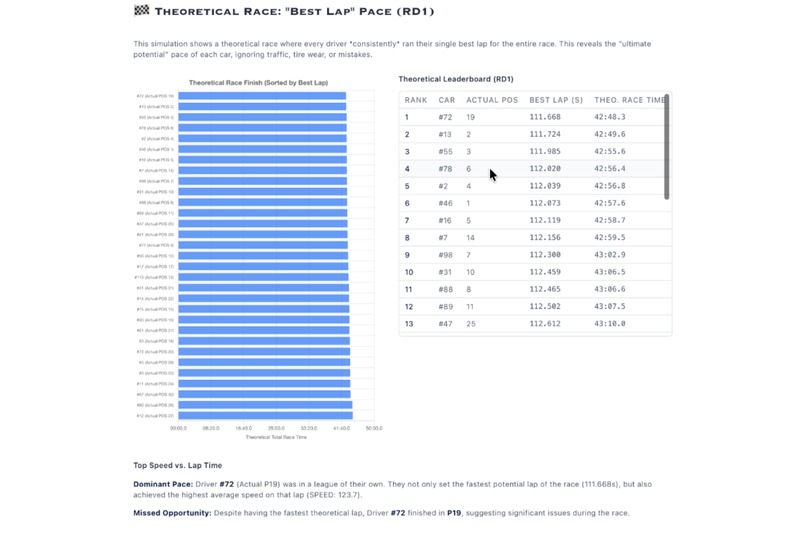
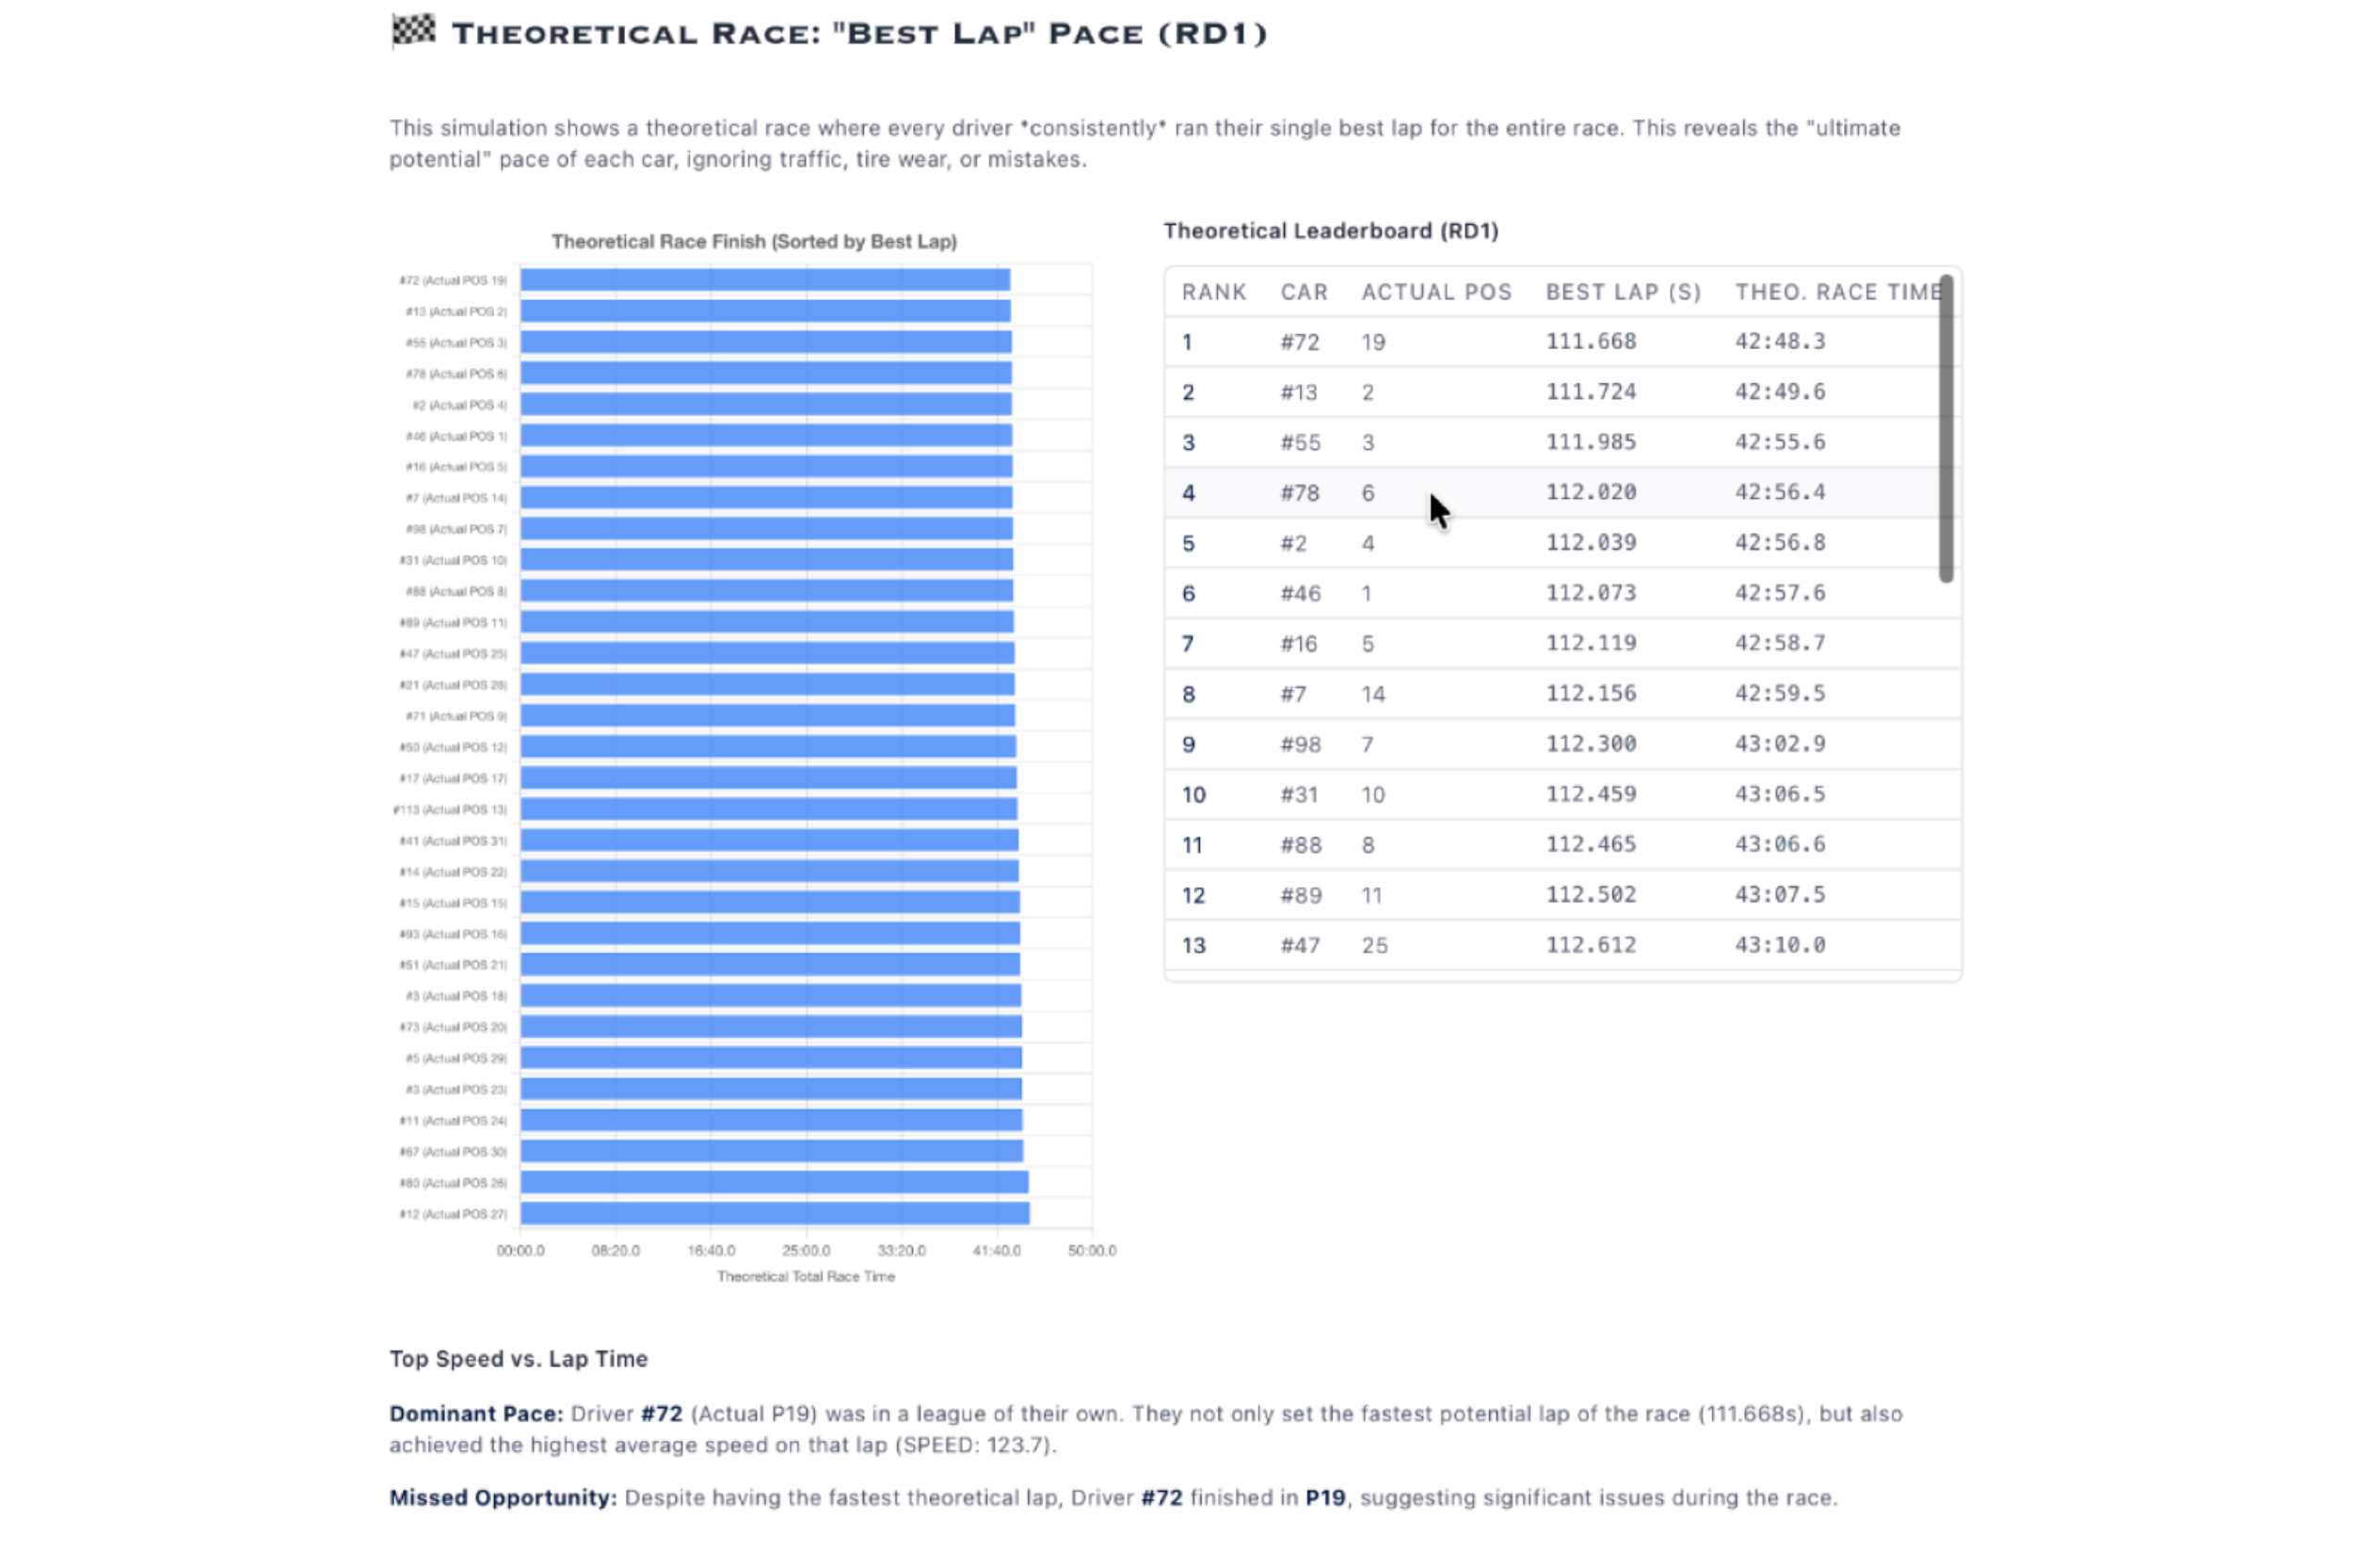
- 🏁 Theoretical Race: A simulated graph, insights, and leaderboard that shows a theoretical race where every driver consistently ran their single best lap for the entire race.
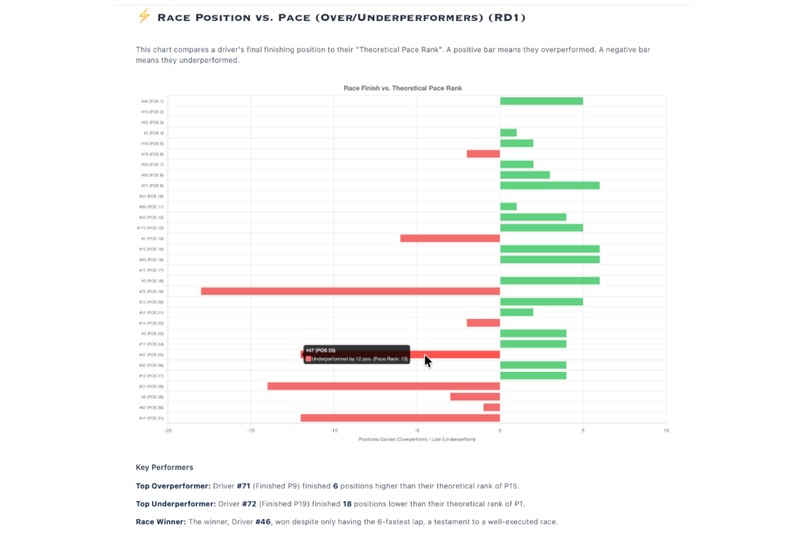
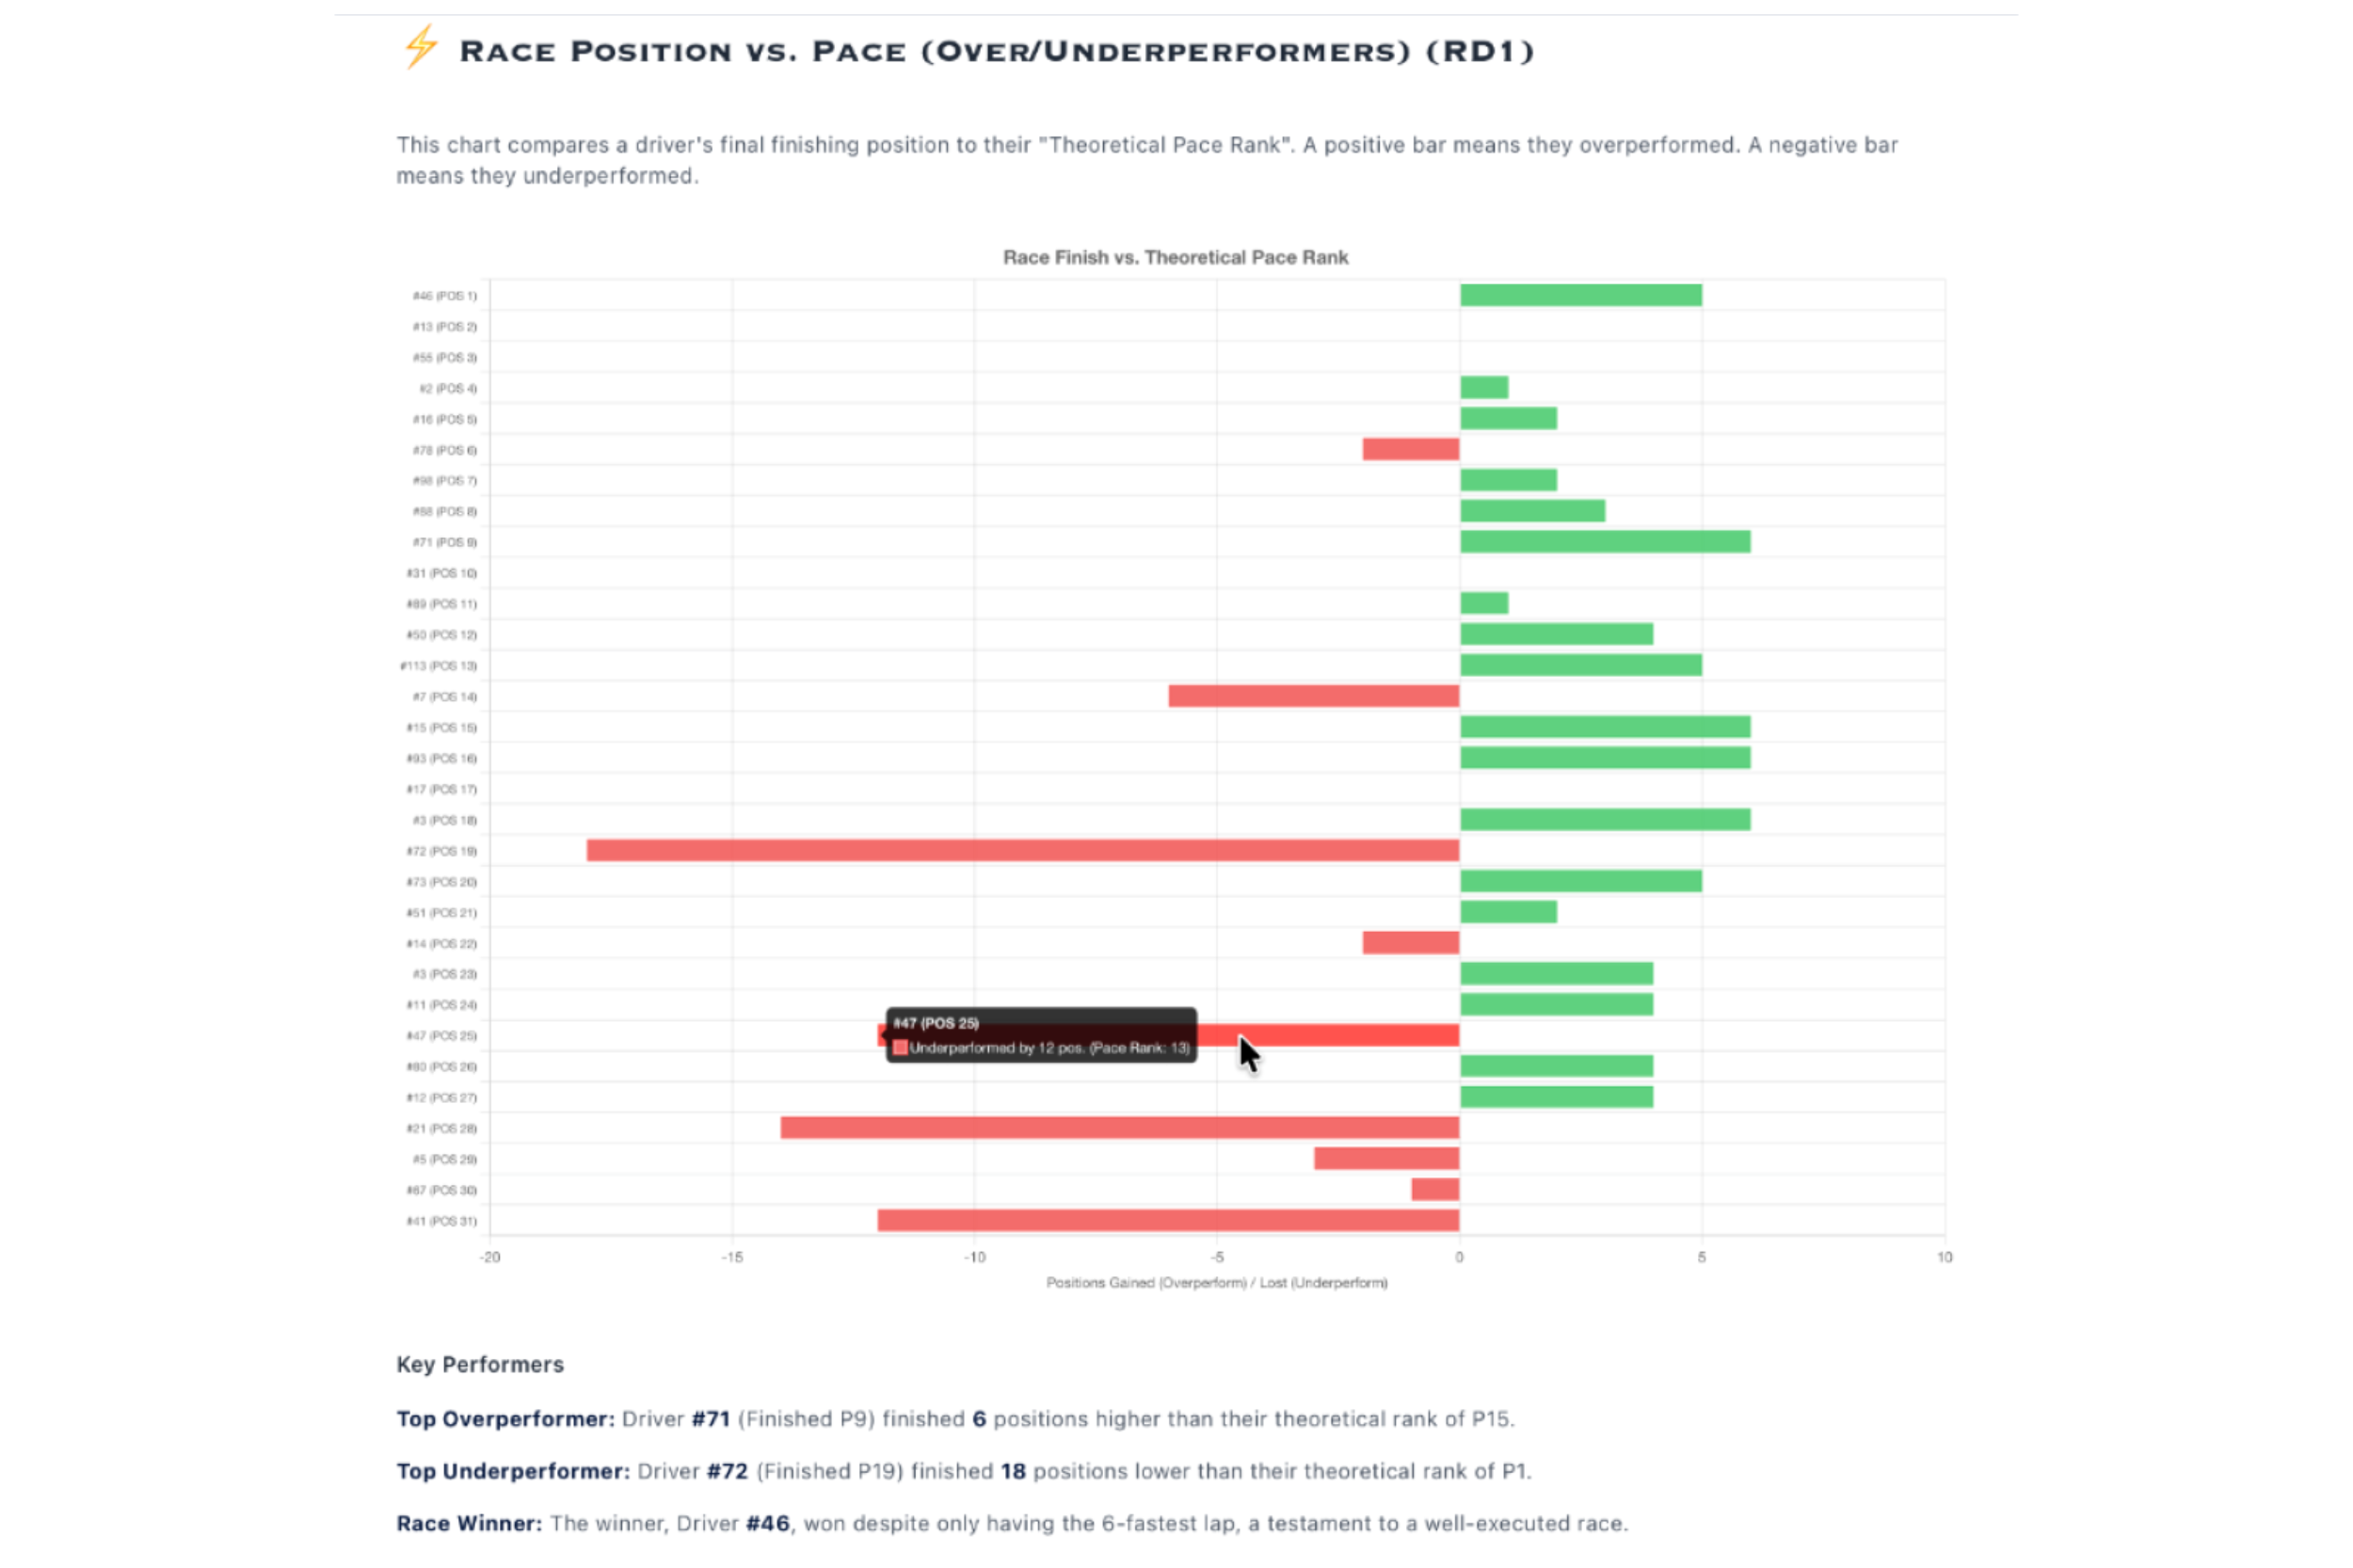
- ⚡️ Race Position vs. Pace (Over/Underperformers): A chart and insights that compares a driver's final finishing position to their "Theoretical Pace Rank" (where they should have finished based on their single fastest lap).
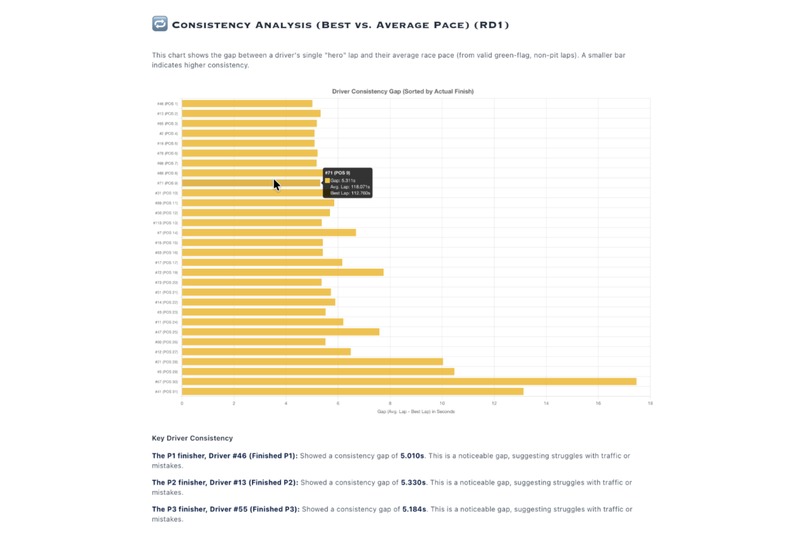
- 🔁 Consistency Analysis: A chart and insights that shows the gap between a driver's single "hero" lap and their average race pace (from valid green-flag, non-pit laps).
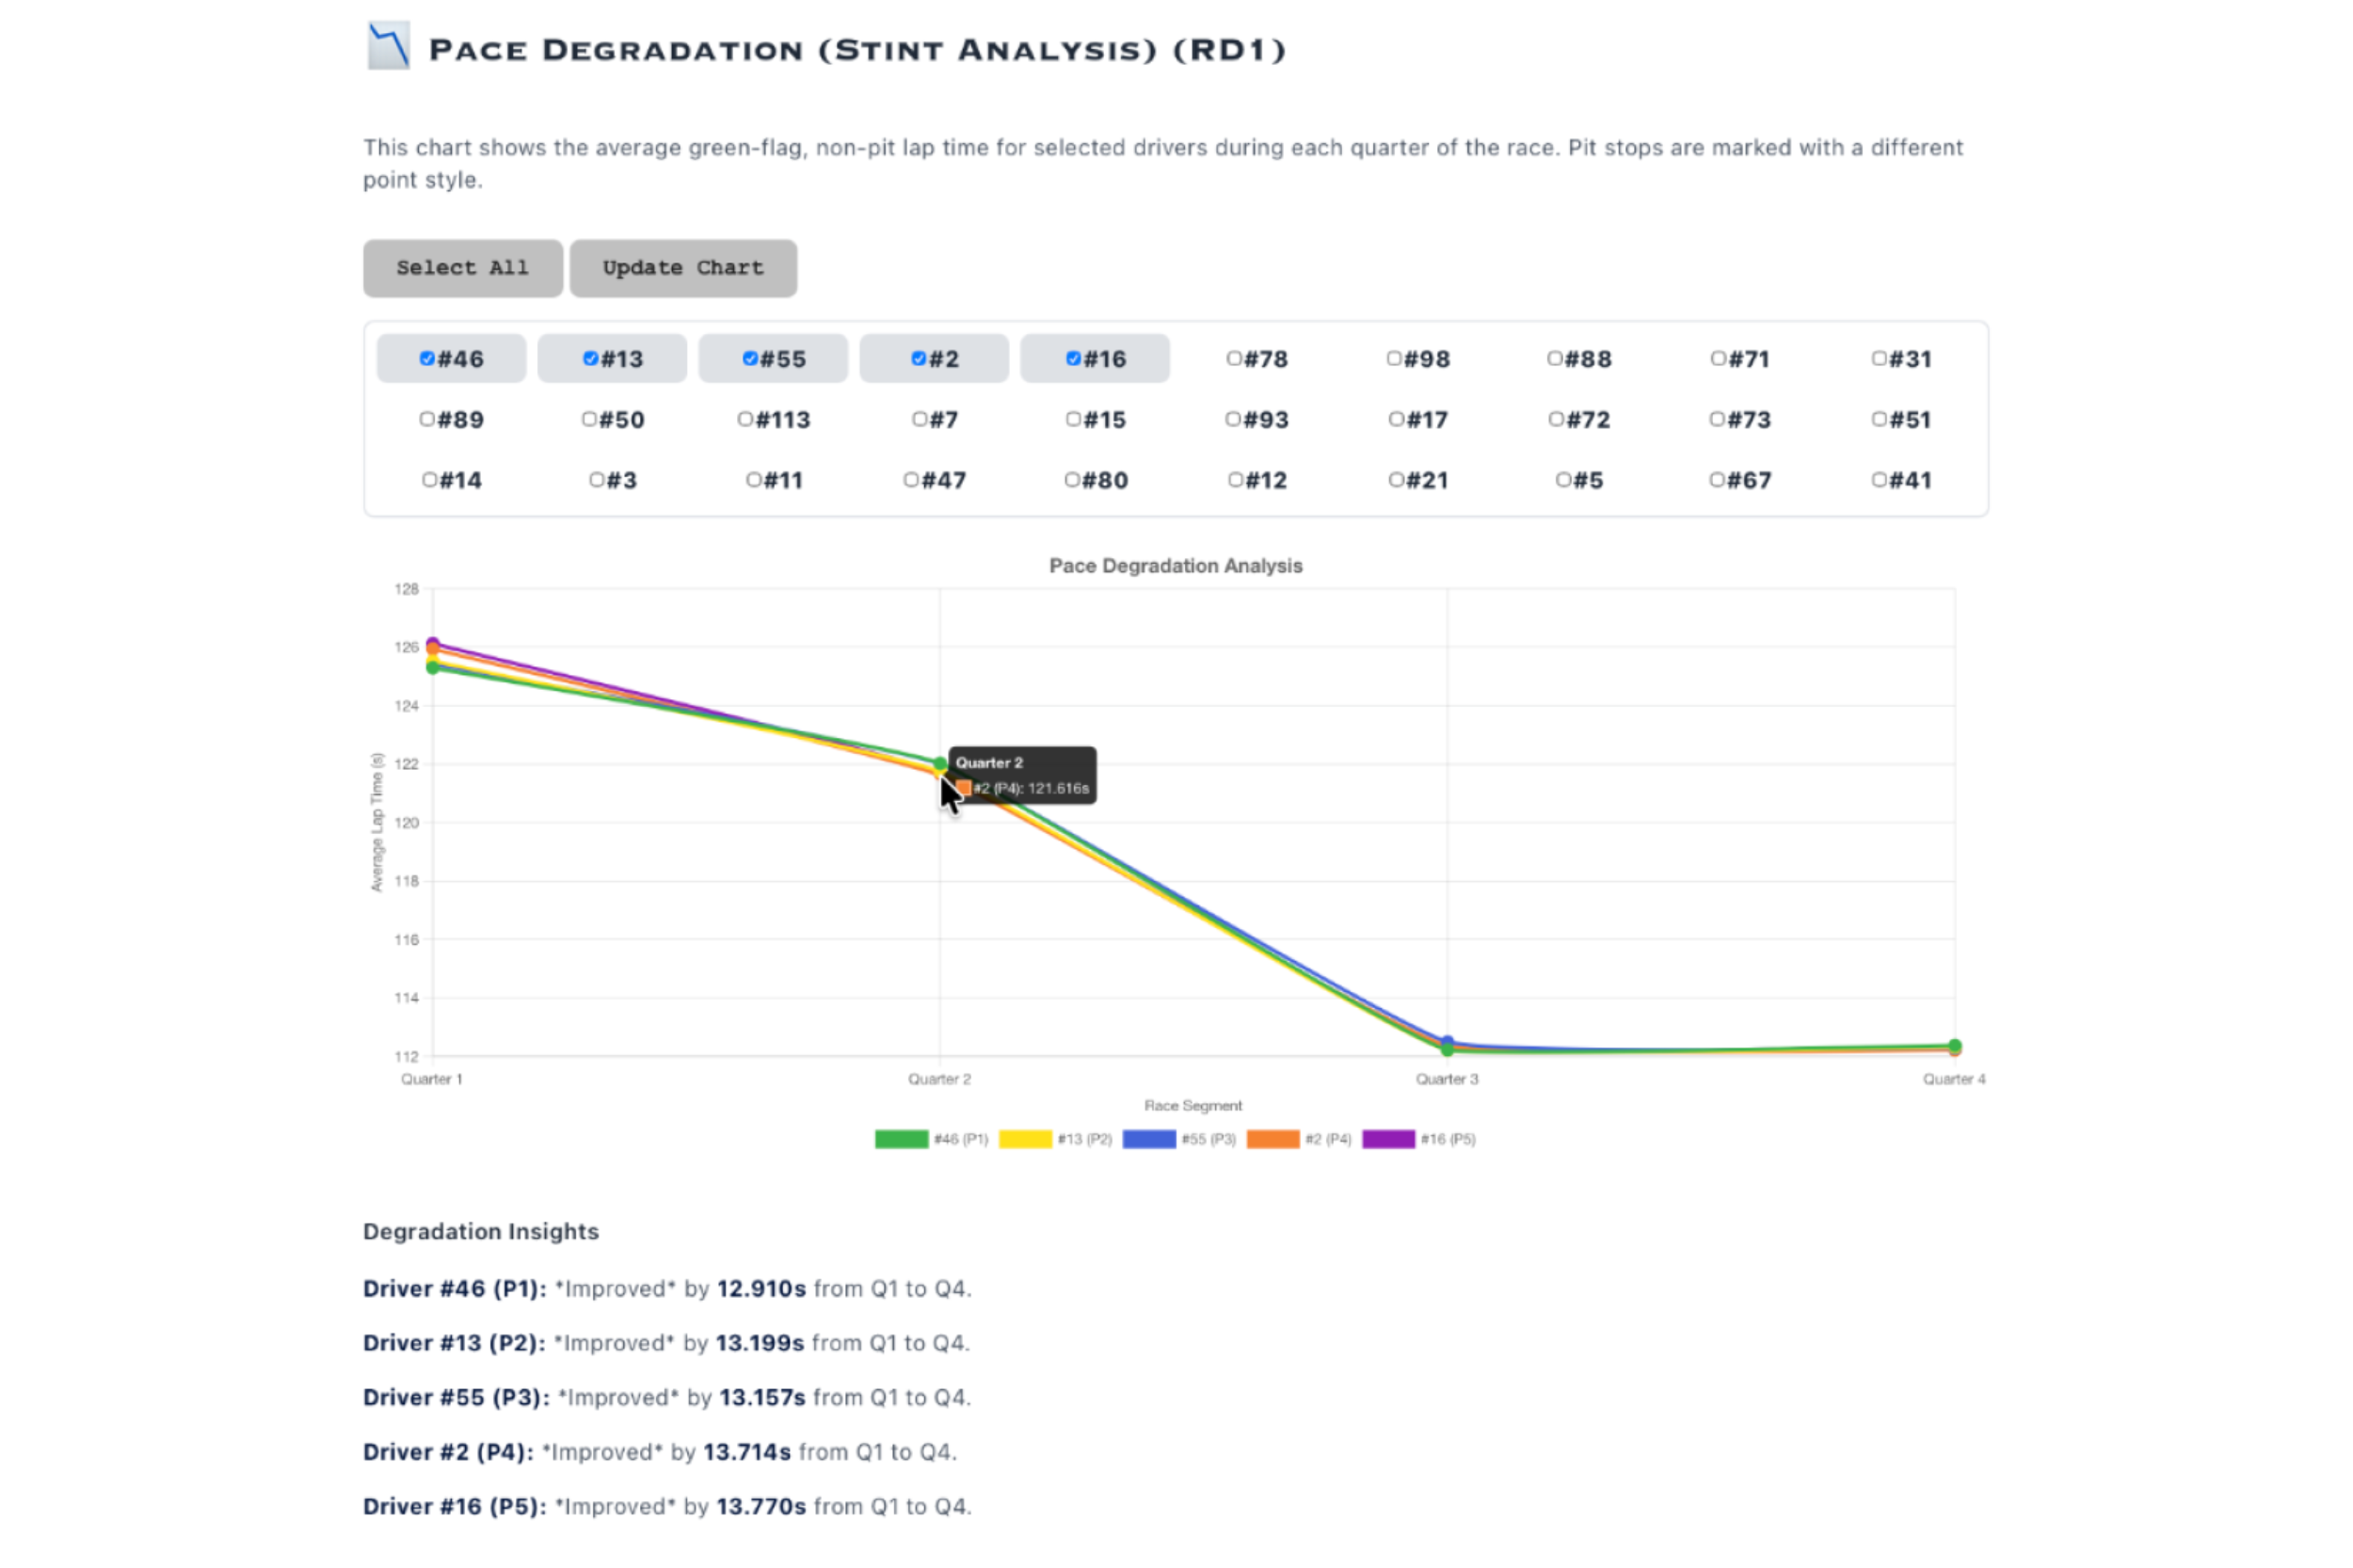
- 📉 Pace Degradation (Stint Analysis): A chart and insights that shows the average green-flag, non-pit lap time for selected drivers during each quarter of the race.
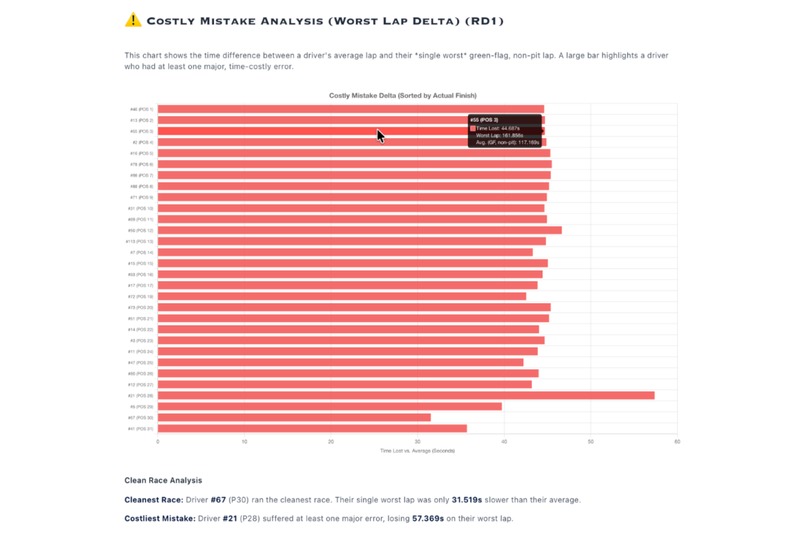
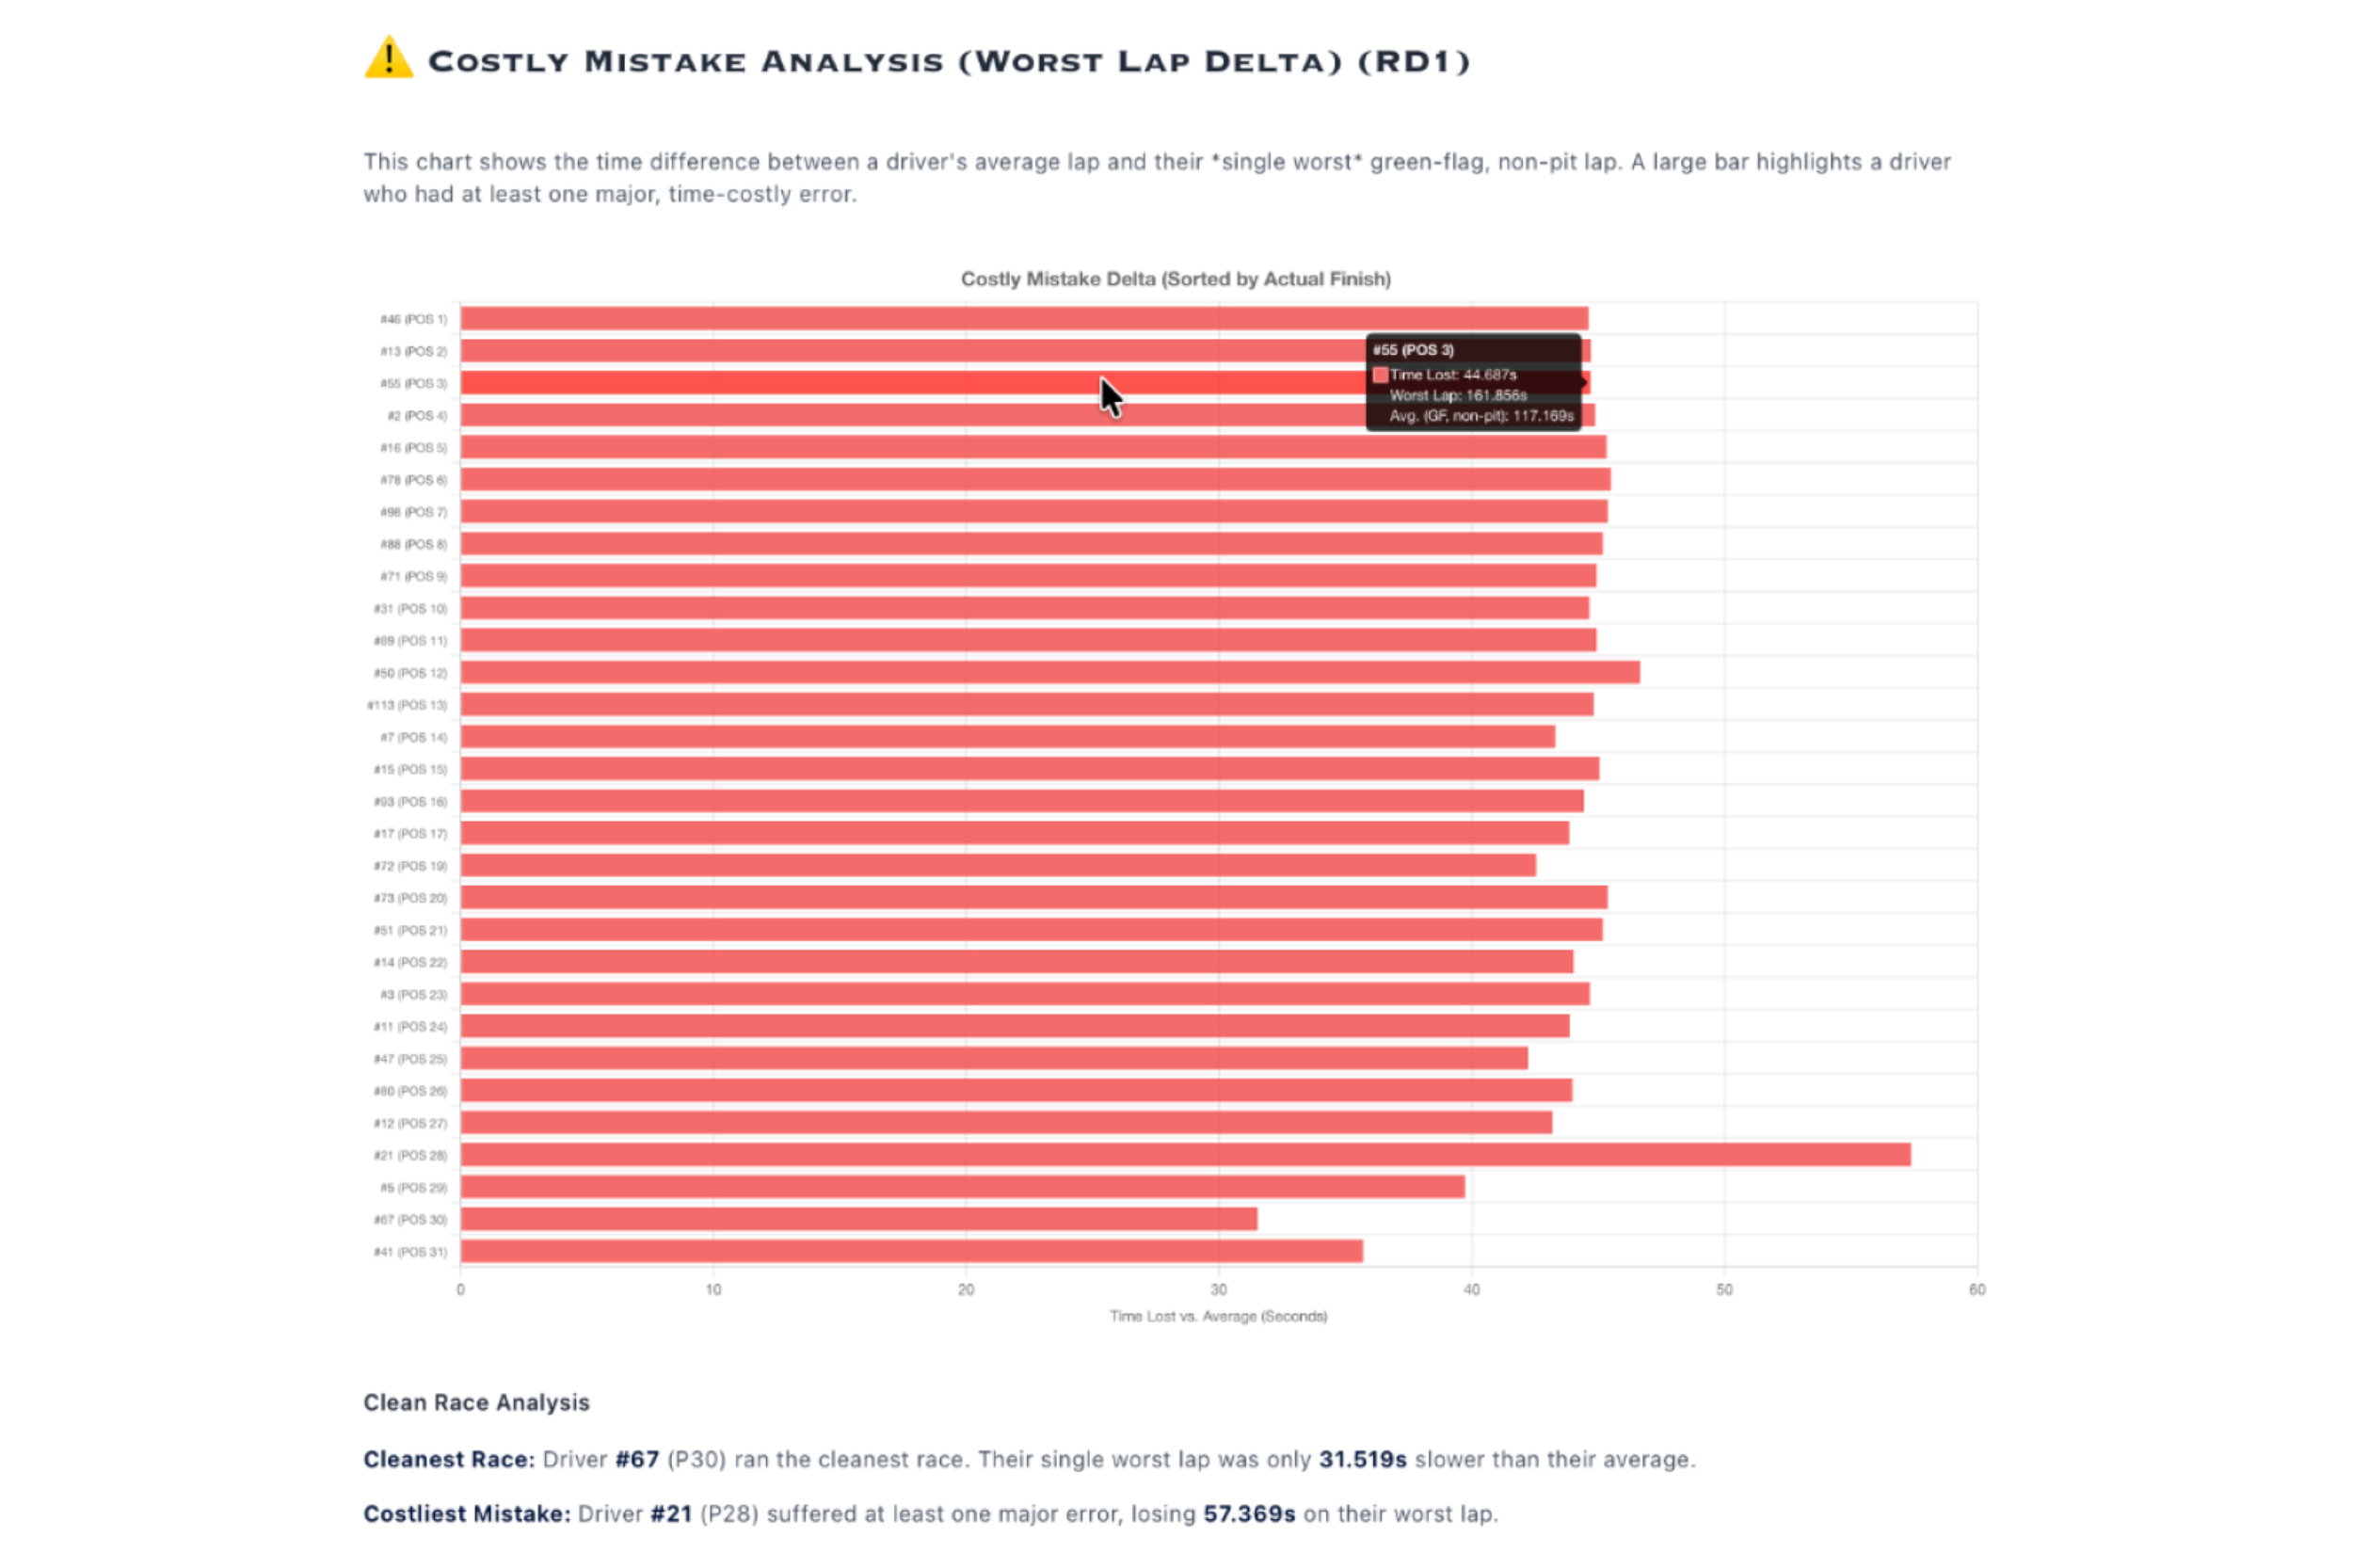
- ⚠️ Costly Mistake Analysis (Worst Lap Delta): A chart and insights that shows the time difference between a driver's average lap and their single worst green-flag, non-pit lap.
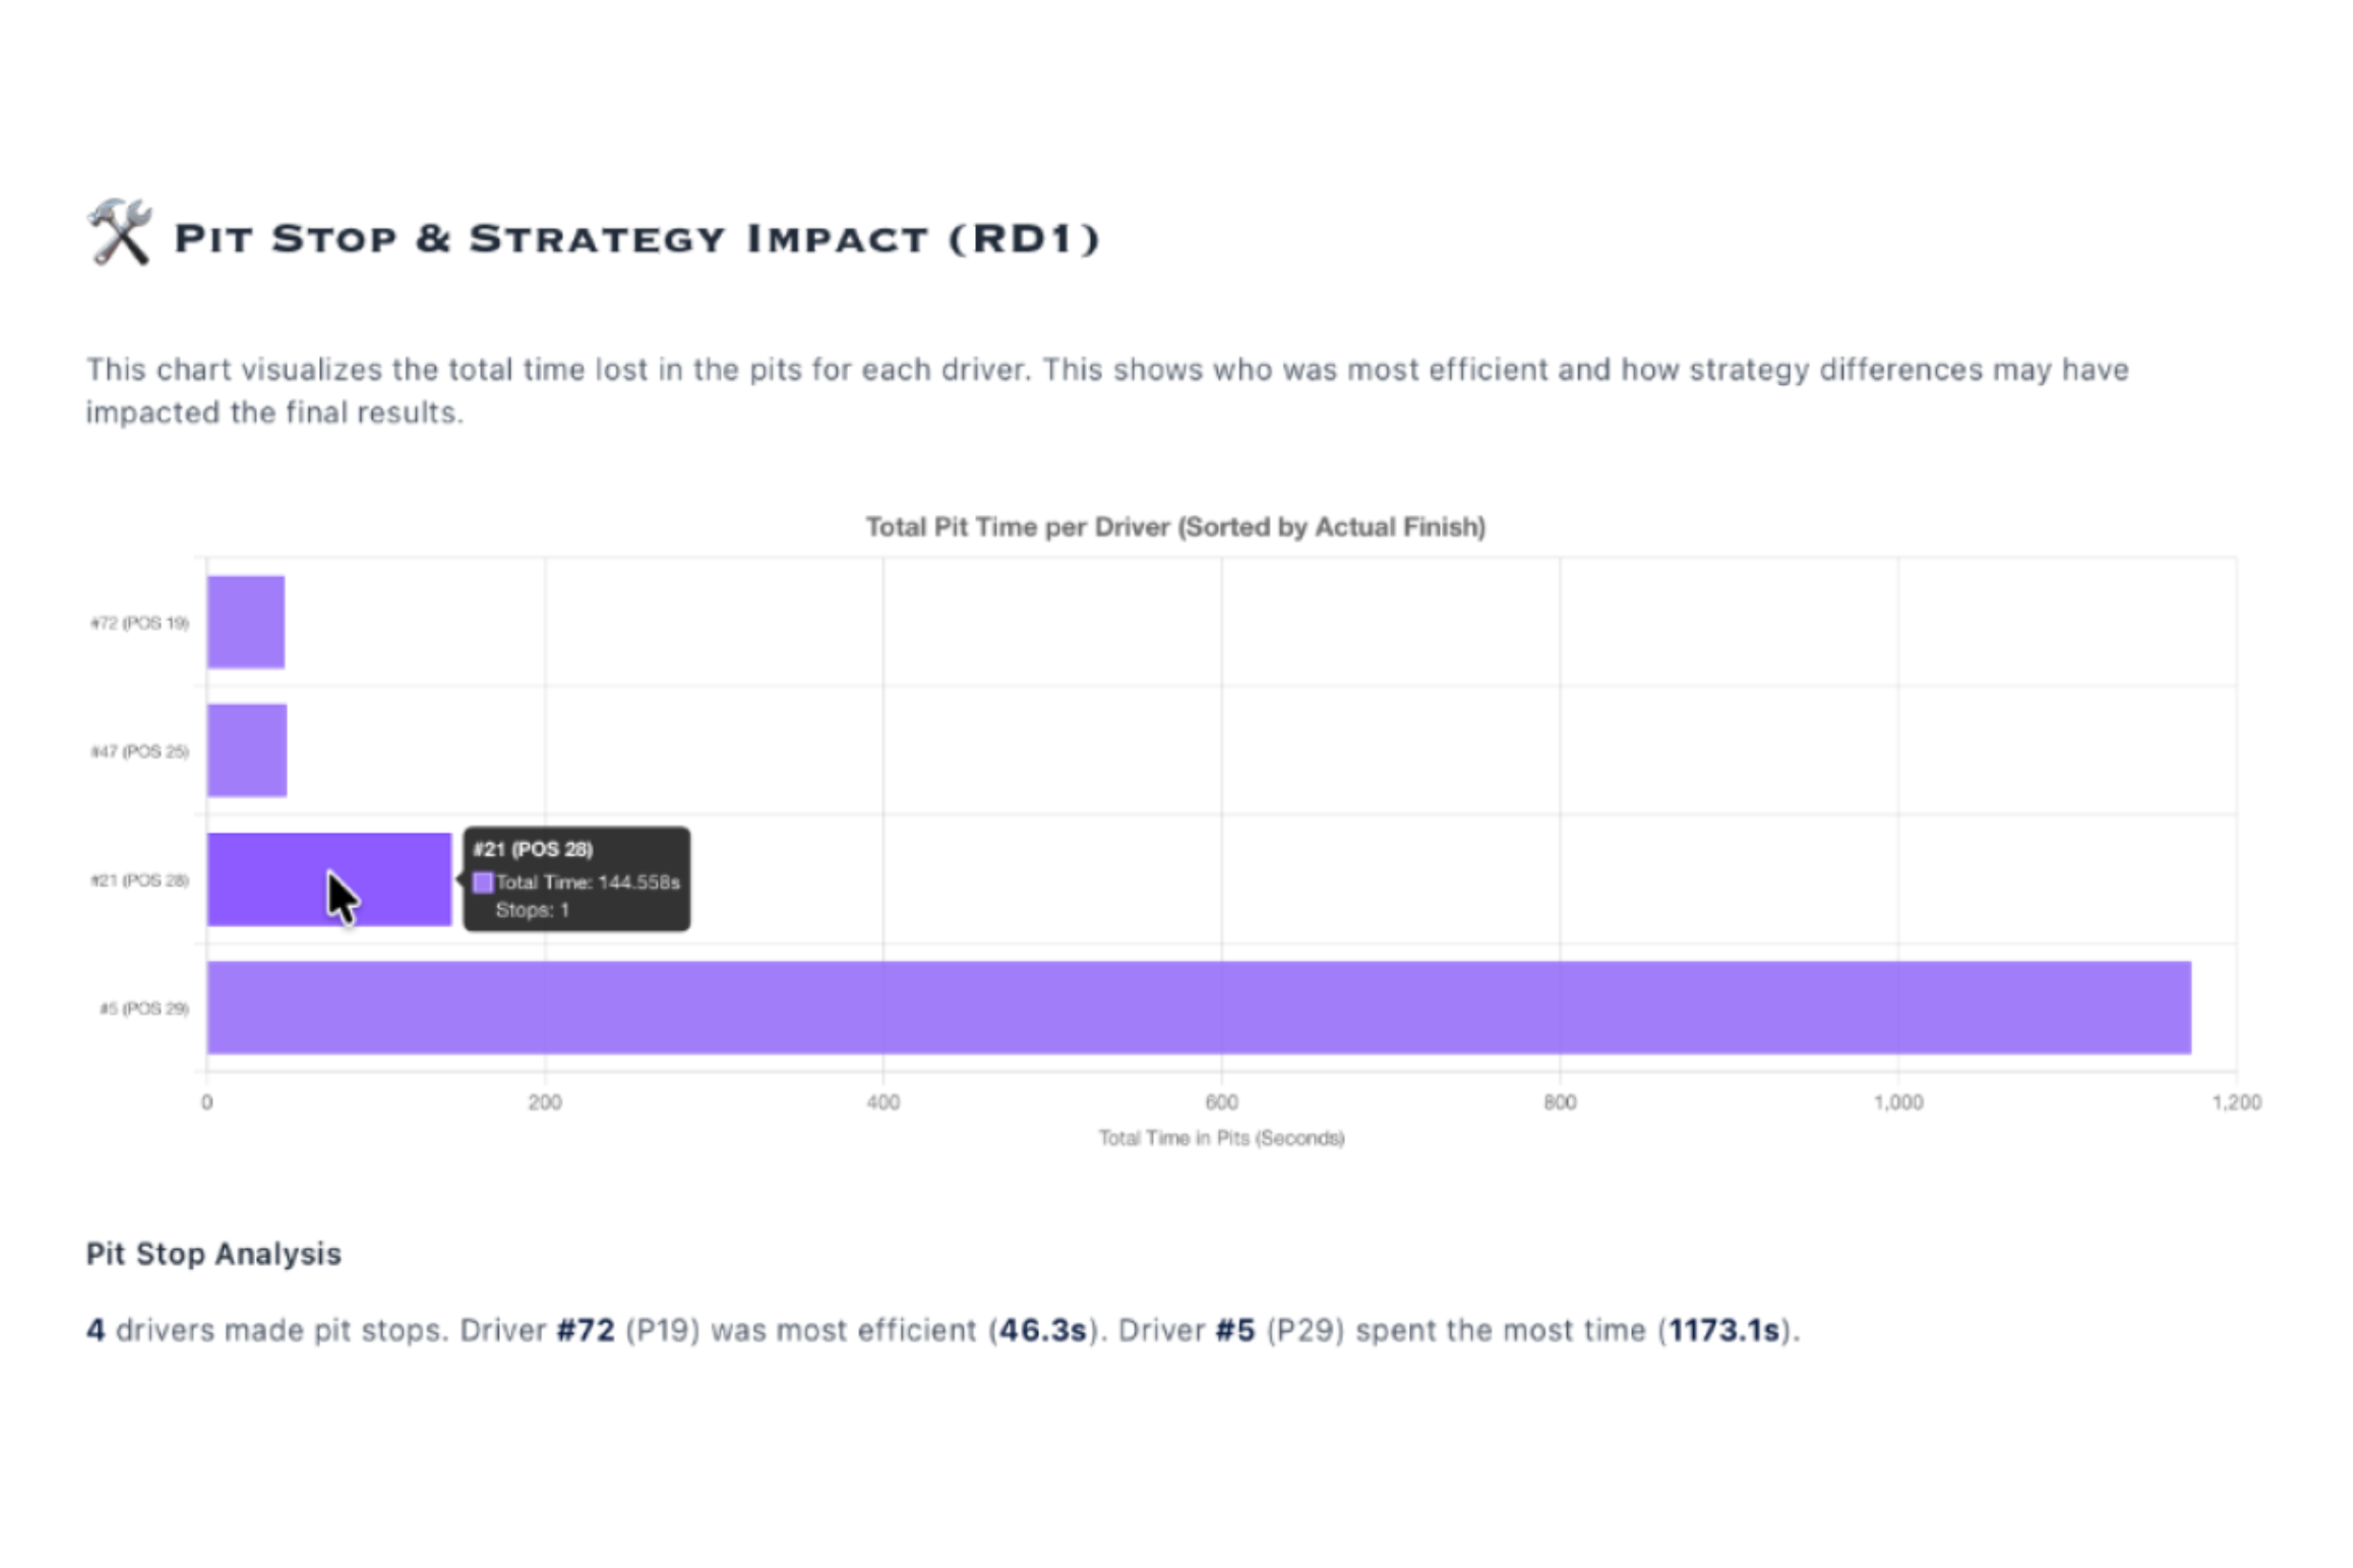
- 🛠️ Pit Stop & Strategy Impact: A chart that visualizes the total time lost in the pits for each driver, along with analysis.
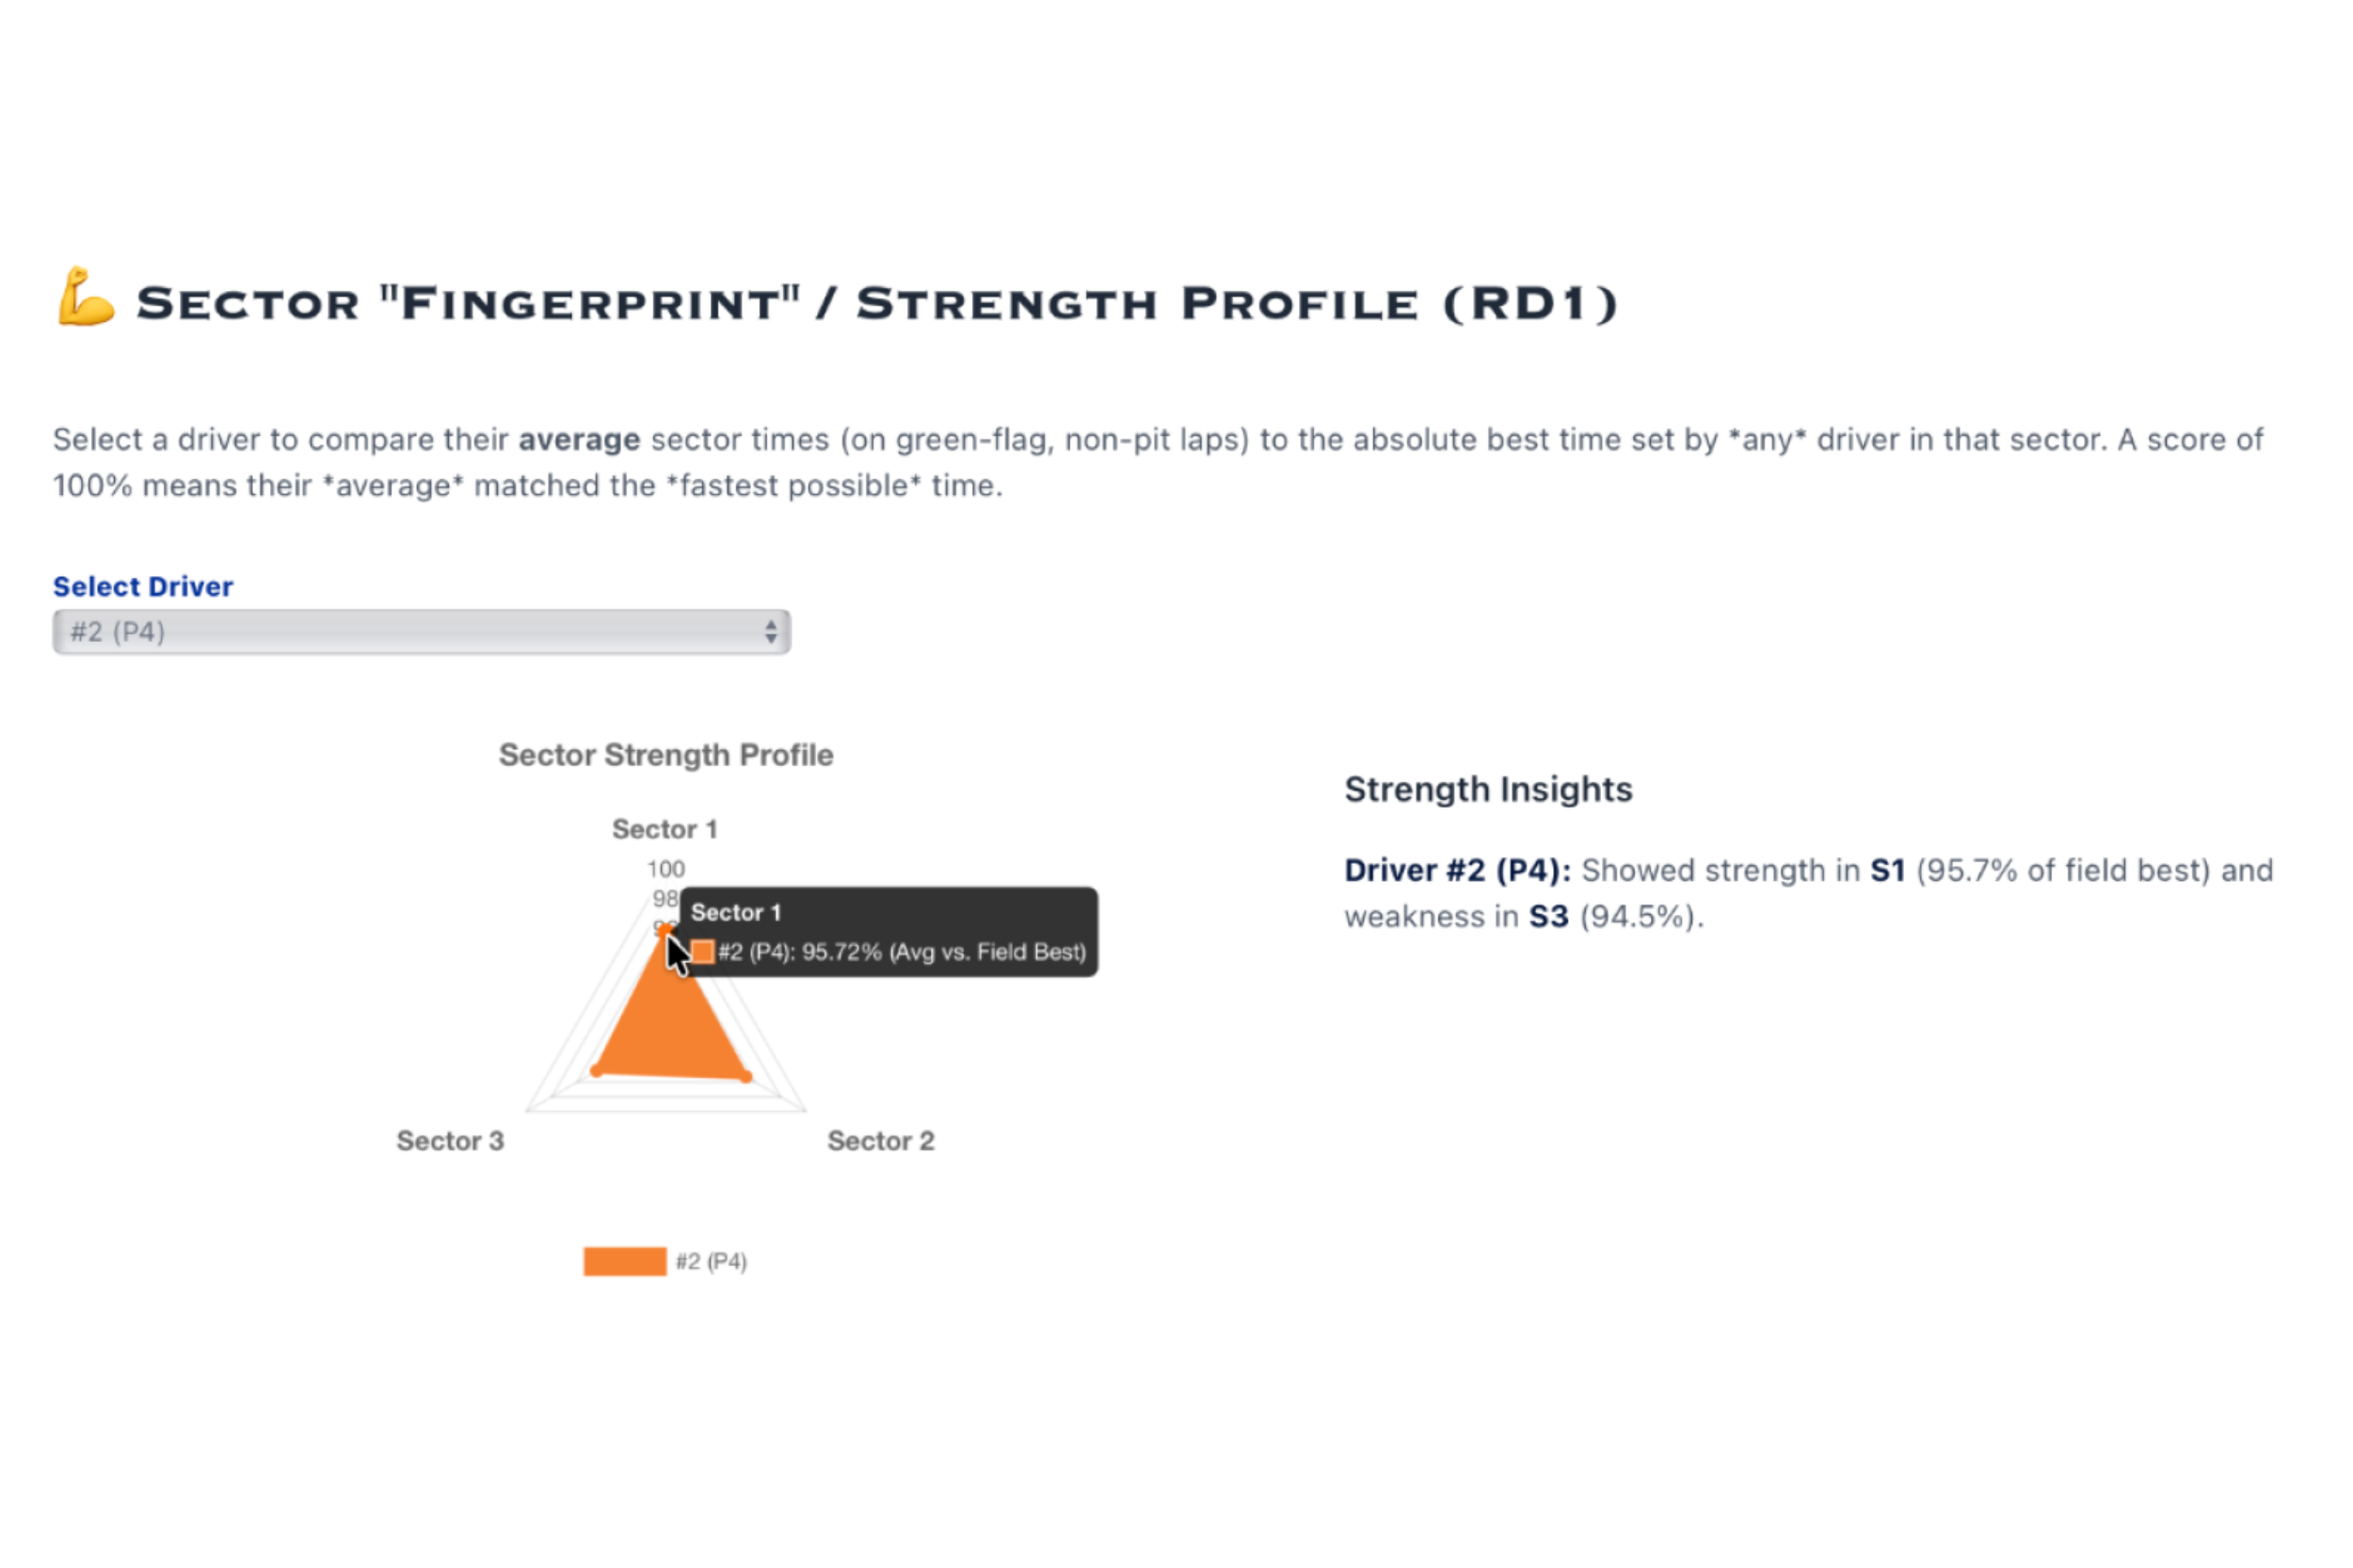
- 💪 Sector "Fingerprint" / Strength Profile: A chart that compares their average sector times (on green-flag, non-pit laps) to the absolute best time set by any driver in that sector, along with analysis.
- ☀️ IF MULTIPLE RACE DAY DATA ARE UPLOADED ☀️:
- 📈 Driver Pace Evolution: A chart along with insights that shows the change in each driver's average green-flag, non-pit lap time.
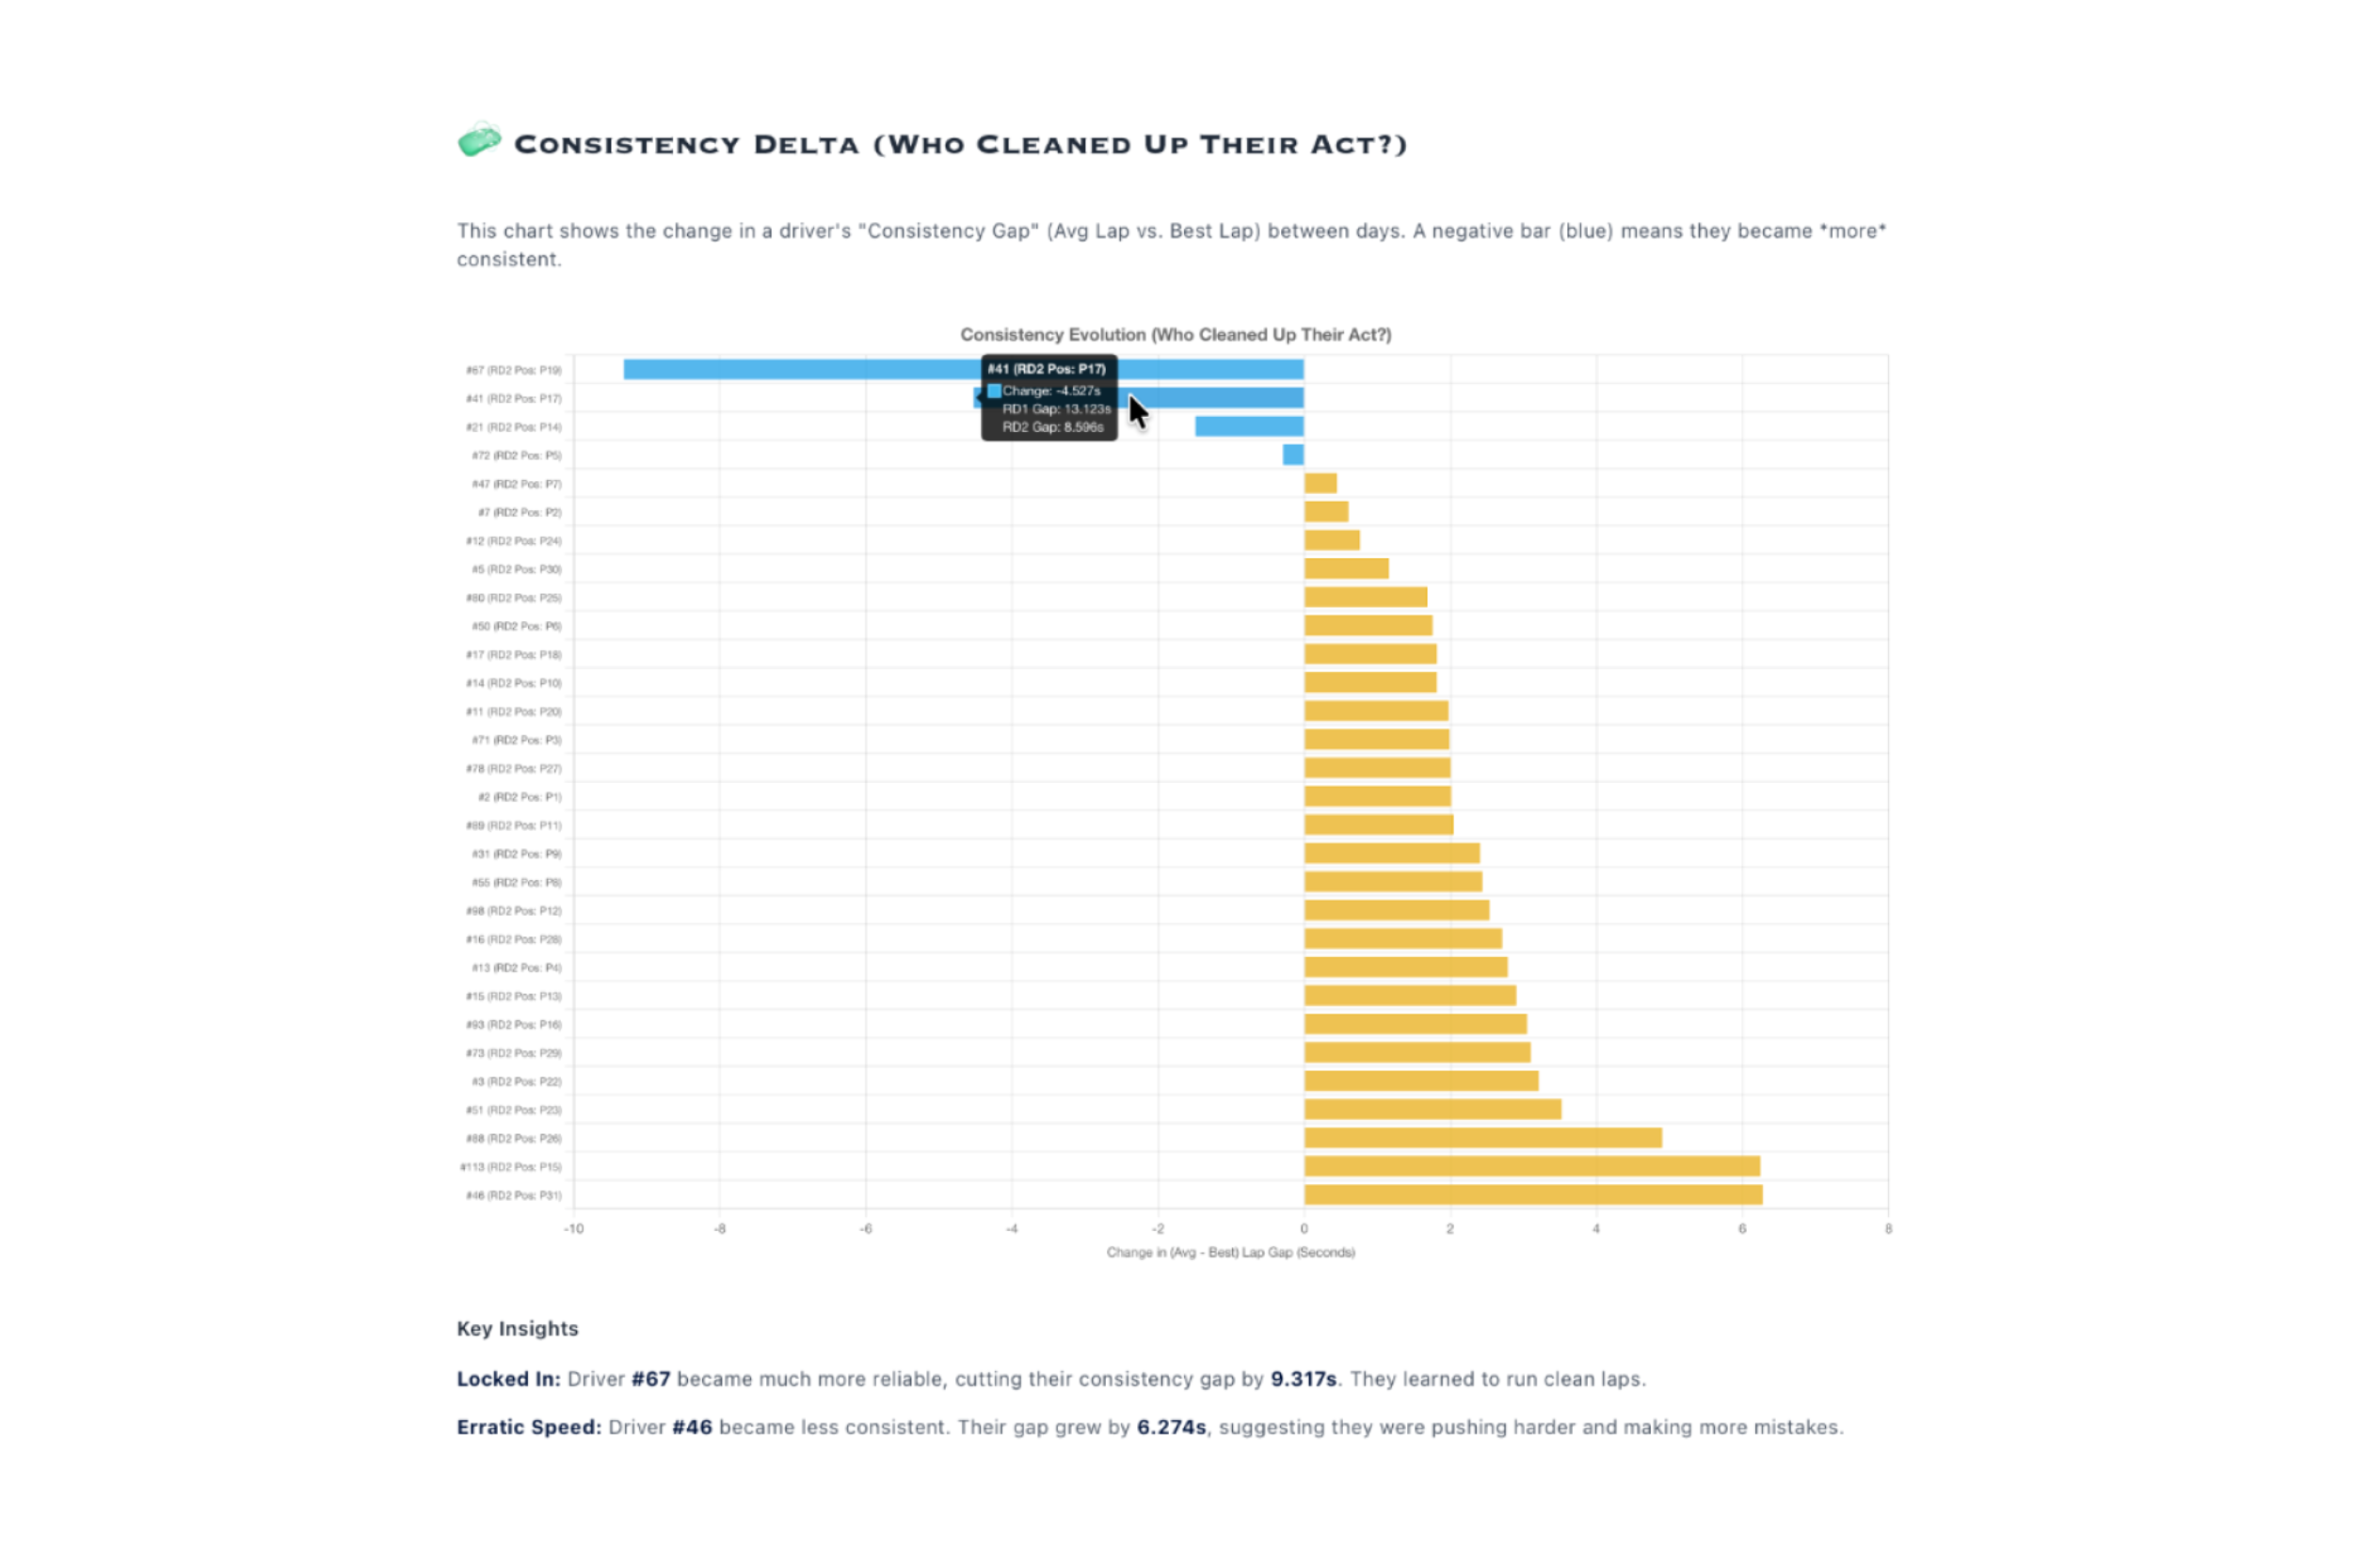
- 🧼 Consistency Delta: A chart and analysis that shows the change in a driver's "Consistency Gap" (Avg Lap vs. Best Lap) between days.
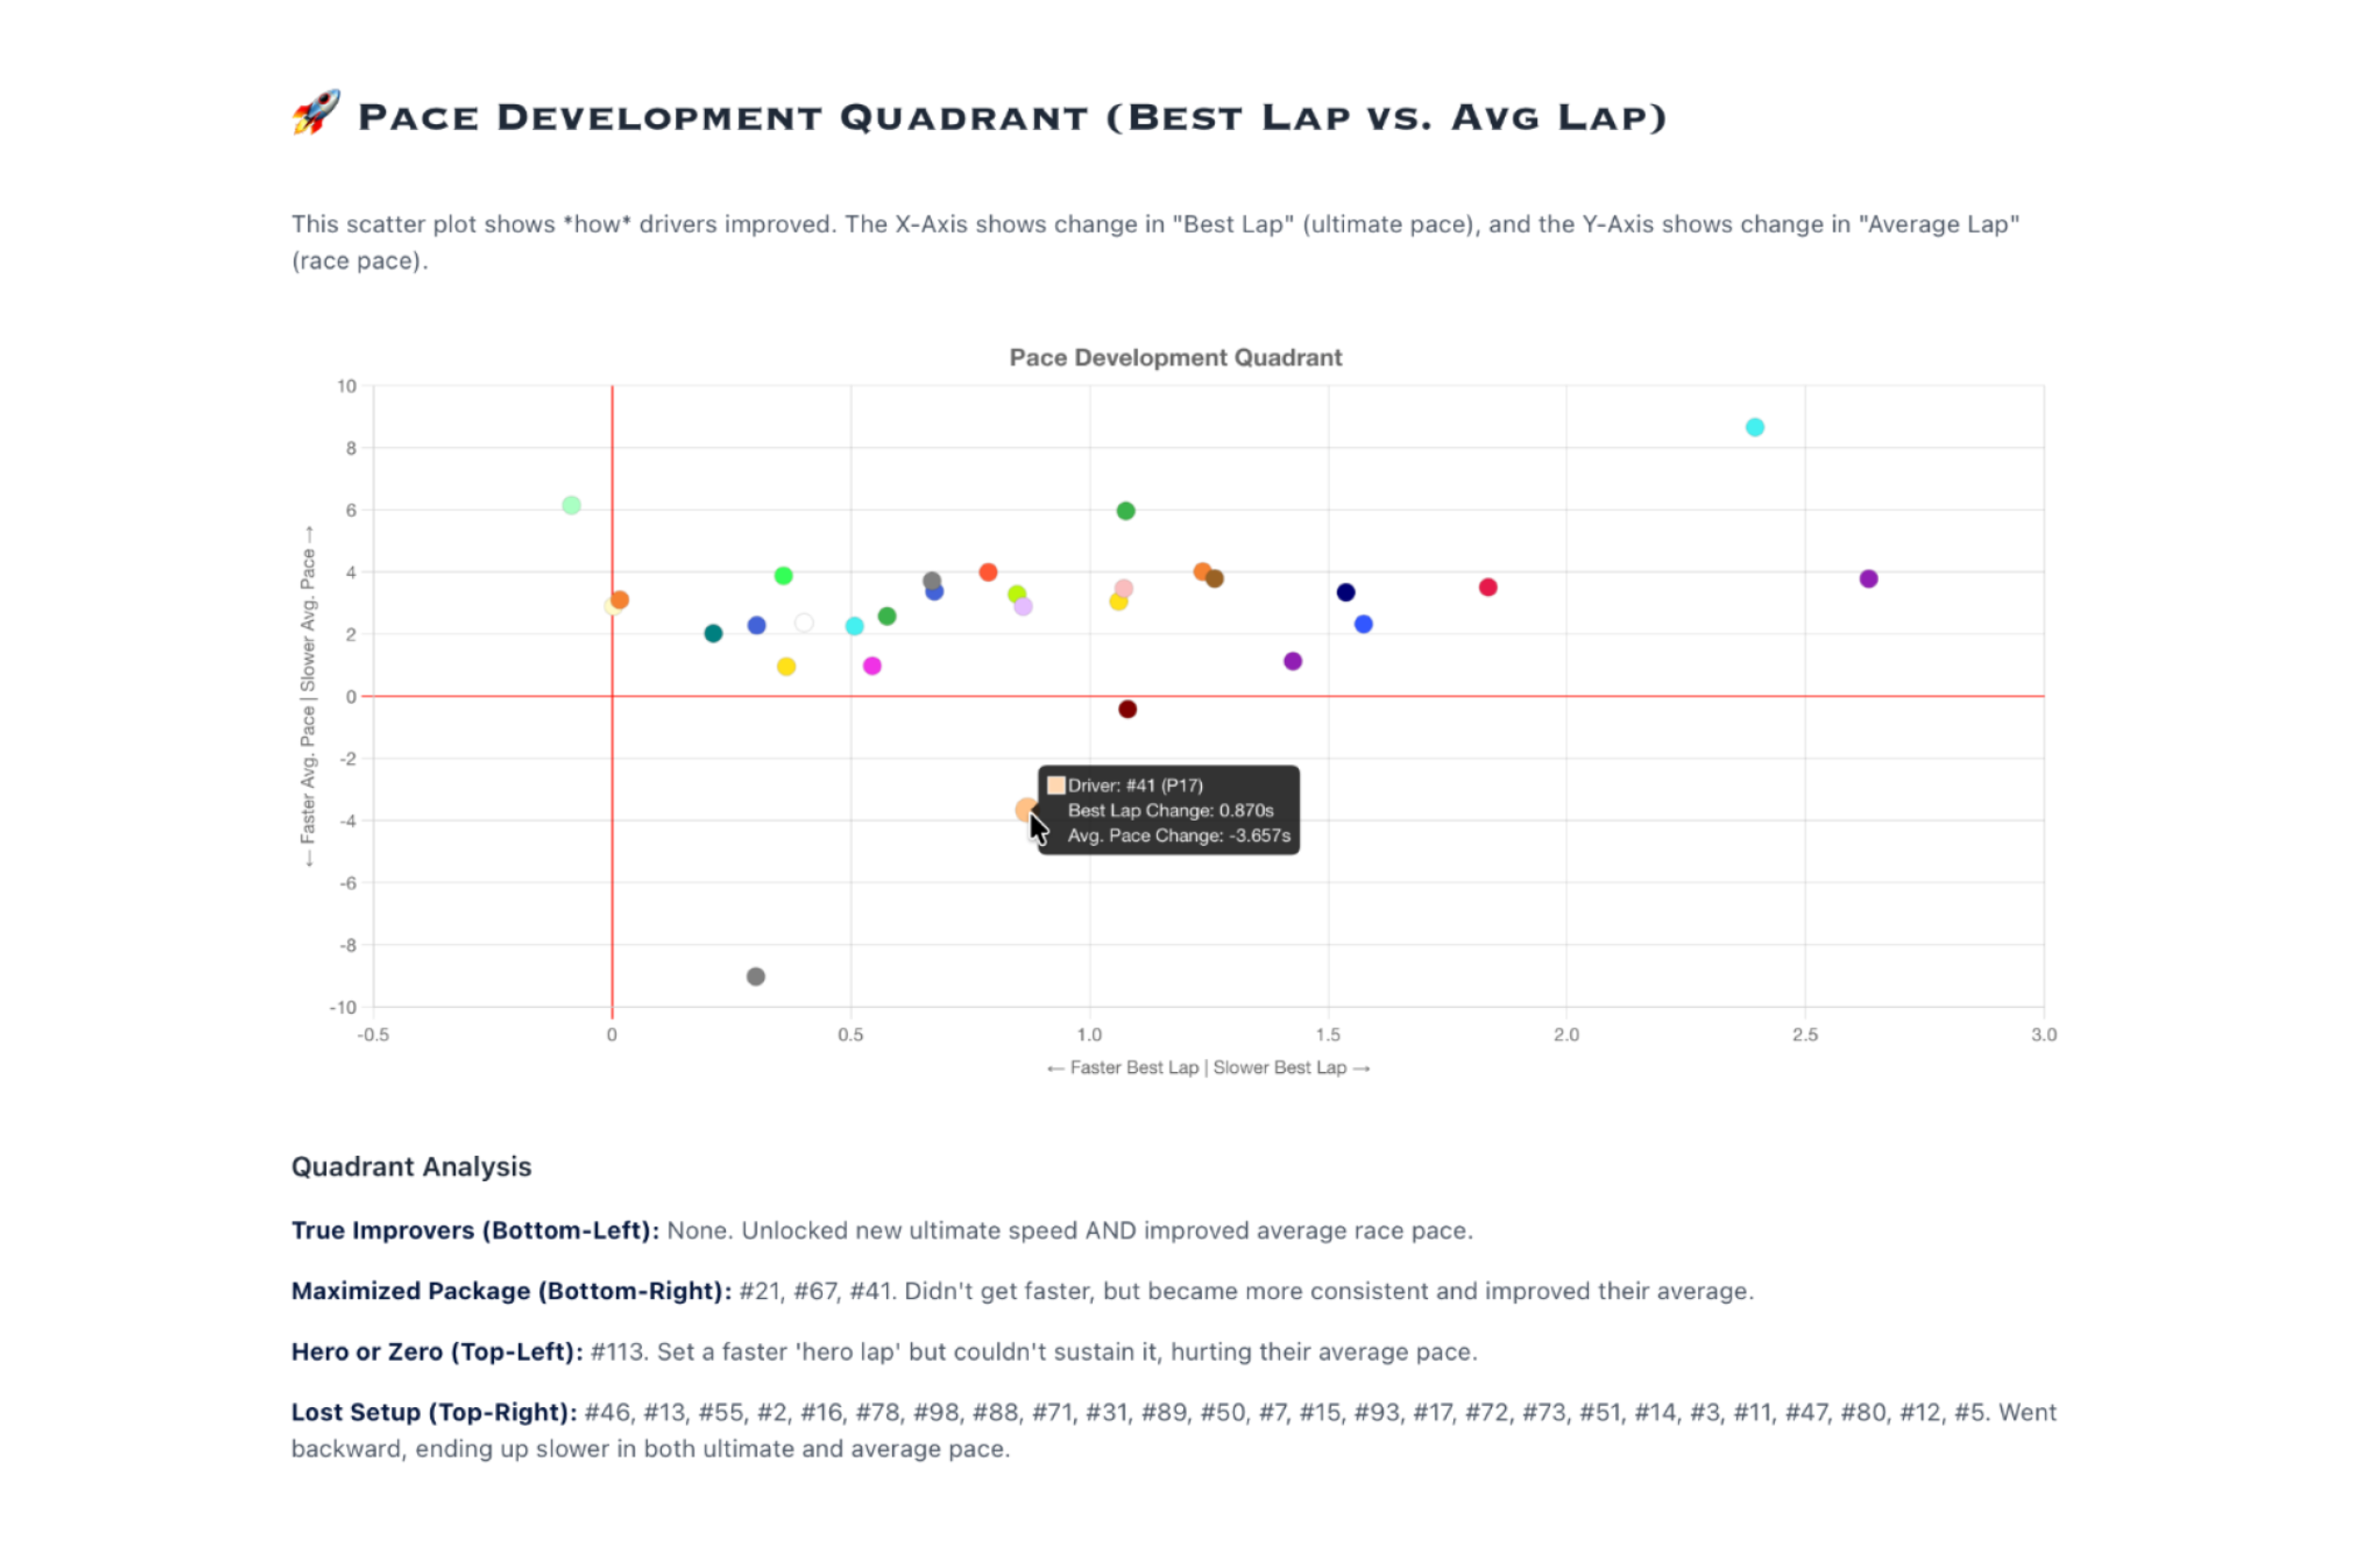
- 🚀 Pace Development Quadrant (Best Lap vs. Avg Lap): A scatter plot and insights that shows how drivers improved.
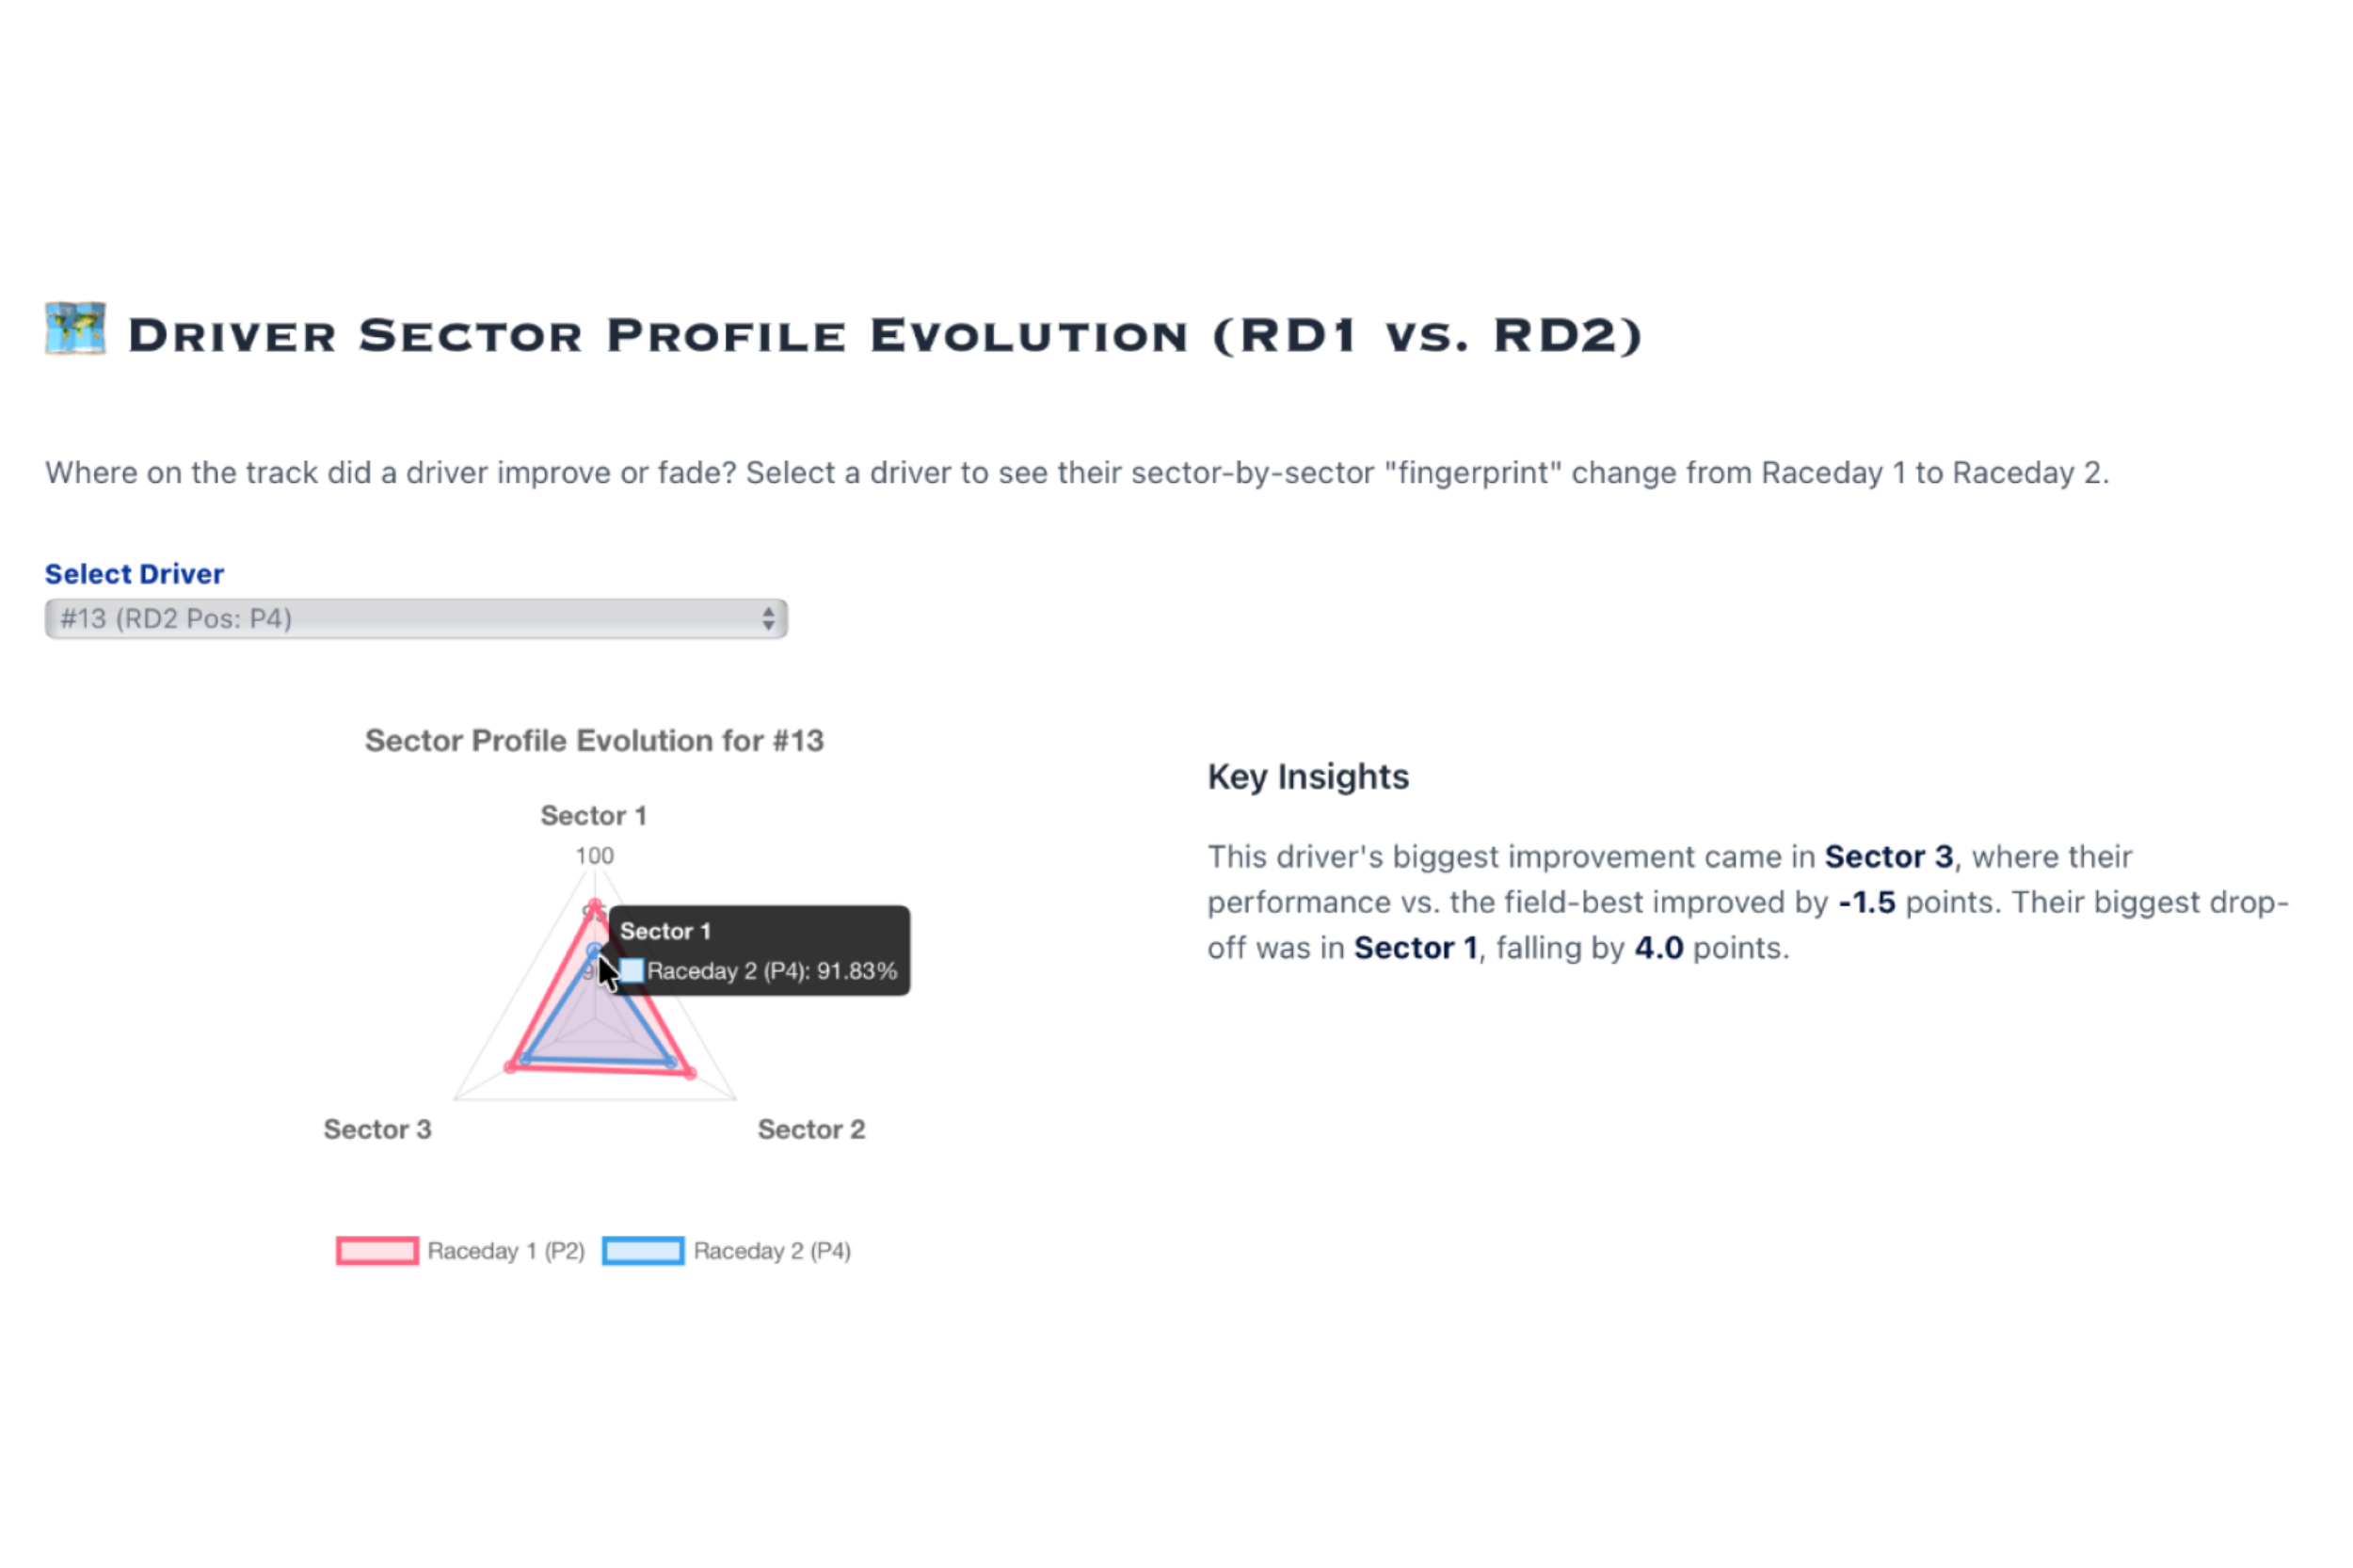
- 🗺️ Driver Sector Profile Evolution: A chart that compares between two days their average sector times (on green-flag, non-pit laps) to the absolute best time set by any driver in that sector, along with analysis.
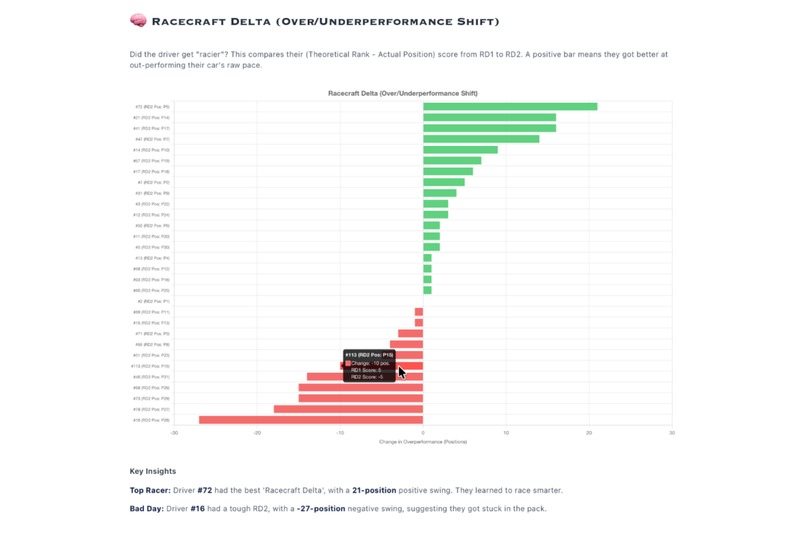
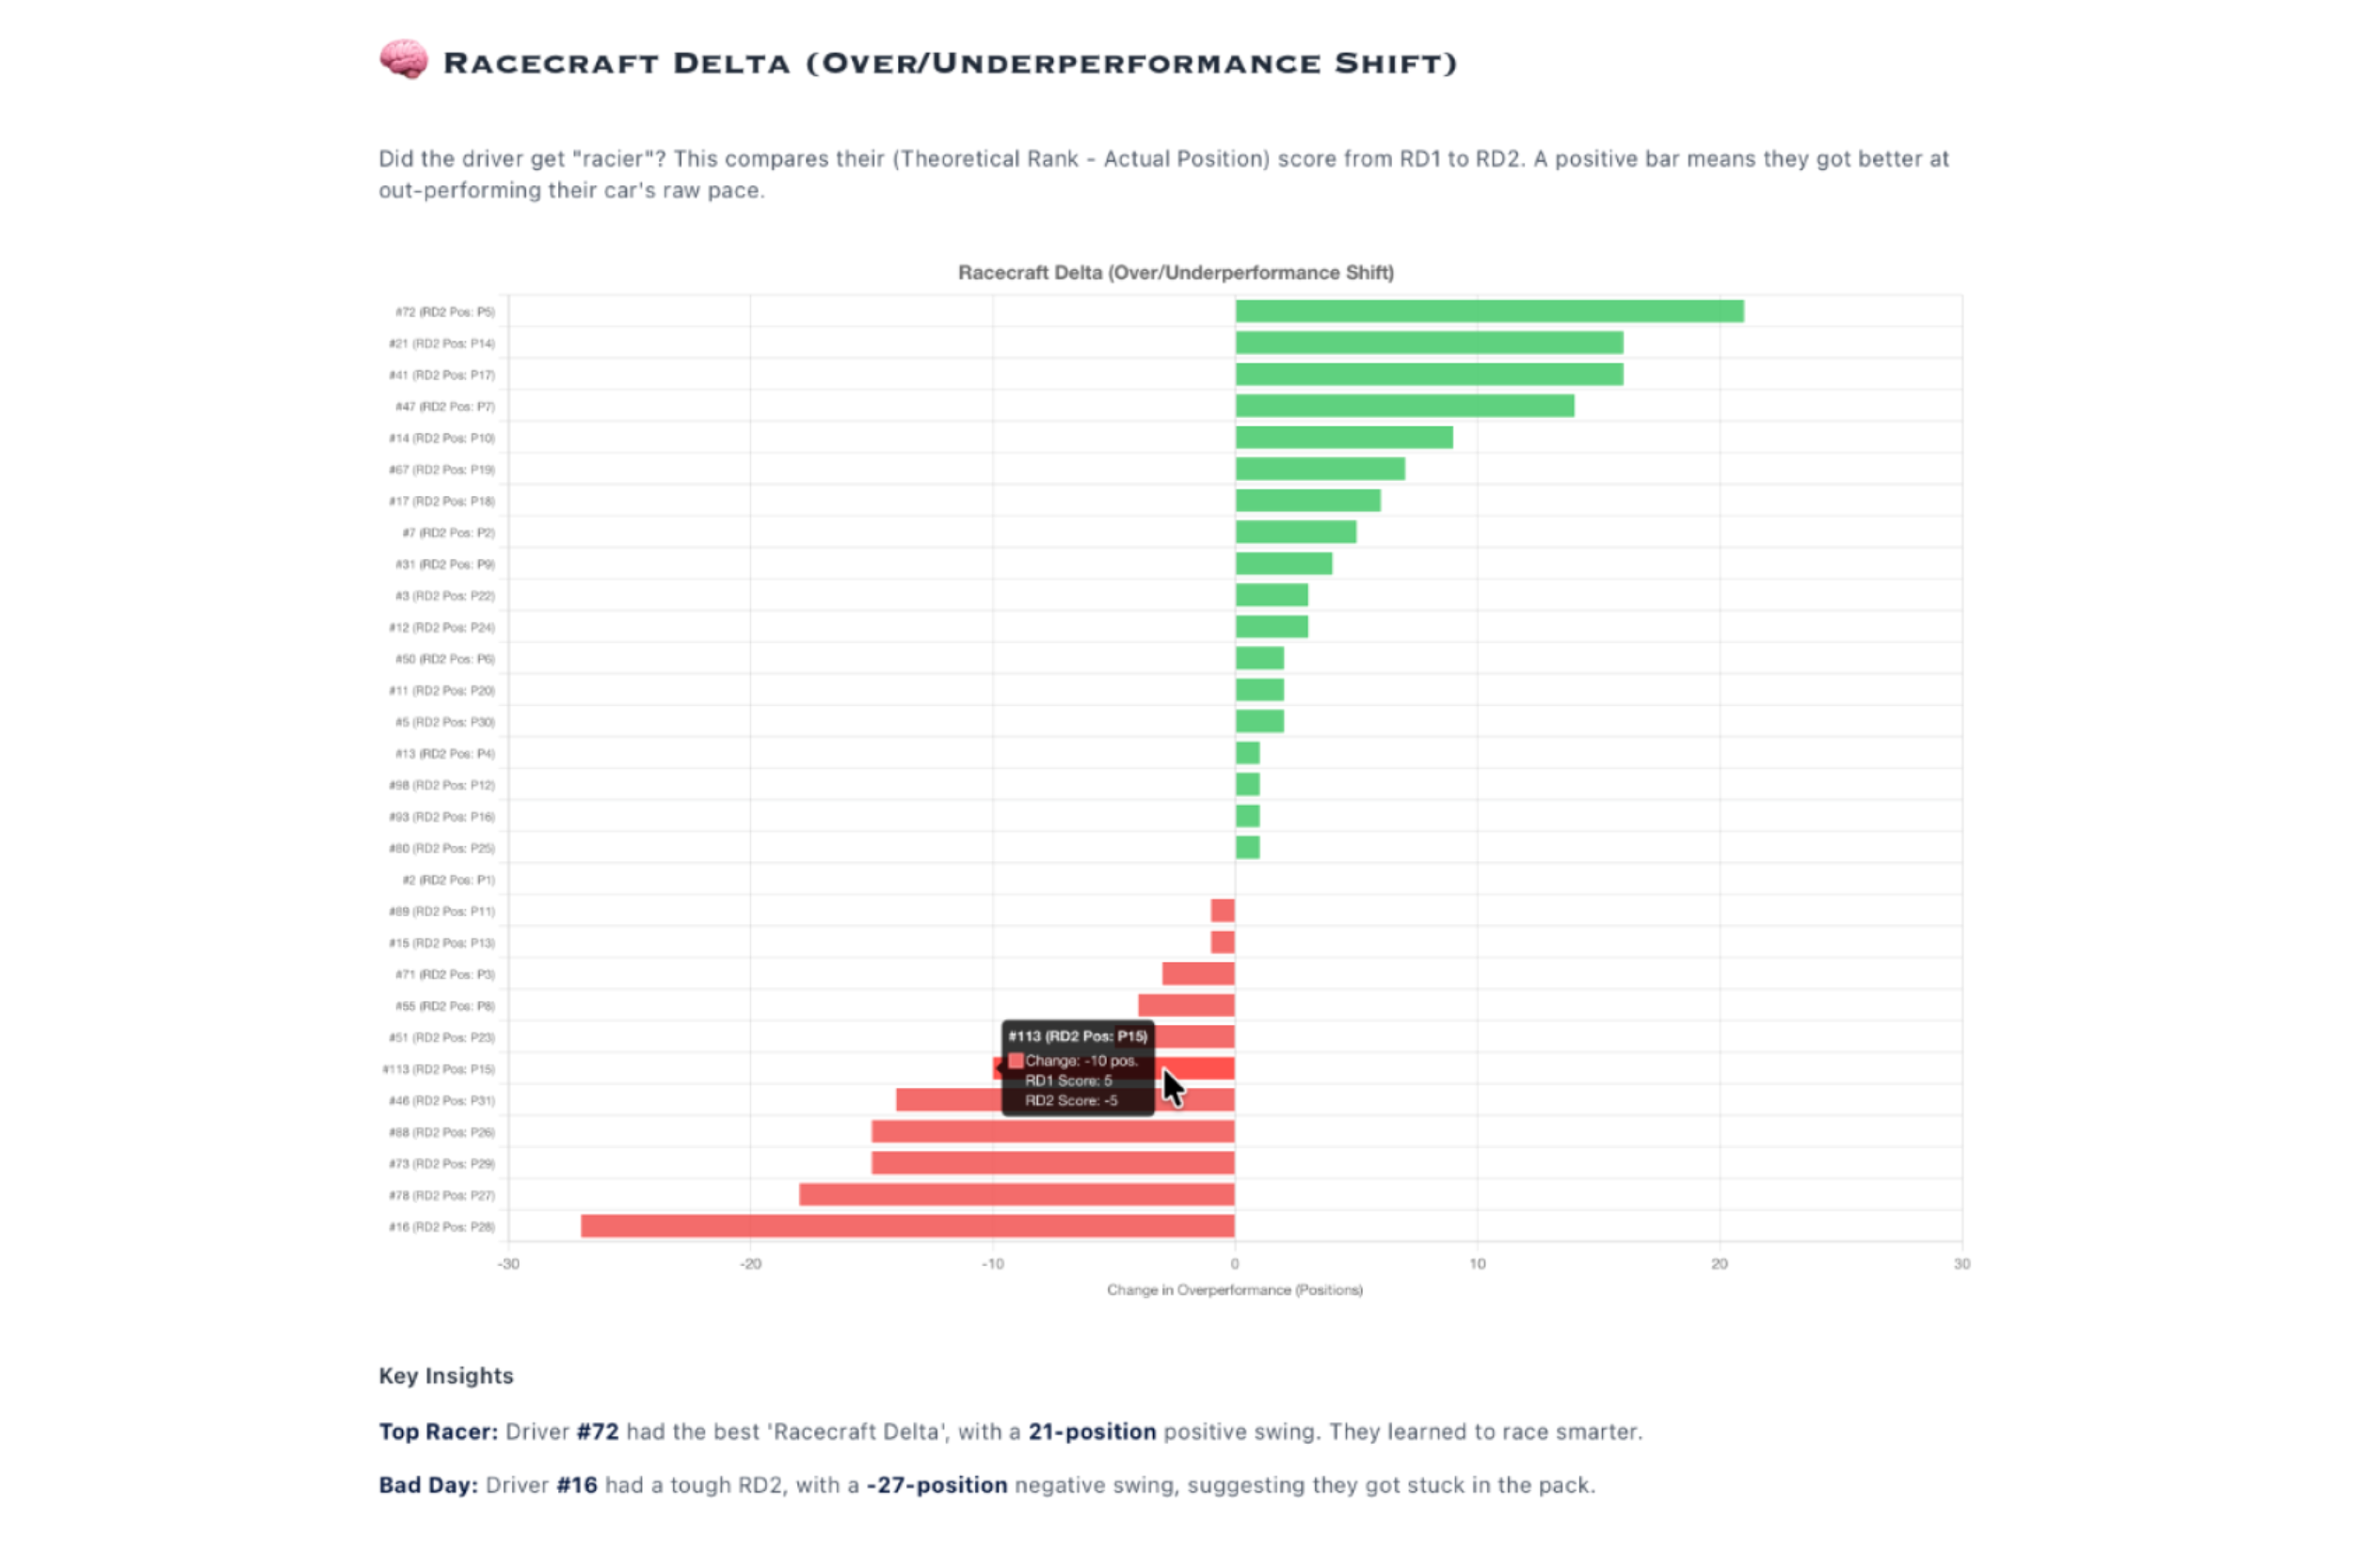
- 🧠 Racecraft Delta (Over/Underperformance Shift): A graph and insights that compares their (Theoretical Rank - Actual Position) score from both race days.
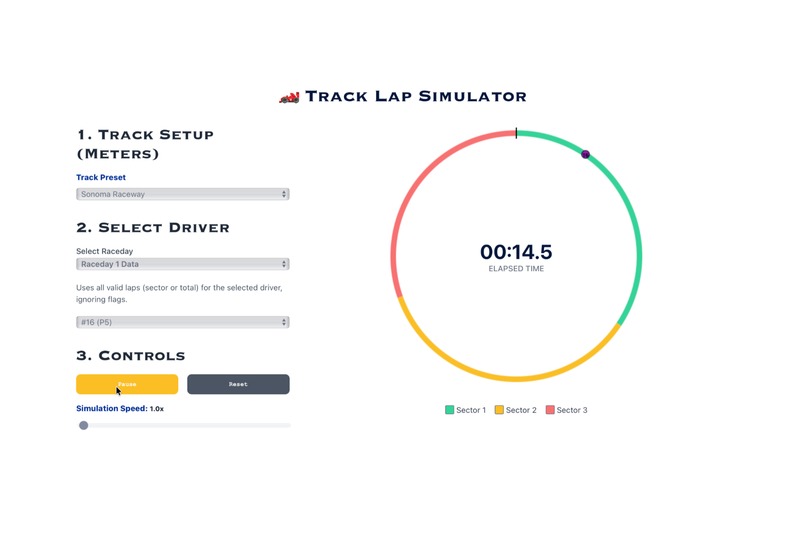
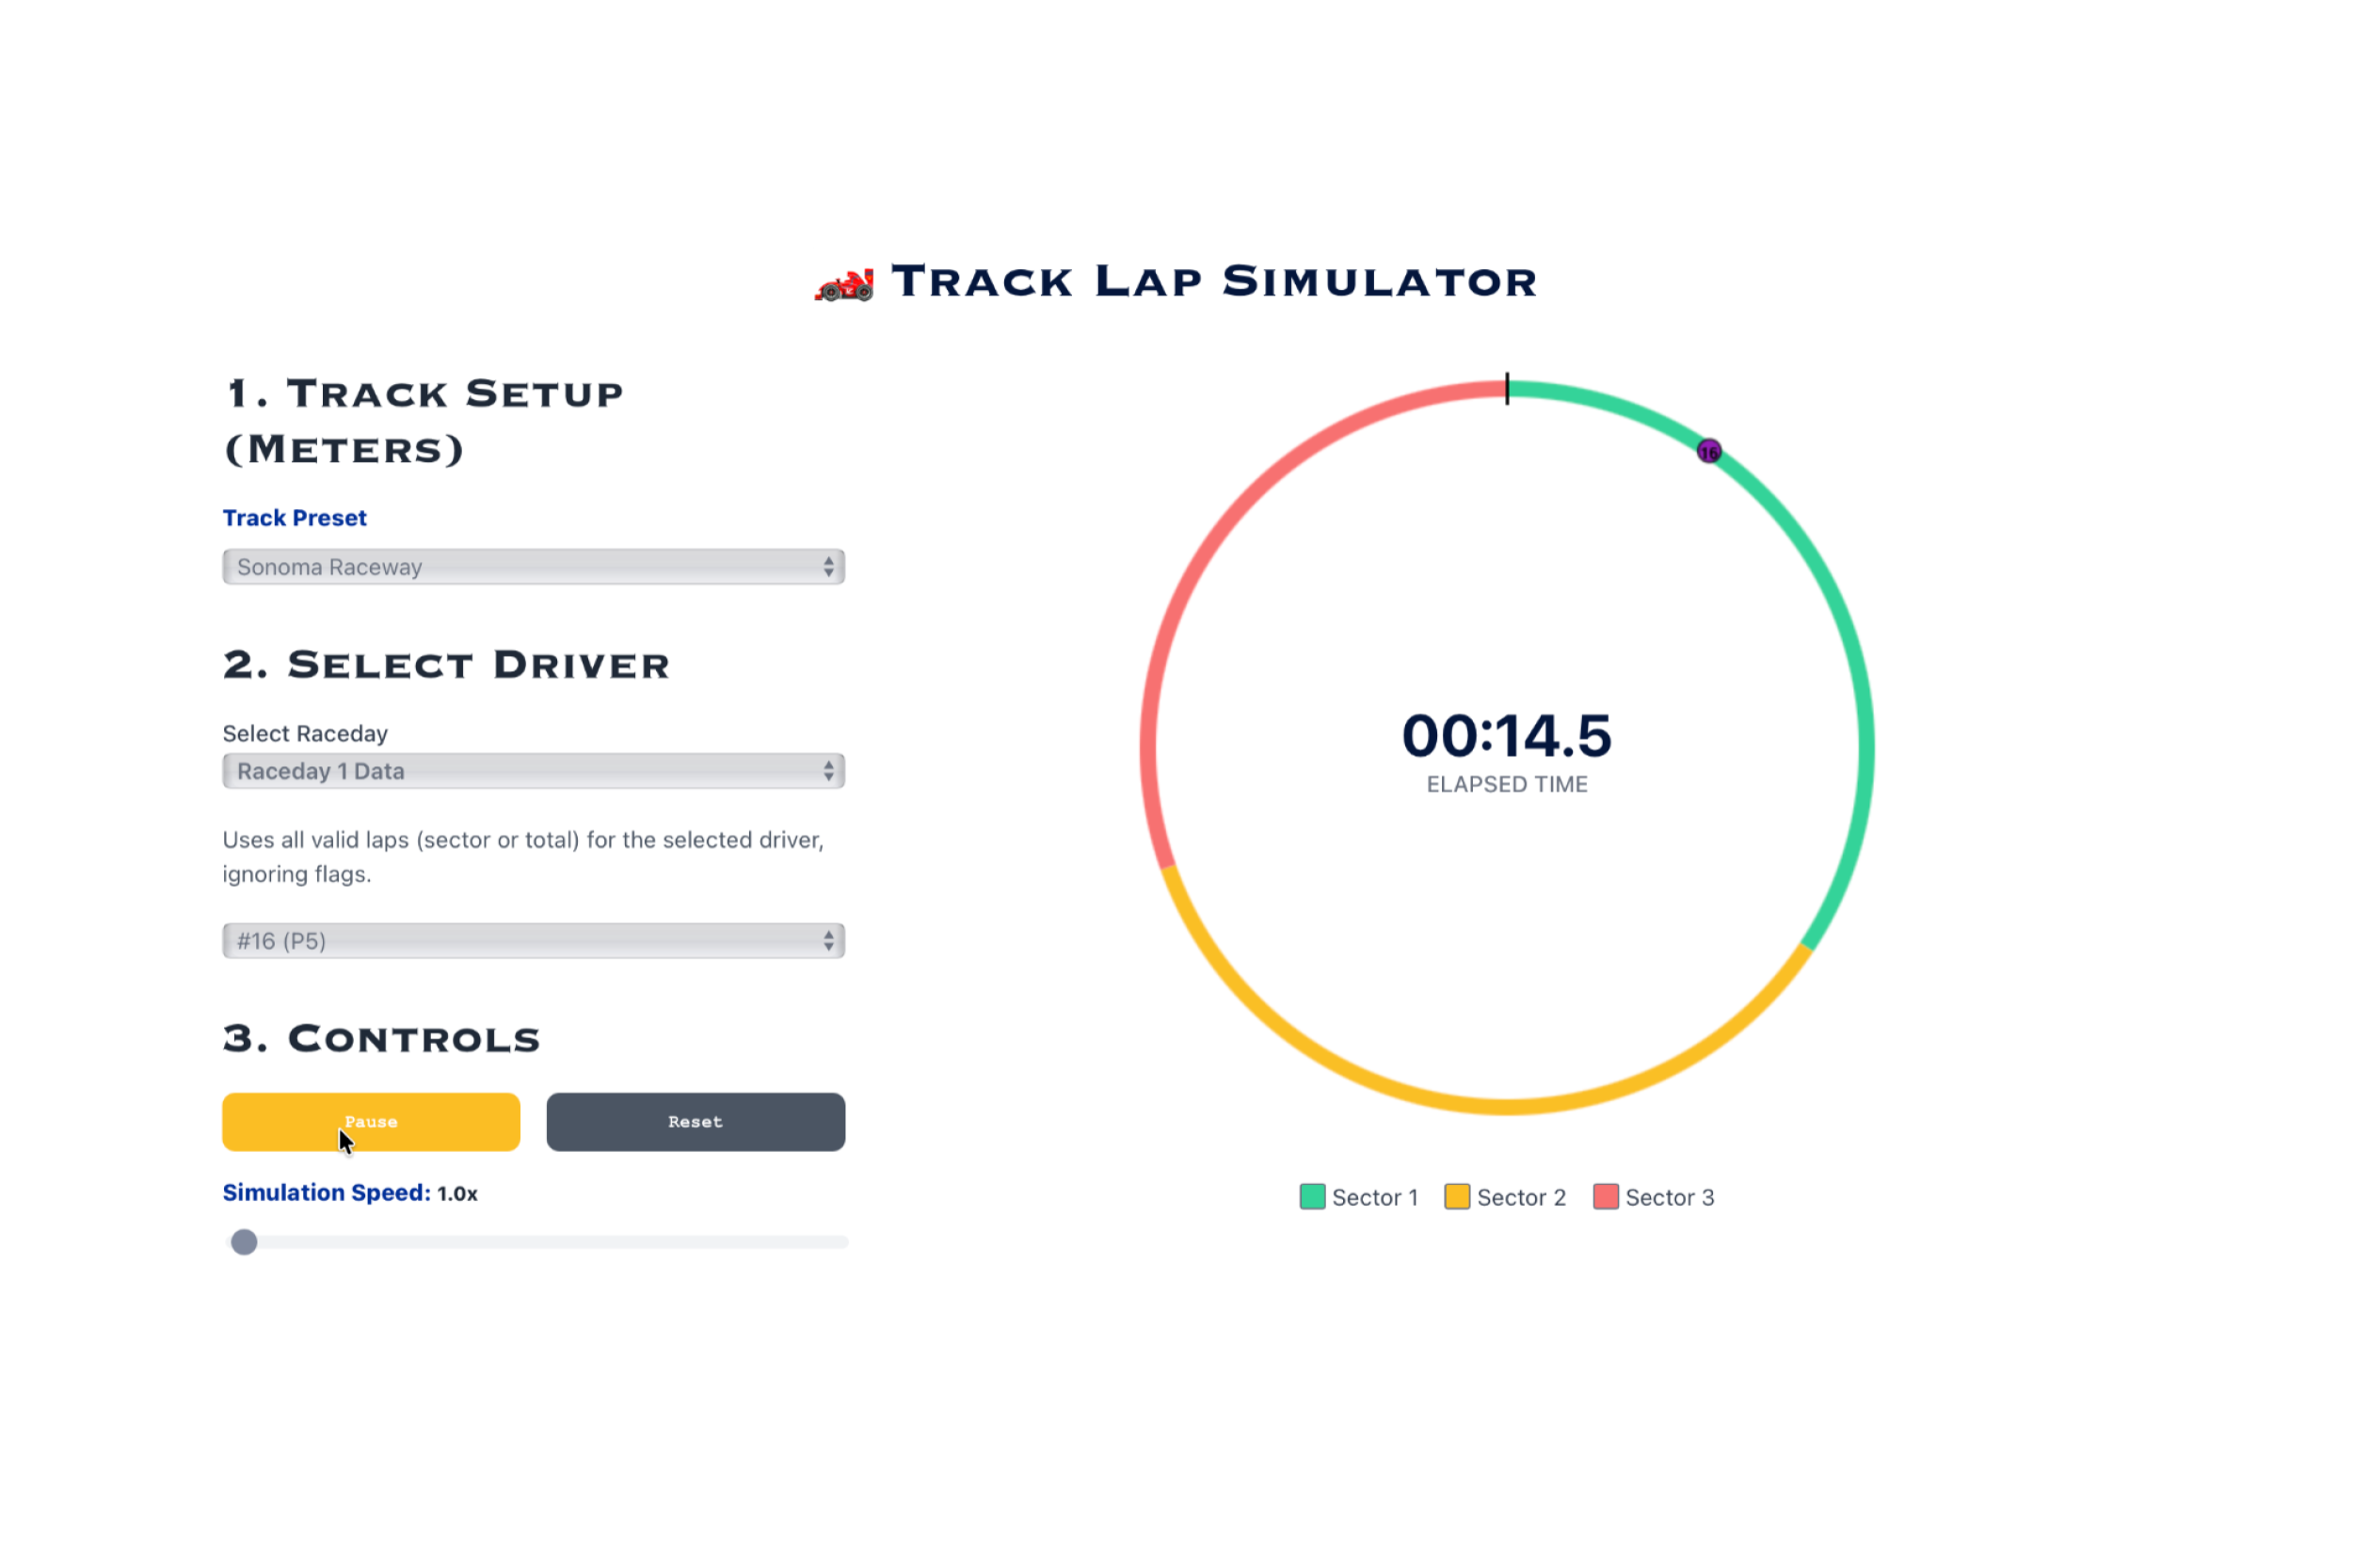
- 🏎️ Track Lap Simulator
- 🚦 Track Presets & Custom Tracks: Choose from predefined track presets or enter custom sector lengths to create your own virtual track.
- The simulator represents the track as a circular loop divided into three colored sectors.
- Each sector’s arc length is proportional to its configured length (for both presets and custom tracks).
- 👤 Driver Selection: Pick any available driver to simulate their lap performance on the chosen track.
- Simulation Controls:
- ⏯️ Pause / Resume / Reset the simulation at any time.
- ⚙️ Adjust Simulation Speed to run the lap slower or faster.
- 👁️ Visual Representation: The track is displayed as a circular progress indicator divided into 3 colors—each representing one sector. The driver’s position moves around the track according to lap progress and sector times. A timer is displayed in the center of the track.
- 🚦 Track Presets & Custom Tracks: Choose from predefined track presets or enter custom sector lengths to create your own virtual track.
- 💬 Chat
- 🤖 LLM Powered Chat: Ask anything ranging from driver performance, consistency, pit stops, or anything else.
- The AI model has the context of all analysis and evaluation data.
- ☁️ Powered by Gemini 2.5 Flash: A powerful cloud-based LLM model.
- Must enter Gemini API key.
- 🤖 LLM Powered Chat: Ask anything ranging from driver performance, consistency, pit stops, or anything else.
How I built it
AI RaceKit is built as a web application using HTML, CSS, and JavaScript, making it highly accessible, private (no cloud data uploaded unless using the chat), and easy to deploy.
Data Parsing: I used Papa Parse for efficient and robust client-side CSV data parsing.
Data Visualization: All interactive charts and graphs are built using Chart.js.
AI Chat: The chat feature integrates directly with the
Gemini 2.5 Flashmodel API. I developed a system to feed the context of all the parsed tables and generated analysis to the model, allowing it to answer specific user questions.Frontend vs Backend: I had to think about this. My web application is mainly frontend-based. I'm not hosting a backend for data processing, in-fact every processing of the data is happening inside the browser. The only backend in the project is completely optional (AI Chat). The reason I opted to do this is because it was simply not necessary to have a backend when it would be much simpler to process everything in the browser itself.
Challenges I ran into
Data Cleansing: Race data is inherently noisy. A major challenge was implementing logic to accurately identify and filter out "junk" laps (like pit-in/pit-out laps, formation laps) and account for lap flags. This was critical for ensuring all AI analyses were based on valid, green-flag running.
Defining Meaningful Metrics: It was difficult to move beyond simple averages. We had to research and conceptualize complex, valuable metrics like "Theoretical Pace Rank," "Consistency Gap," and "Racecraft Delta" to provide genuine, actionable insights instead of just more raw data.
Contextualizing the AI: For the AI Chat, the challenge was to provide the Gemini model with the entire context of the parsed data and all the generated analysis (dozens of charts and tables) in a way that was efficient and effective, so that it could answer specific questions accurately.
Accomplishments that I'm proud of
Not only was this the first time working with motorsports data, it was my first time learning about motorsport racing in general. I'm proud that I could learn so much about a sport in such little time and build a web app that improves analyzing the data better for others.
What I learned
Before this hackathon, I didn't have a good understanding of motorsports racing. I learned a lot about how motorsport racing works in general. Here's some things I learned while making the project:
The Nuances of Motorsport Data: I learned just how much depth is hidden in simple lap time data. Building the analysis tools forced me to learn what metrics actually matter to a race team, such as pace degradation during a stint, the true cost of a pit stop, and the difference between "hero lap" pace and "consistent race pace."
Practical LLM Integration: I learned how to effectively leverage a powerful model like
Gemini 2.5 Flash. The key isn't just calling the API, but carefully pre-processing and formatting all the analytical data into a structured context that the LLM can understand and reason about to provide intelligent answers.
What's next for AI RaceKit
I'm open to ideas from anyone. For now here's what I'm thinking:
- More tools for more analysis.
- Improved user experience (as per feedback).
- Ability to accept a lot more types of parameters to create different types of analysis.
And much more.
Built With
- chart.js
- css
- gemini
- html
- javascript
- papaparse

Log in or sign up for Devpost to join the conversation.