🚀 GR-Pilot: AI-Powered Race Engineering for Toyota GR Cup
🌟 Inspiration
In modern motorsport, data is the difference between the podium and the paddock. However, raw telemetry is often overwhelming. After analyzing the Toyota GR Cup ecosystem, we realized a critical bottleneck: Drivers and engineers spend hours manually deciphering thousands of CSV rows to find a tenth of a second.
We asked ourselves: "What if the car could talk?"
Inspired by Toyota's philosophy of Kaizen (Continuous Improvement), we set out to build GR-Pilot. We wanted to democratize race engineering—combining the precision of physics-based analytics with the accessibility of Generative AI. Our goal was to turn a 4-hour data debrief into a 4-minute conversation with an AI Race Engineer.
🧠 What it does
GR-Pilot is a comprehensive, AI-powered post-race analytics platform designed specifically for the Toyota GR Cup. It ingests raw TRD telemetry data and transforms it into actionable strategy.
🔑 Key innovations include:
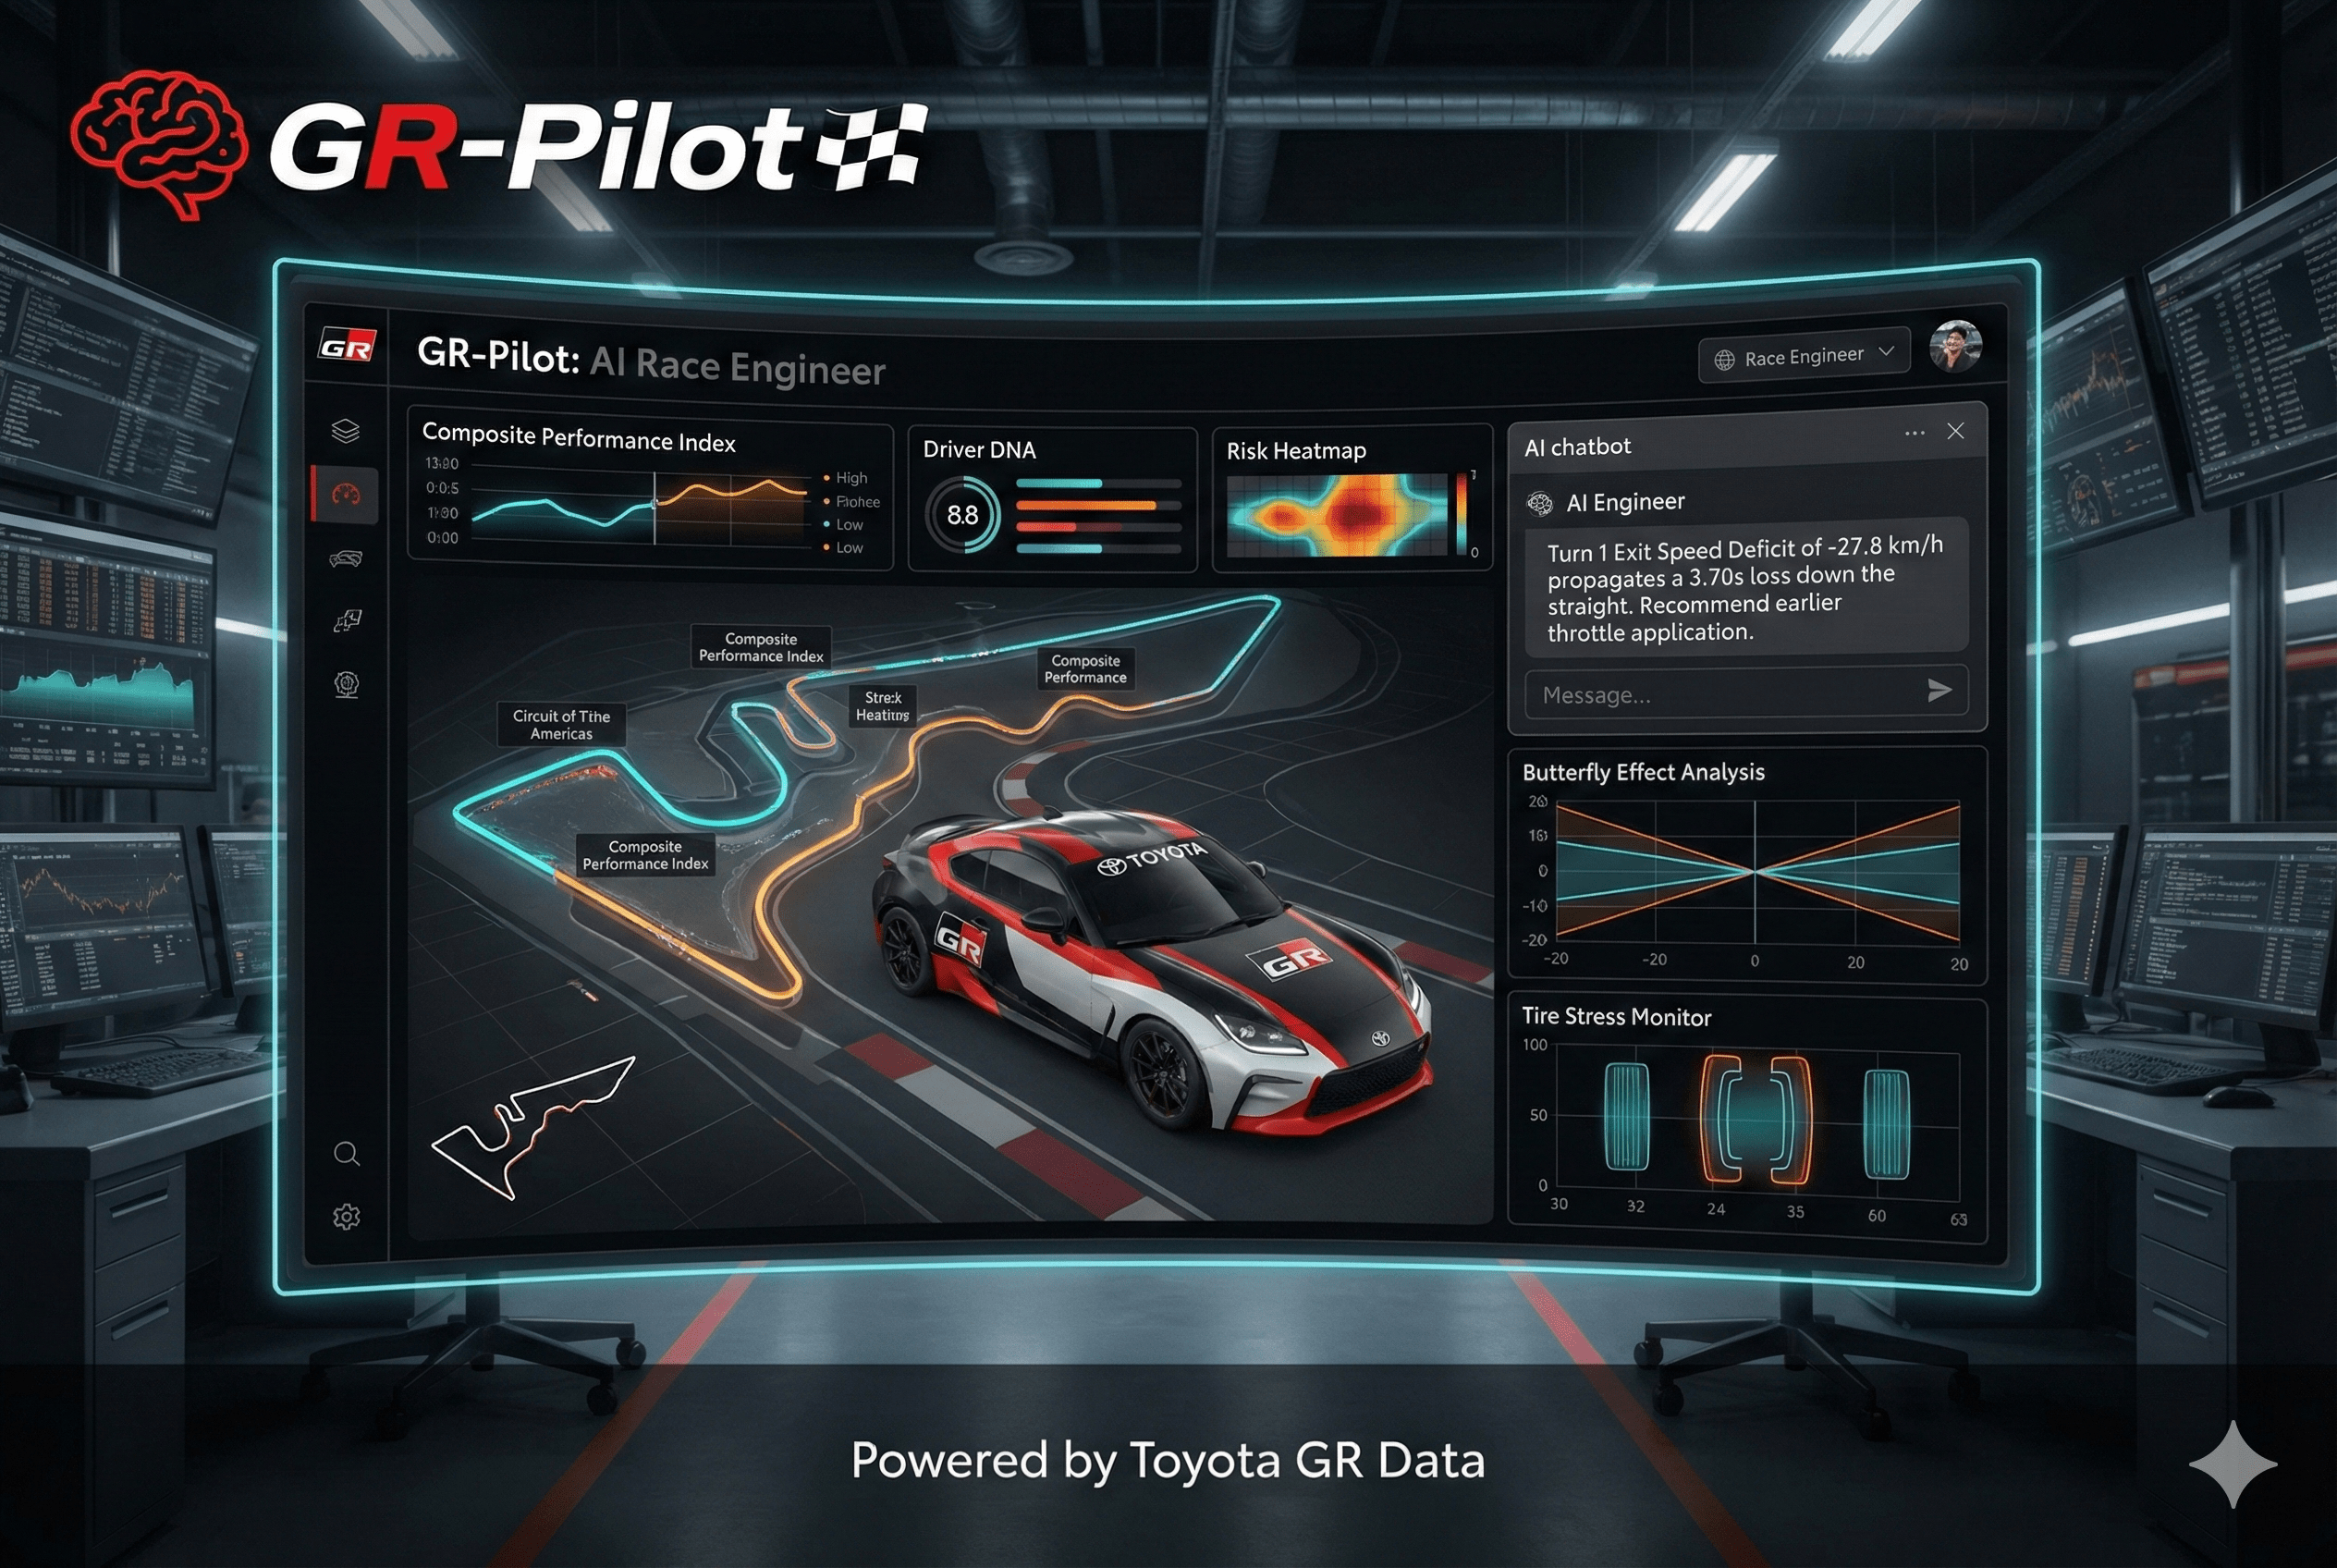
🏎️ 3D Visualization Engine: A browser-based digital twin that replays the race in 3D, allowing for "Ghost Car" comparisons.
🦋 The Butterfly Effect Analysis: Unlike standard tools that only show corner speed, our engine calculates Momentum Propagation. It quantifies how a 1 km/h deficit at a corner exit propagates down the entire straight, calculating the true time cost.
🤖 AI Race Engineer Chatbot: A GenAI interface where drivers can ask plain English questions like "Why am I losing time in Sector 2?" and receive data-backed answers.
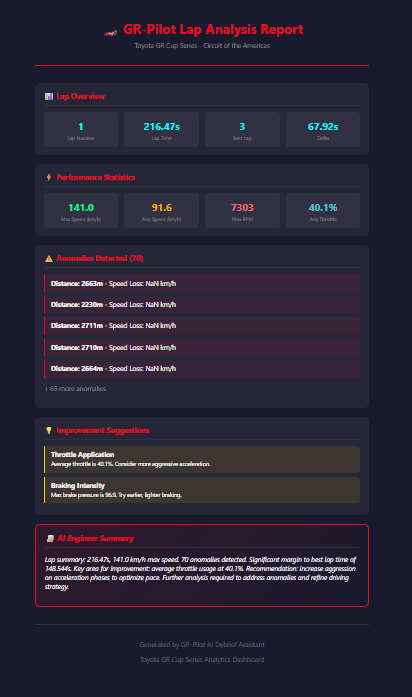
🧬 Driver DNA & CPI: Using Machine Learning, we classify driving styles (Conservative vs. Aggressive) and calculate a real-time Composite Performance Index (CPI) based on braking efficiency, throttle smoothness, and consistency.
🔥 Smart Anomaly Detection: An unsupervised Isolation Forest model that automatically flags over 70 types of errors, from "Sudden Braking" to "Tire Scrubbing."
🏗️ How we built it
We architected GR-Pilot as a high-performance web application balancing heavy data processing with a fluid UI.
🗂️ Data Layer
We utilized all 5 TRD Datasets (Telemetry, Lap Times, Weather, Sector Analysis, Best Laps). We built a custom ETL pipeline using Pandas to clean and synchronize over 167,000 data points.
🧮 Physics Engine (Backend)
Built with FastAPI and Python. We implemented a Spatial Synchronization Engine to align laps based on track distance ($d$) rather than time ($t$), eliminating delta skew.
🤖 Machine Learning
- Isolation Forest for Anomaly Detection
- XGBoost for Lap Time Prediction
- K-Means Clustering for Driver DNA profiling
🎨 Frontend
Developed with React 18 and TypeScript. We used Three.js (react-three-fiber) for the 3D visualization and Recharts/D3 for high-frequency telemetry rendering.
🧠 GenAI Integration
We integrated LLMs (Groq/OpenAI) via RAG (Retrieval-Augmented Generation) to translate JSON telemetry summaries into natural language insights.
🧱 Challenges we ran into
⏱️ The "Time Skew" Problem
Comparing a fast lap vs. a slow lap by time resulted in misaligned graphs. We solved this by implementing Spatial Indexing, re-sampling all telemetry data based on Laptrigger_lapdist_dls (Track Distance).
🦋 The Butterfly Effect Math
Quantifying momentum loss was complex. We derived a physics formula to calculate the integral of velocity difference over the straight distance:
Loss = \int_{d_{exit}}^{d_{braking}} \frac{1}{v_{actual}(x)} - \frac{1}{v_{ideal}(x)} ,dx
📈 Big Data Performance
Rendering 50Hz telemetry for a full race crashed the browser initially. We implemented data downsampling algorithms for the UI while keeping full resolution for the backend physics engine.
🏆 Accomplishments that we're proud of
✅ Full TRD Dataset Utilization: We didn't just use one file; we successfully fused telemetry, weather, and timing data into a single source of truth (showcased in our Dataset Explorer).
✅ The "Frankenstein" Lap: Successfully building a "Theoretical Perfect Lap" by stitching together the best micro-sectors from different laps.
✅ UI/UX Design: Creating a "Dark Mode" interface that feels like a professional tool used in a pit lane, not just a spreadsheet viewer.
✅ Actionable AI: The chatbot doesn't just hallucinate; it gives specific, coordinate-based advice (e.g., "Brake 5 meters later at Turn 11").
📚 What we learned
🛞 Tire Physics: We learned about the "Friction Circle" and how to detect tire scrubbing by correlating Lateral G-Force with Steering Angle.
🧠 Driver Psychology: Data is useless if it destroys confidence. We learned to frame AI feedback constructively (e.g., "Potential Gain" instead of "Error").
🌦️ Context Matters: A lap time means nothing without context (Weather, Tire Age, Fuel Load). Fusing these datasets was key to accurate analysis.
🔮 What's next for GR-Pilot: The AI Race Engineer for Toyota GR Cup
📡 Real-Time Telemetry Streaming: Moving from post-race analysis to live pit-wall monitoring via WebSocket.
🎥 Computer Vision Integration: Syncing onboard camera footage with the 3D replay for visual validation.
🧠 Predictive Tire Strategy: Using deep learning to predict the exact lap a tire will fall off the "cliff" based on thermal history.
🔥 GR-Pilot isn't just a tool—it's the future of accessible race engineering.
Note:
** This deployment demonstrates the interface design. Since the raw TRD datasets are too large for cloud hosting, real-time metrics are not populated in this preview. Please watch the Demo Video to see the system analyzing the real data.
Built With
- css
- csv
- datasets
- fastapi
- git
- groq
- javascript
- numpy
- openai-api
- pandas
- python
- react
- render
- scikit-learn
- streamlit
- tailwind
- three.js
- toyota
- trd
- typescript
- vercel
- vite
- vs-code
- xgboost

Log in or sign up for Devpost to join the conversation.