-
-
Toyota Gazoo Racing Dashboard by Danielle Royer
Inspiration
The project was primarily inspired by the critical need for race engineers to make instant, data-driven decisions in the high-pressure environment of a live race. I recognised that winning often depends on the speed and accuracy of strategic calls. My goal was to create a tool that transforms massive amounts of raw telemetry data into actionable intelligence, directly enhancing driver insights and team performance during race-day decision-making for the GR Cup Series.
What it does
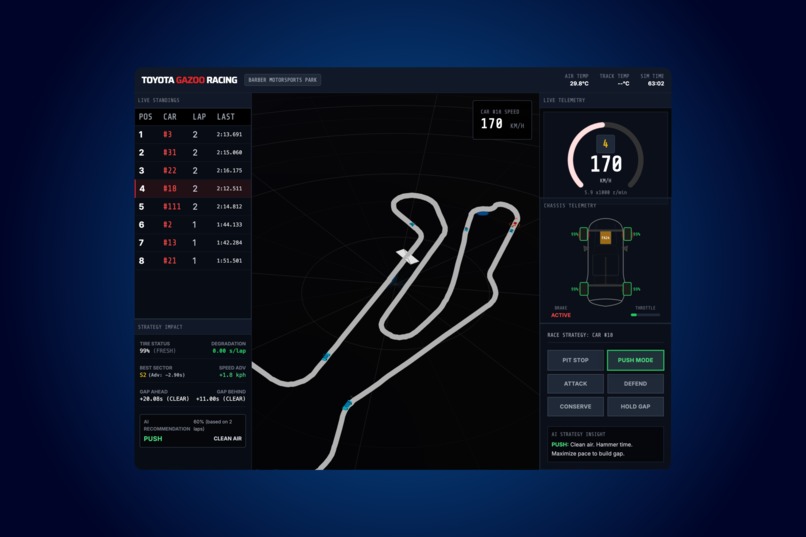
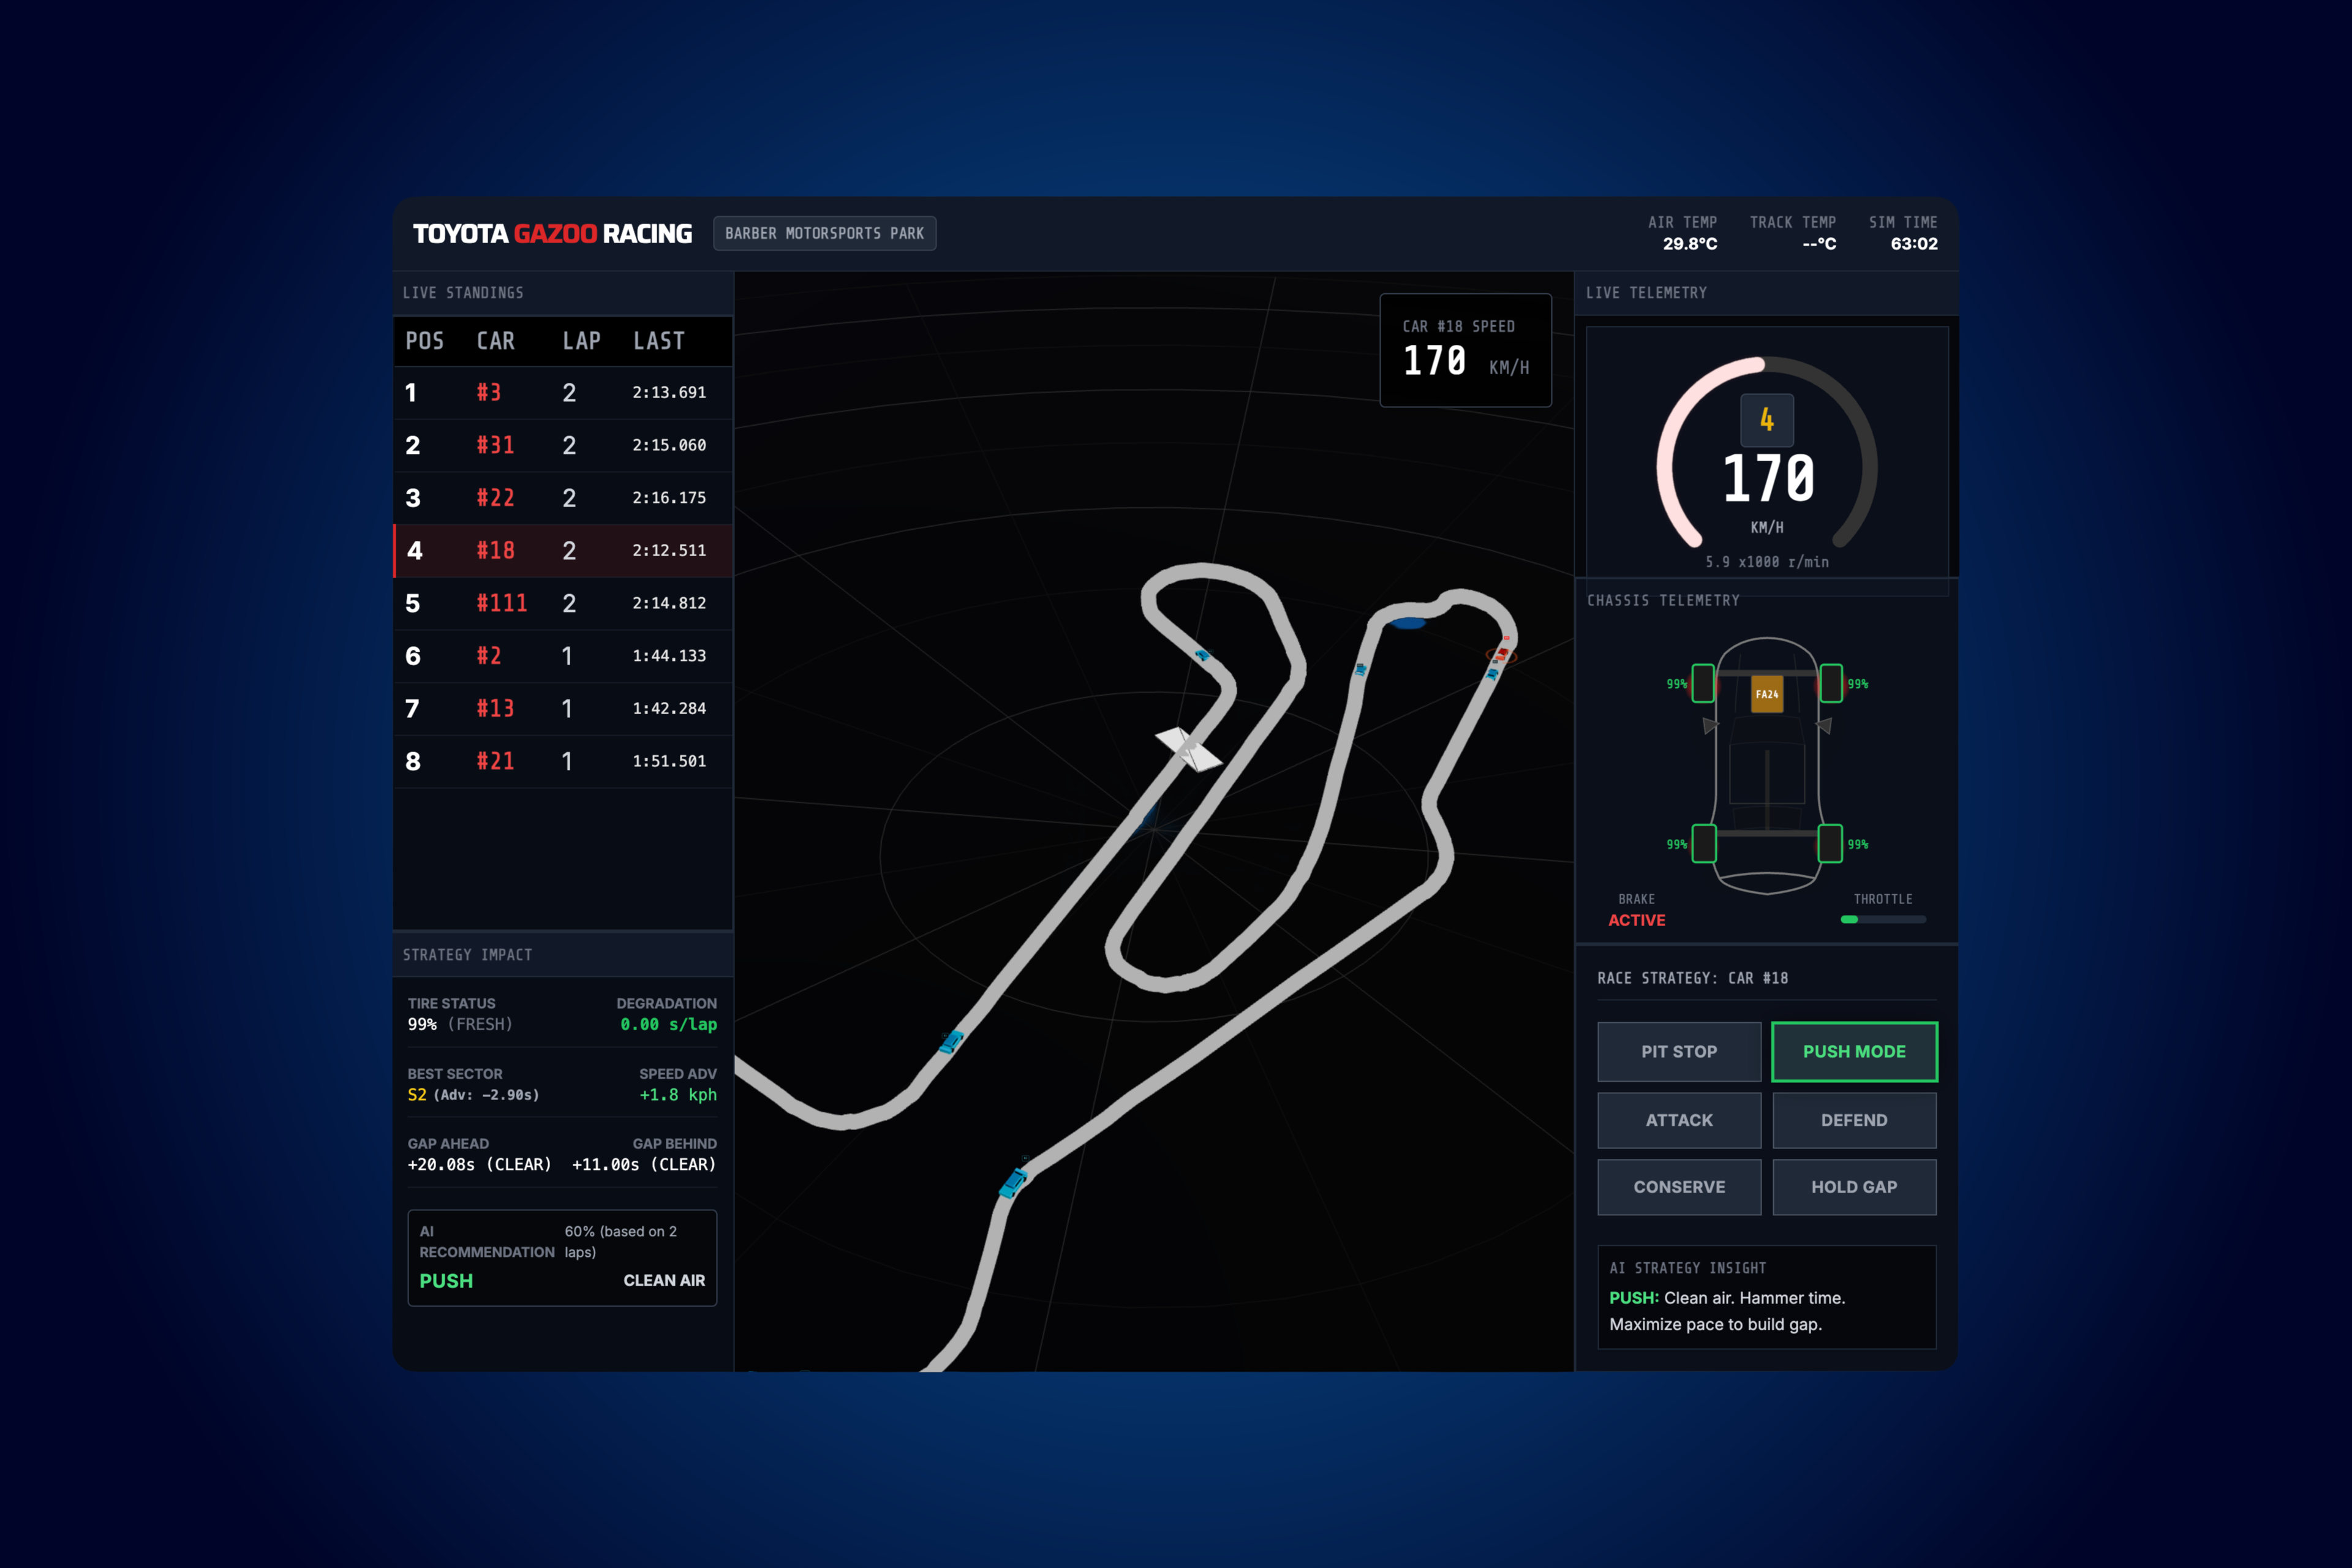
The GR Cup Real-Time Dashboard Simulator is a browser-based analytics and strategy tool designed for use by a race engineer on a tablet. It provides a real-time, visual experience of the race. It shows live standings and telemetry, while dynamically tracking all cars on the Barber Motorsports Park circuit, highlighting the selected car in red. The tool features a Strategy Impact panel displaying critical metrics like Tire Status and degradation, and competitor Gap Ahead/Behind. Most importantly, it uses AI to provide an immediate, data-driven recommendation (e.g., PUSH) and calculates the optimal Pit Stop window.
How I built it
The dashboard was built using JavaScript and the three.js library for the visualisation and car movement. The strategic insights and recommendations are generated using Google AI Studio. For data, I used the anonymised CSV files provided for the competition, including the Analysis Endurance and Weather data for Race 1, to simulate a live data feed. Creating the track layout involved tracing the Barber circuit on Google Maps, converting the file from KML to TXT, and then rendering it as an SVG to plot the animated car positions.
Challenges I ran into
The primary technical challenge involved accurately mapping the circuit and syncing the car movement. I had difficulty extracting the PNG from the supplied files, so I manually traced the circuit and converted the file to an SVG format for web rendering. Furthermore, I had to precisely "clip" the car models and program the simulation to ensure cars not only flowed around the track but also realistically slowed down at bends, adding complexity to the data synchronisation based on the start and end times provided in the CSV.
Accomplishments that I'm proud of
I am most proud of developing an elegant and highly functional solution. I created a clean, simple interface using a sans-serif font, optimised for rapid readability on a small screen under high pressure. A key accomplishment is the Actionable AI Insight system, which not only displays data but translates it into an immediate, justified action plan for the race engineer. I also successfully achieved a realistic simulation, showing cars moving and decelerating accurately on the custom-rendered track.
What I learned
I gained significant experience in the complexities of converting real-world geographic data into functional web visualisations. This project reinforced the need for custom solutions, such as tracing the track, when provided map files are challenging to integrate. I learned how to effectively process time-series race data to generate high-value strategic recommendations based on factors like tyre status and race positioning, emphasising the need for clarity and speed in the user experience.
What's next for GR Cup Real-Time Dashboard Simulator
The next steps involve moving beyond the current simulation to a fully live system. The priority is to link the dashboard to a live racing API so the telemetry data reflects what the car is actually doing in real-time. Future enhancements include refining the AI for advanced predictive modelling, such as forecasting competitor tyre wear, and developing features to allow the engineer to monitor and manage multiple cars simultaneously.


Log in or sign up for Devpost to join the conversation.