-
-
Global Social Media Trends Analytics

Inspiration
The inspiration for creating a Plotly Dash application came from the desire to bridge the gap between complex data analysis and intuitive user interaction. I wanted to build something that would allow users to explore data dynamically, without needing to write code themselves. The power of interactive visualizations has always fascinated me. Too often, stakeholders need to wait for analysts to generate new reports or charts. With Dash, I could empower them to ask their own questions and get immediate visual answers.
What it does
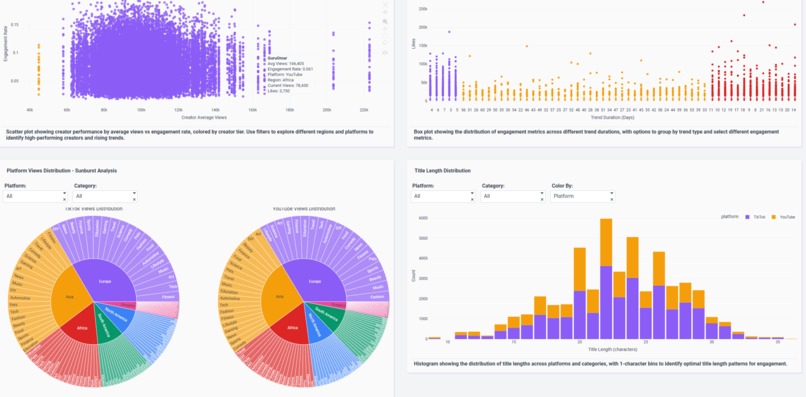
It shows how can you use this dashboard to look at trends during Q1&Q2 2025 for short films posted on Youtube or Tik Tok.
How we built it
It was built with Plotly Studio Desktop App.
Challenges we ran into
As I have no pro plan i could only use prompt and I need to wait for respond from app for quite a long time
Accomplishments that we're proud of
I am proud of making extra graphs like sunburst and histogram.
What we learned
I learned that I can built prototype fast that are based on dash framework. Then I can modify code on my own.
What's next for YouTube Shorts & TikTok 2025 Trends
This is demo to encourage you to use plotly and dash as your platform for spreading and sharing data.
Built With
- cloud
- plotly
- studio


Log in or sign up for Devpost to join the conversation.