As CS majors, team members often fear that, despite being "in tech," we contribute very little to the actual advancement of human knowledge, in stead cashing in on our skills by bringing convenience and novelty to the uninitiated. So, in planning our project, we spoke to a variety of "pure" scientists and some engineers, asking what software they didn't have but would use in their work.
We got a lot of responses, but our favorite was from the Analytical Chemists. Chemists collect many data points, often spaced a few minutes apart, and don't have a lot of time to spend on data entry and analysis while performing reactions. But, it is important to quickly tell if a given result is within the range of acceptable values, or if it needs to be re-sampled. To this end, it is necessary to perform a linear regression on all of the points accessible so far, and to perform a Grubb test for outliers, both of which help to establish the legitimacy or erroniousness of a given reading. The best solution they'd come up with were cumbersome excel spreadsheets.
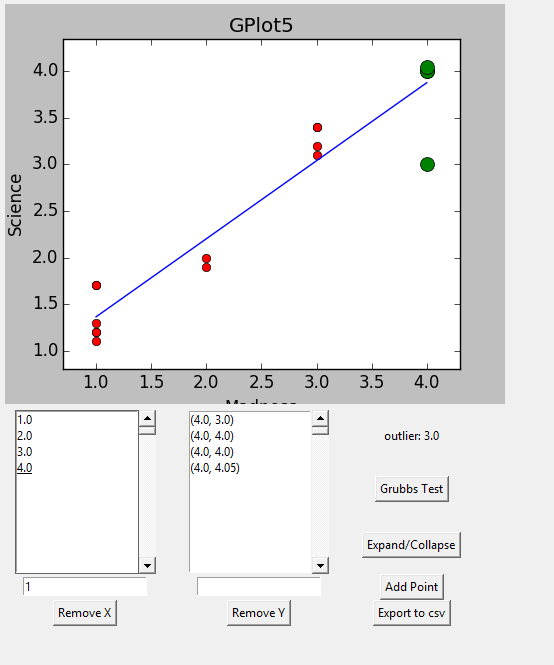
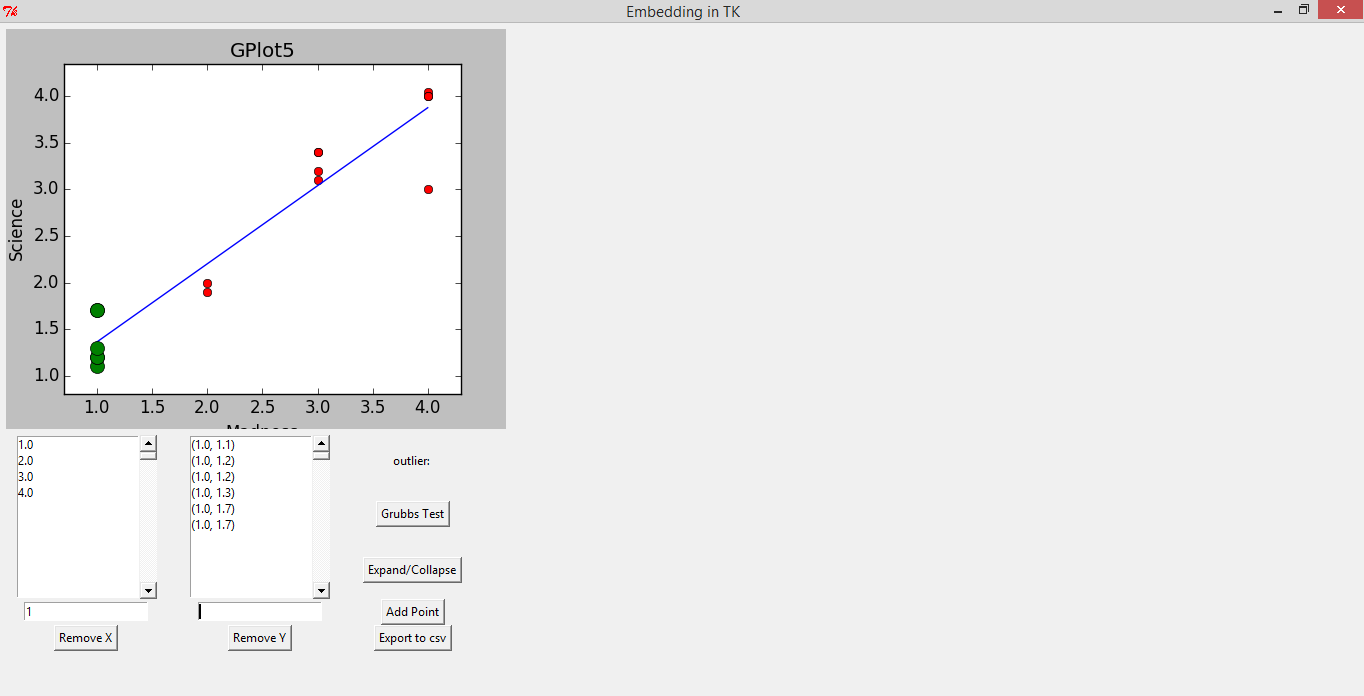
So, we did all of those things. Real-time plotting with a live, fast-updating regression line. Clustering of points into groups for Grubb testing. One-click point removal. The ability to collapse a group into its average point once you determine there are no outliers. Double-click on a group to highlight those points in the graph. The ability to export all entered data to a .csv file for later analysis. (Which immediately opens in the OS's default file for opening .txt - either text edit or notepad, usually :D. I'm particularly proud of this.)
We hope that our time today will increase the lab efficiency of chemists, both in class labs and independent research.
Built With
- matplotlib
- python
- tkinter

Log in or sign up for Devpost to join the conversation.