-
-
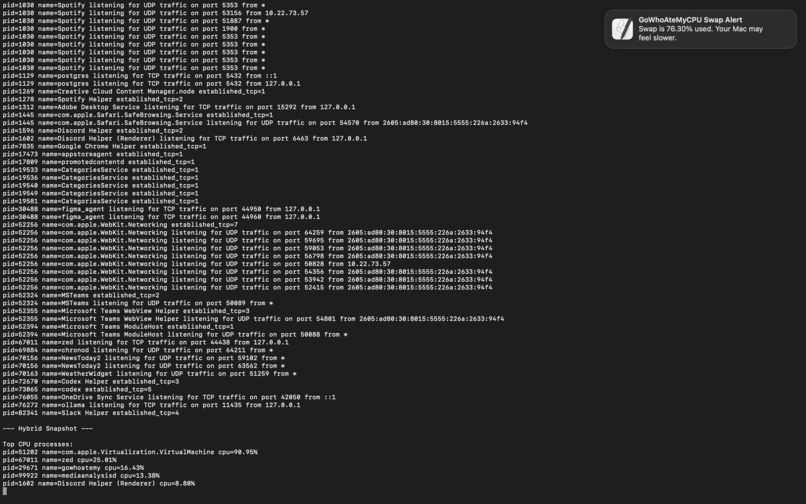
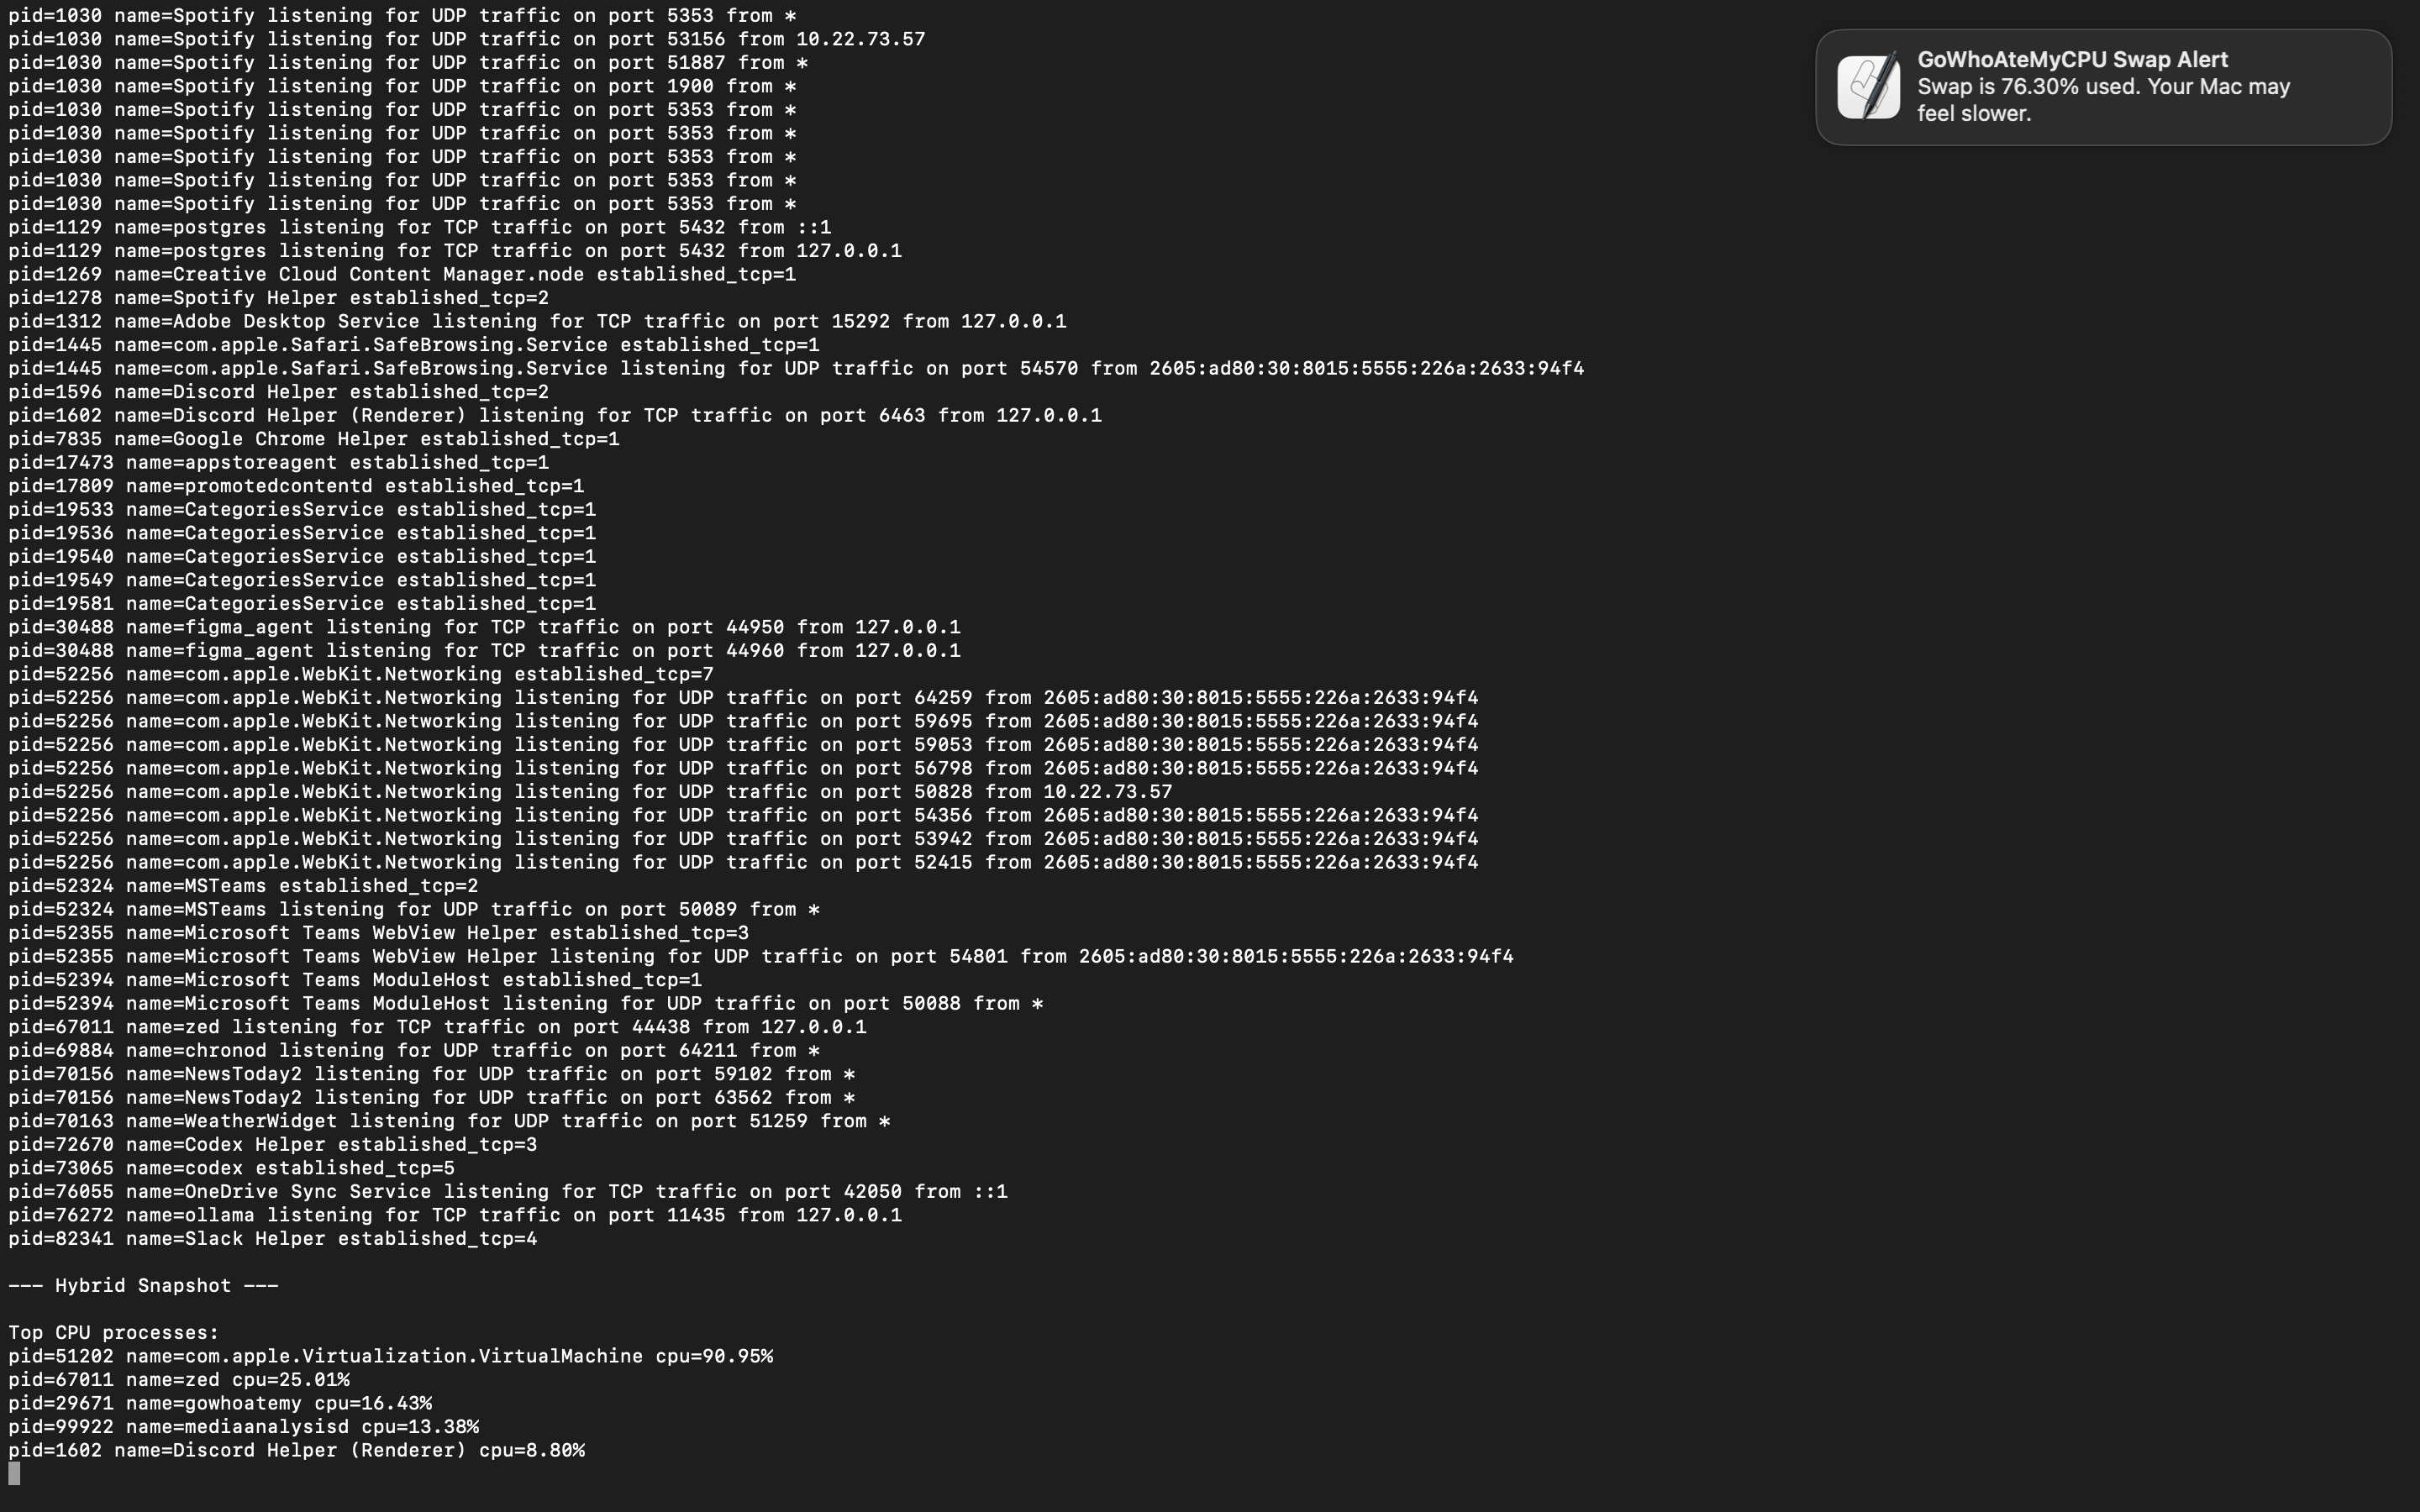
GoWhoAteMy detecting swap memory amount and notifying
-
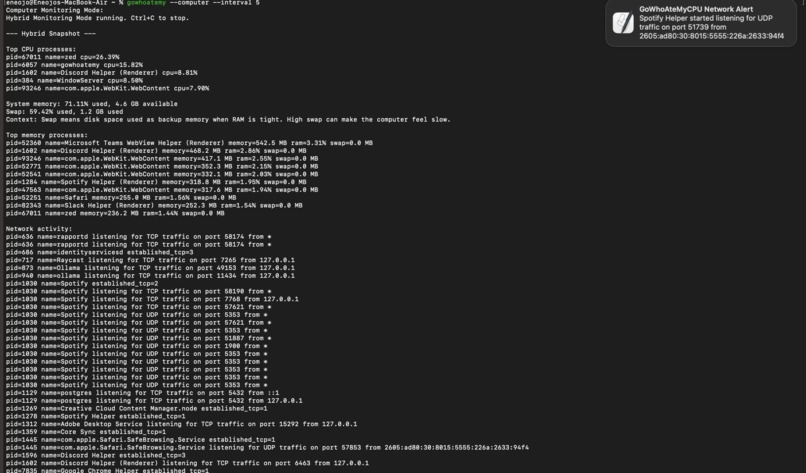
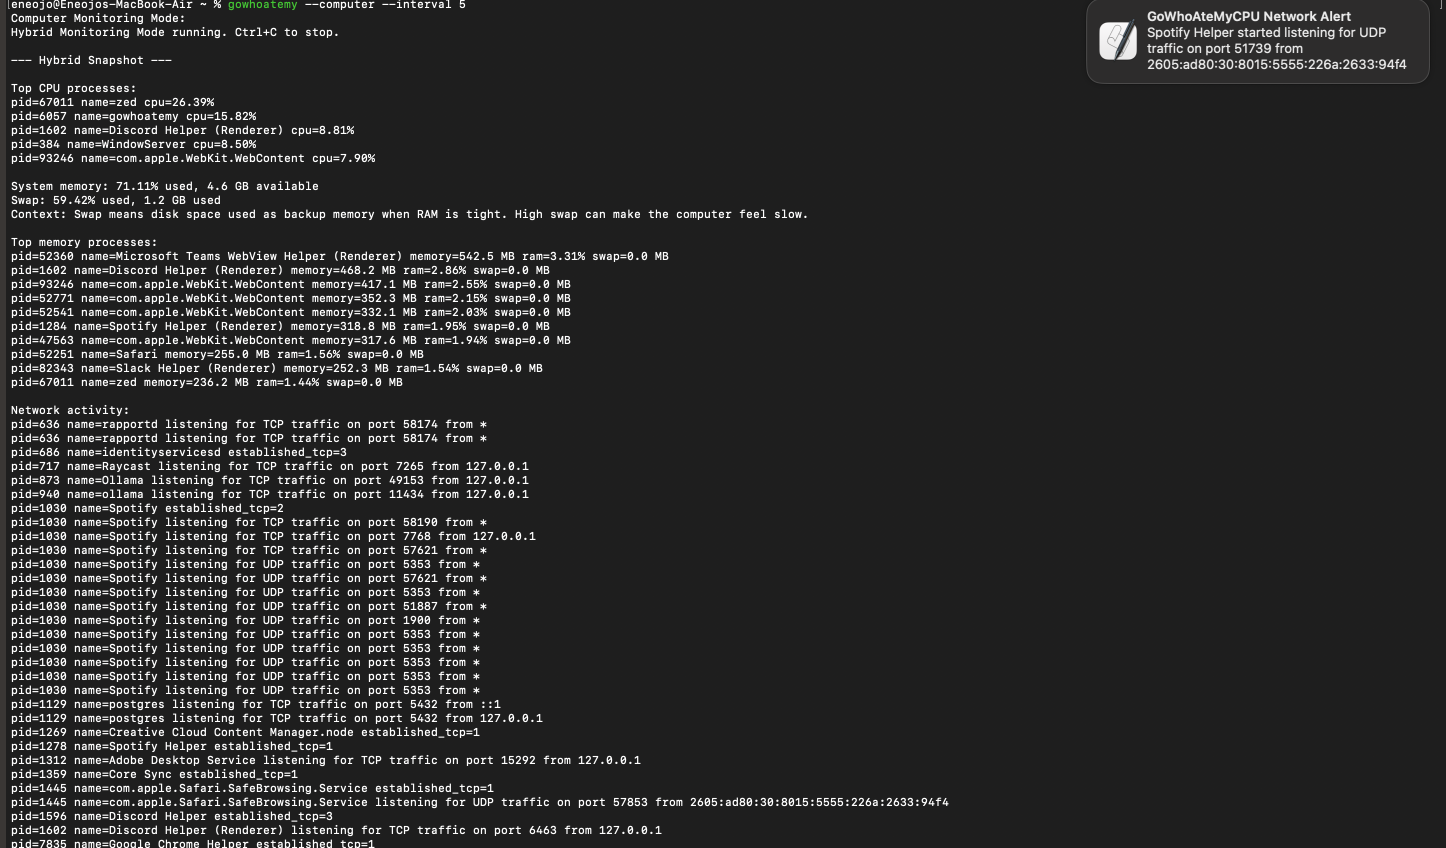
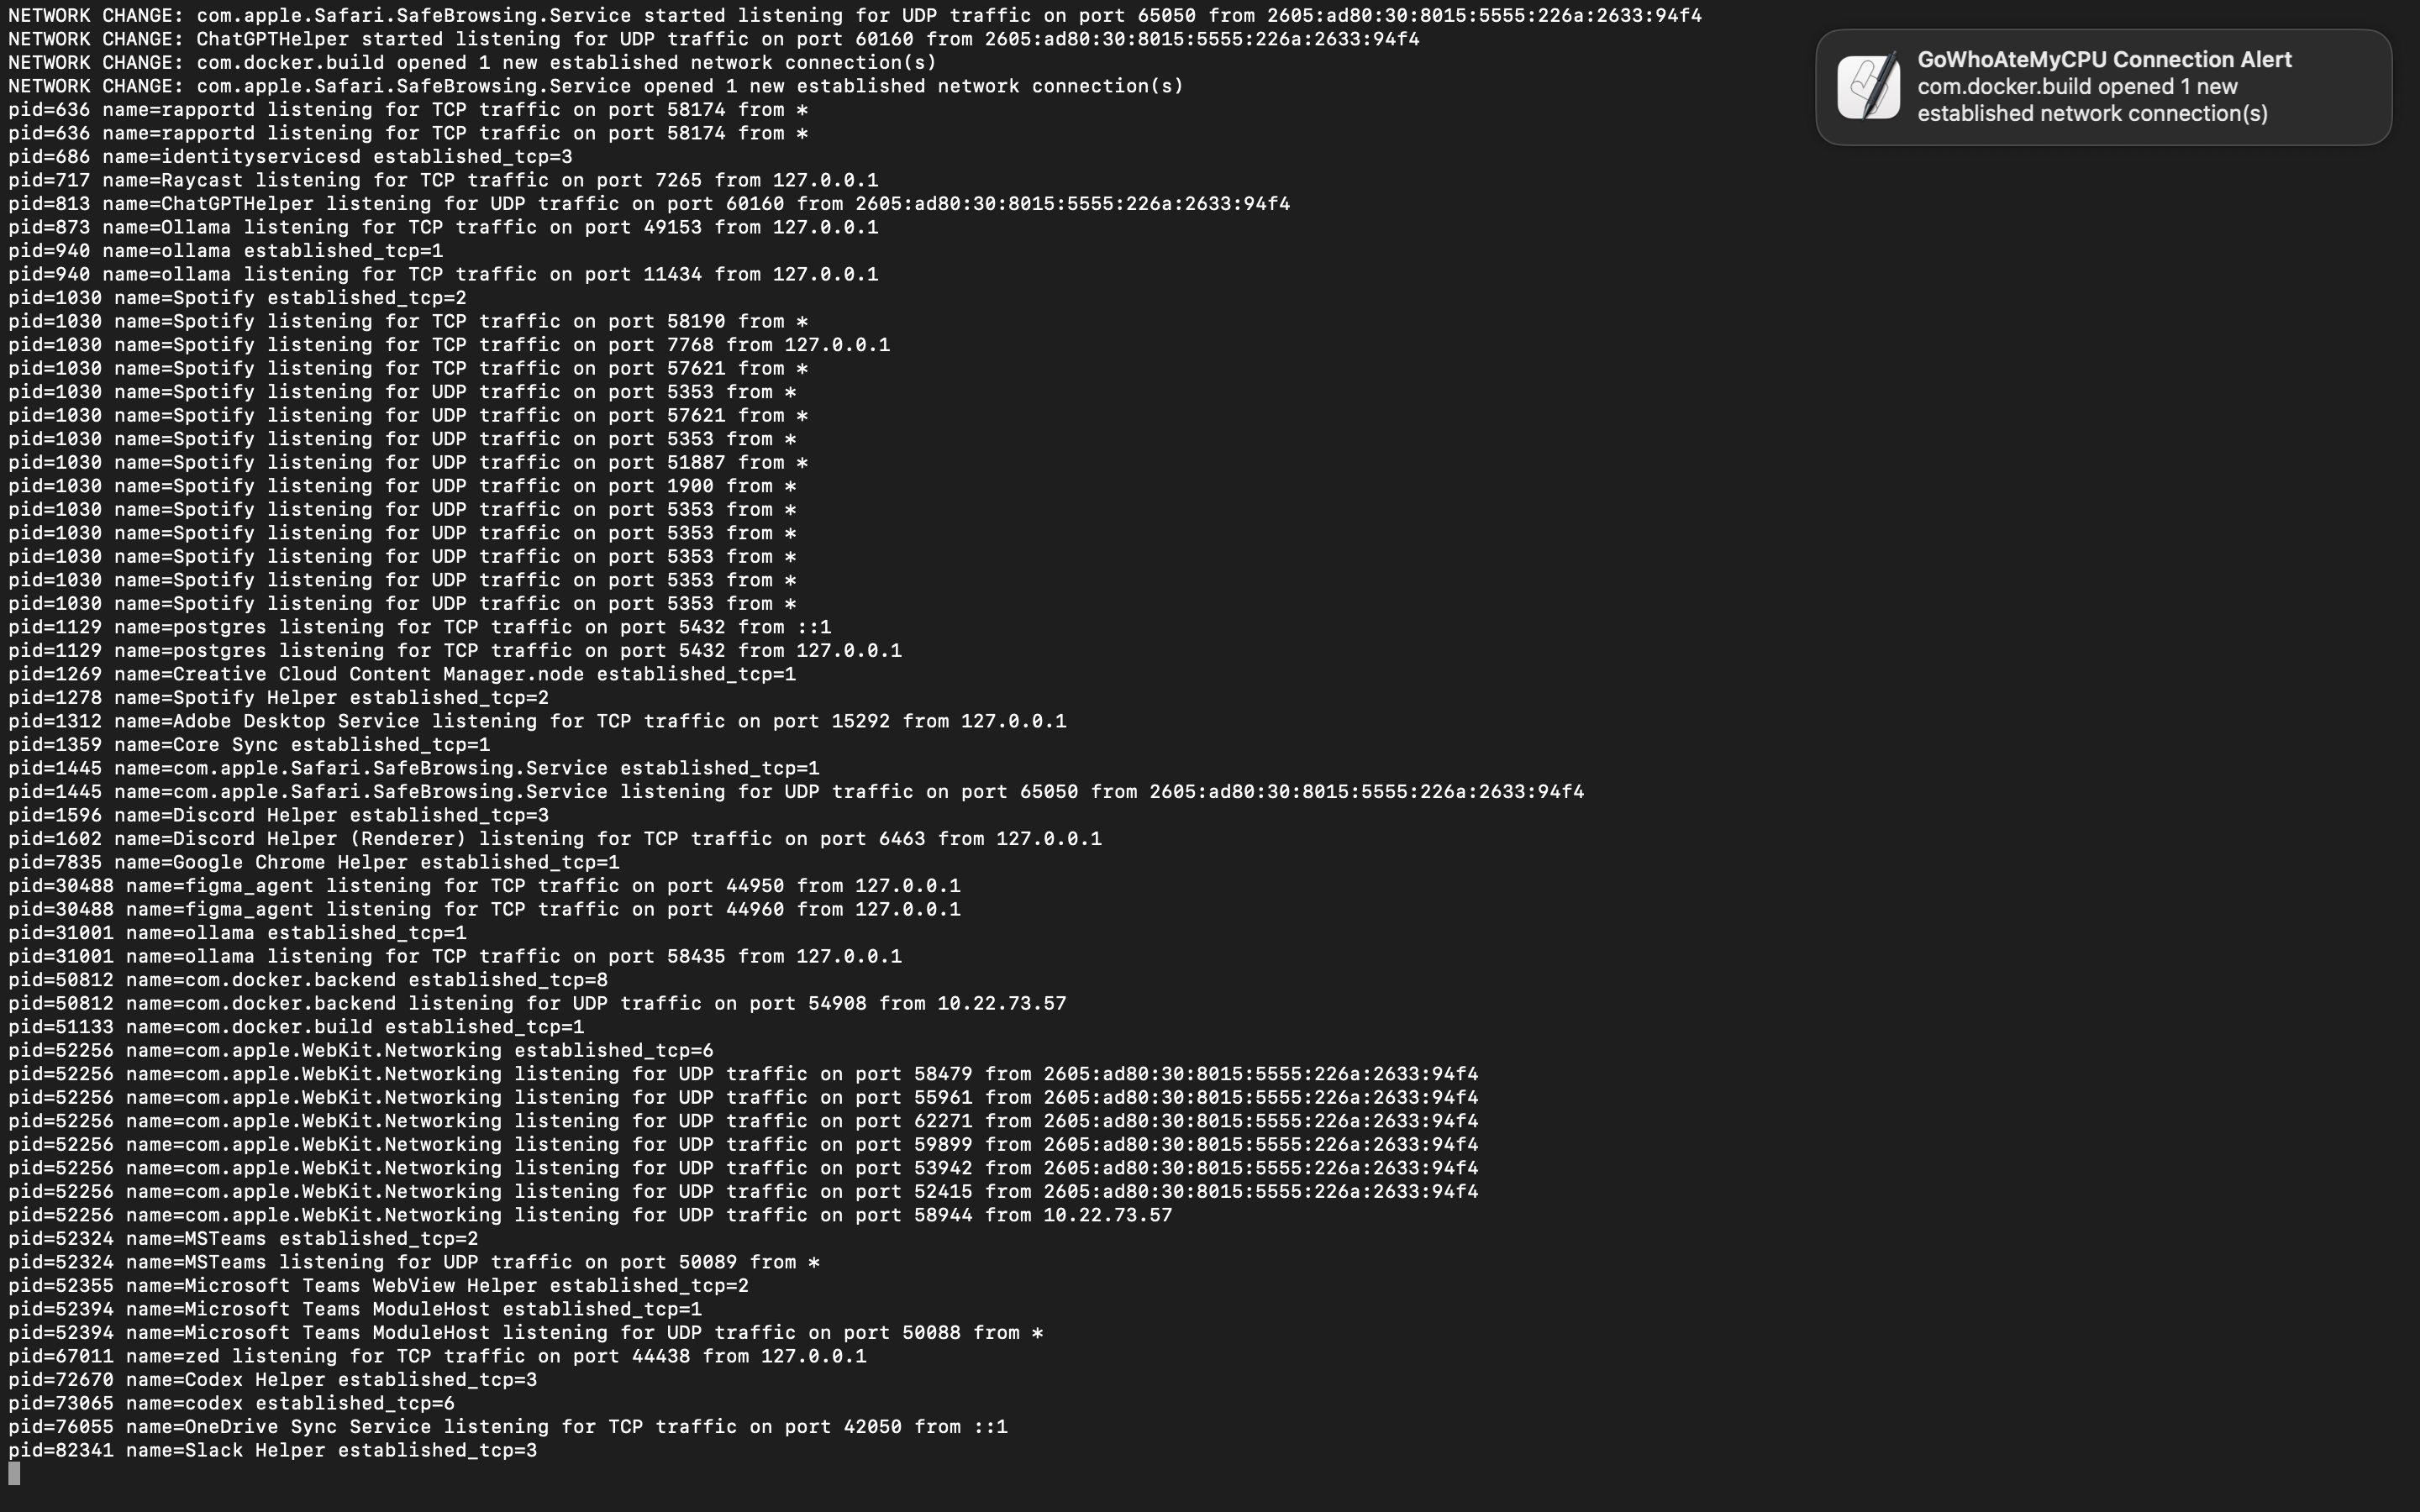
GoWhoAteMy detecting new udp connection and sending out notification
-
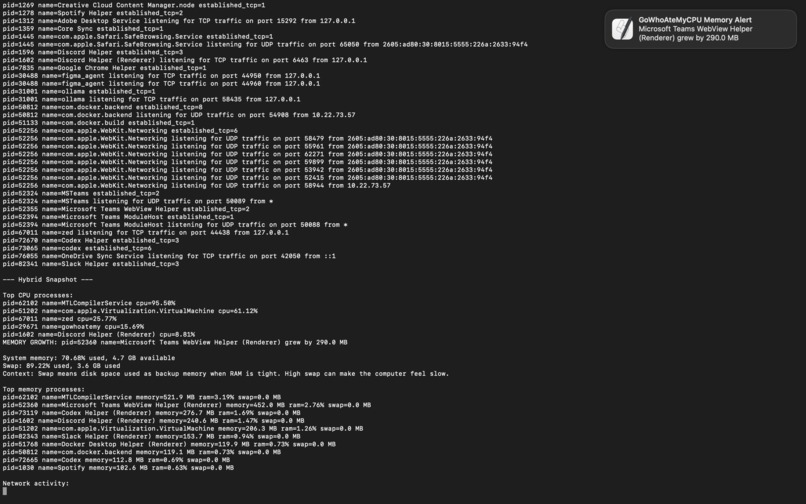
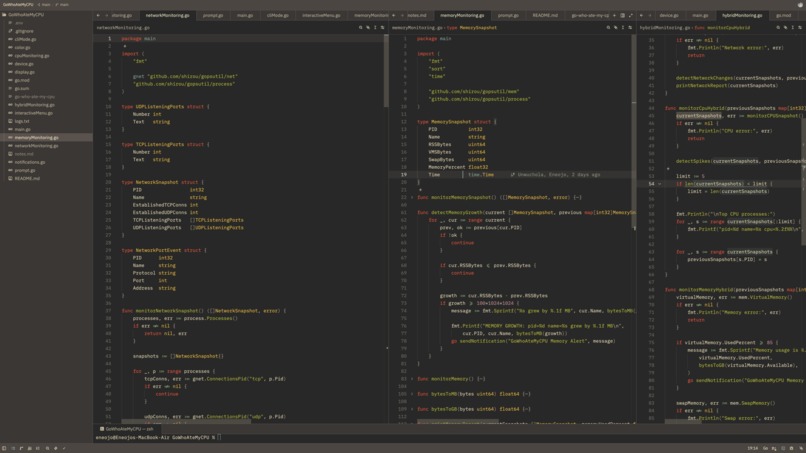
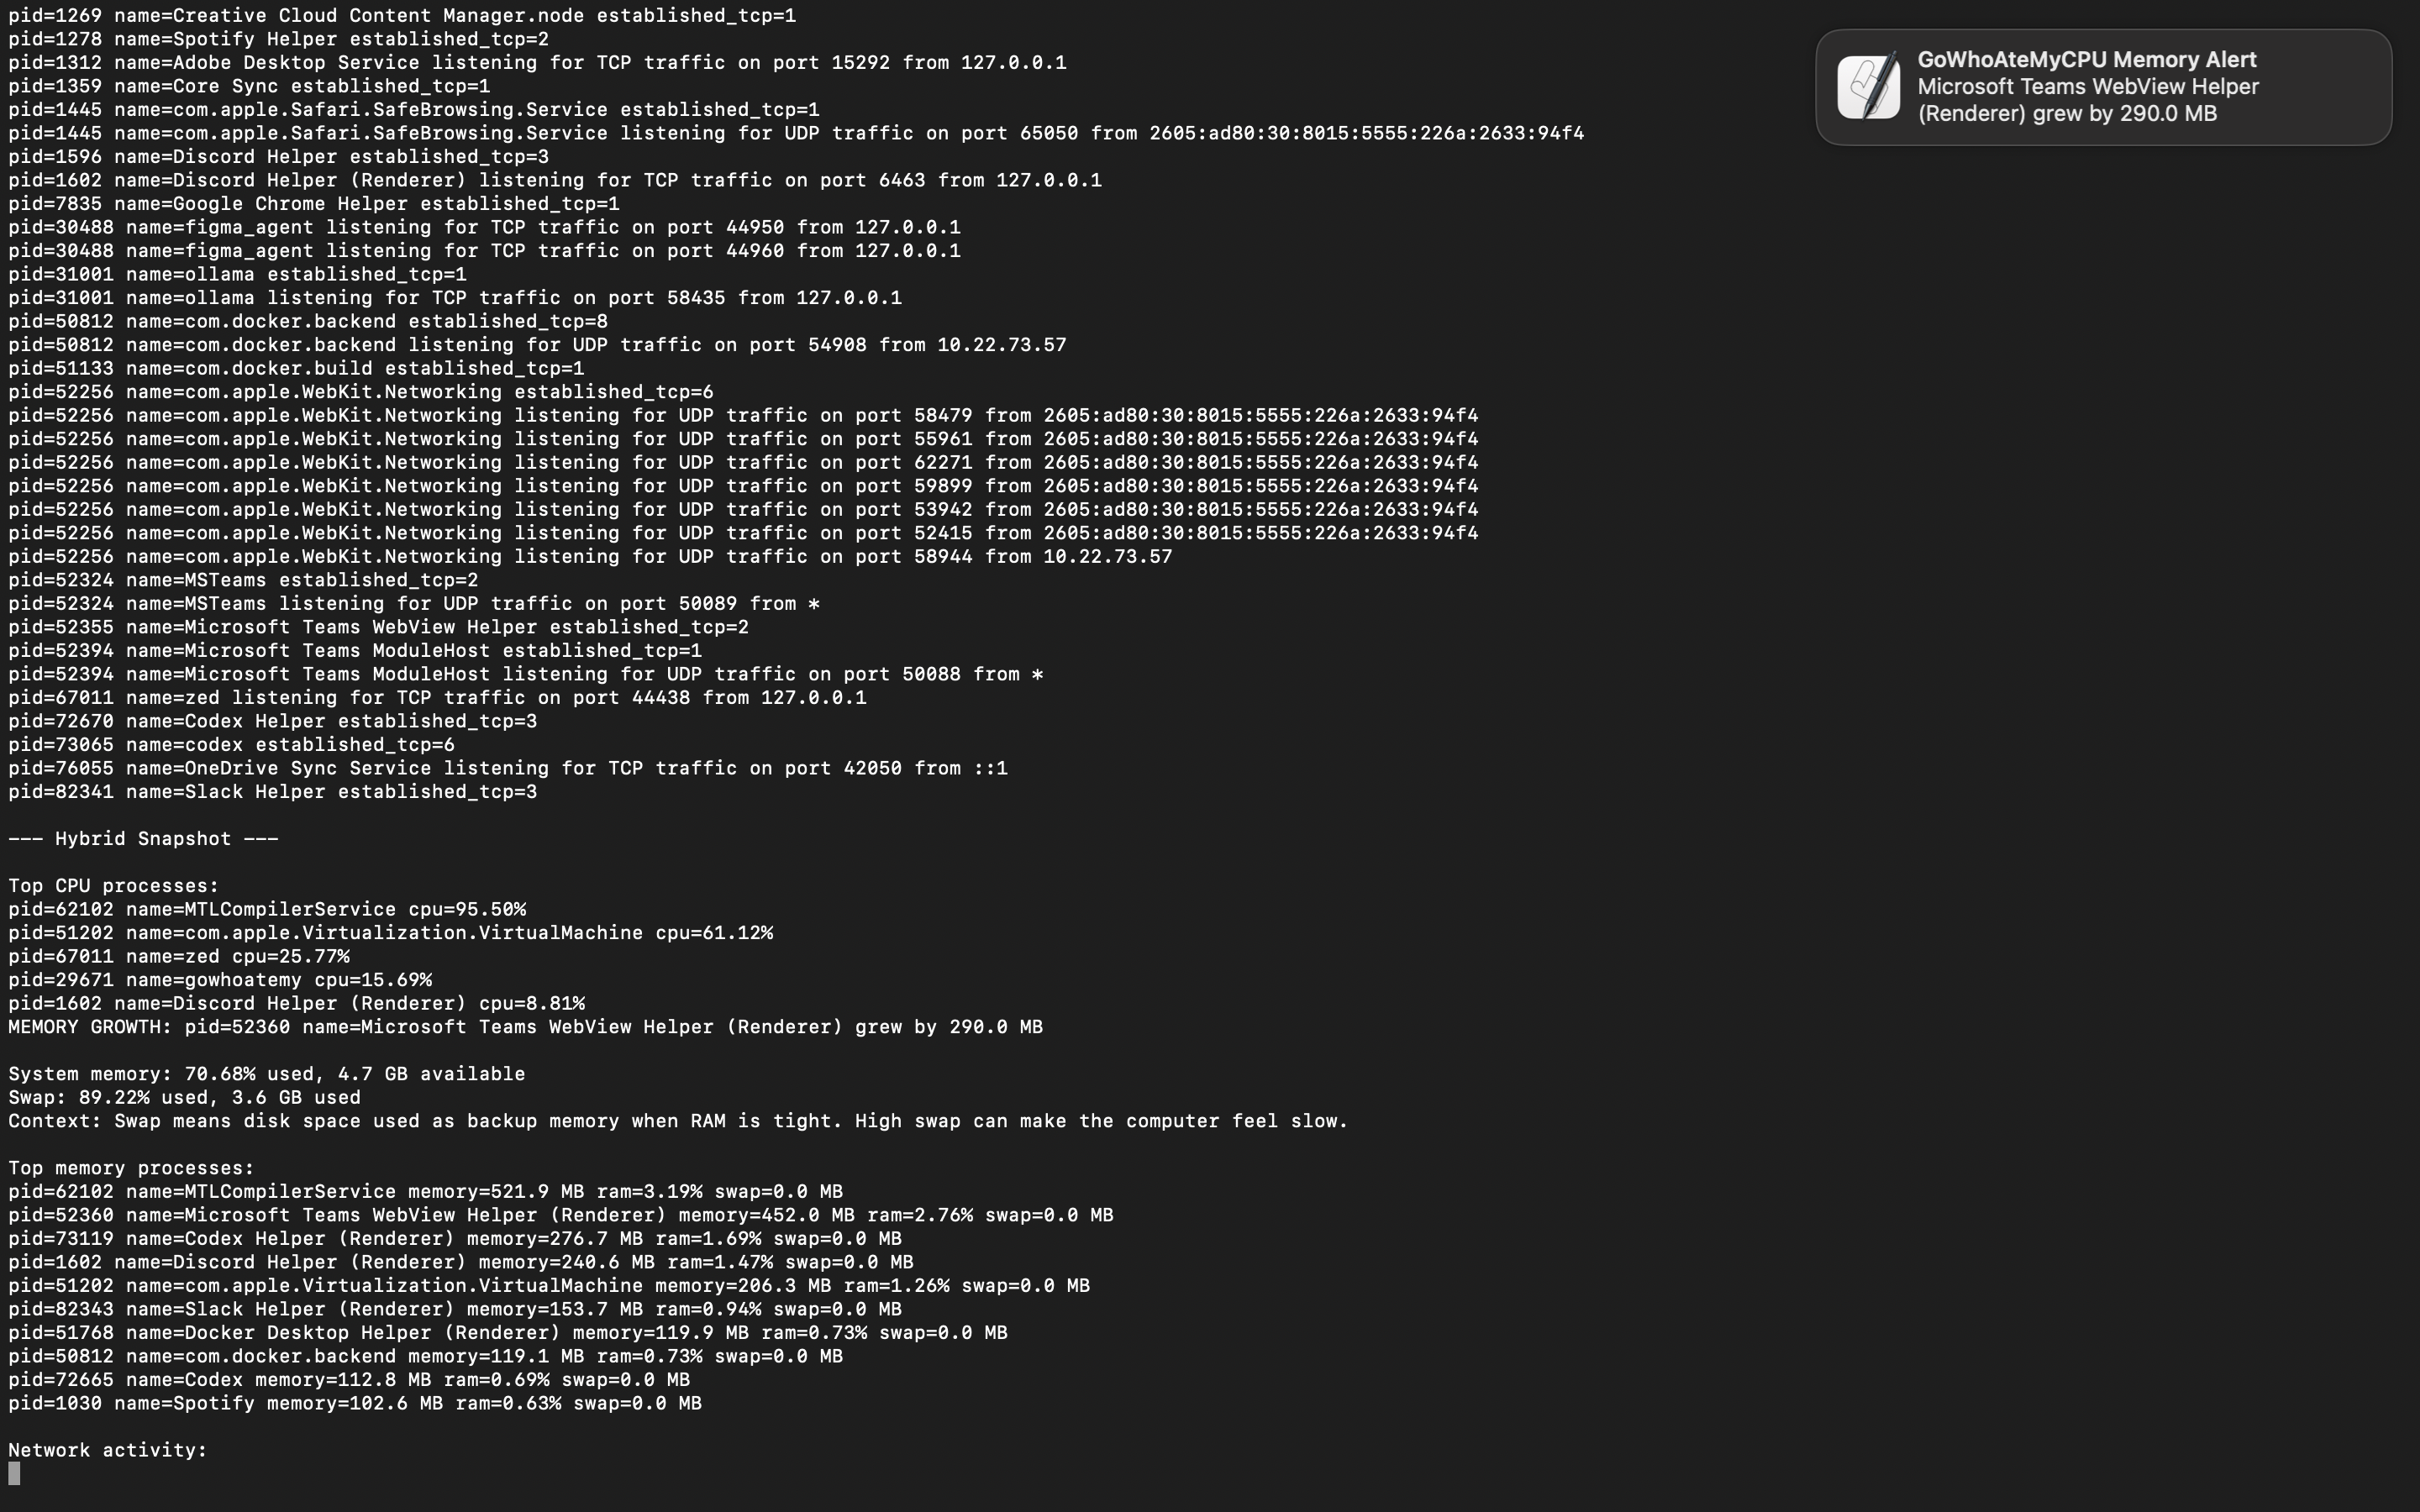
GoWhoAteMy detecting memory spike and sending notification
-
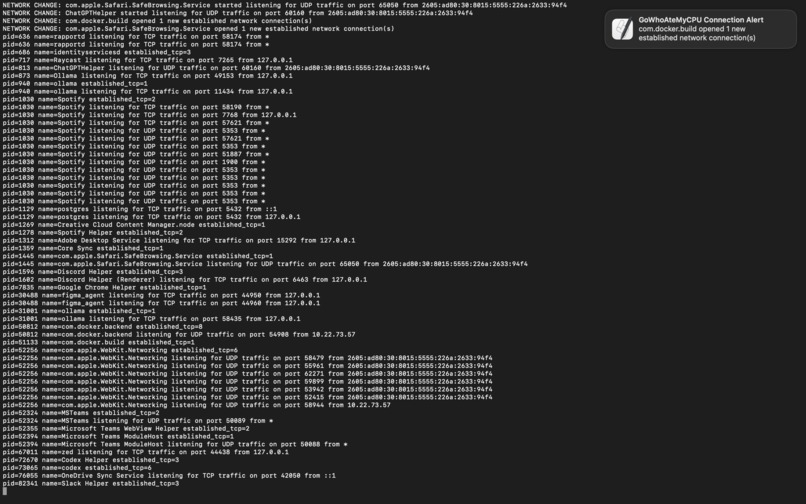
GoWhoAteMy detecting new docker port and sending notification
-
Repo Code
GoWhoAteMy
When my laptop slows down, I usually have to open a bunch of different tools just to figure out what's happening. top shows CPU. Activity Monitor shows memory. Network commands show ports and connections. Logs dump a wall of text. None of them really answer the actual question:
What is slowing my computer down right now?
I built GoWhoAteMy to bring CPU, memory, and networking into one place and explain what's happening in plain language not just raw numbers.
What It Does
GoWhoAteMyCPU is a CLI tool that monitors:
- CPU usage per process
- Memory usage per process
- System memory and swap usage
- TCP/UDP listening ports
- Established network connections
- Abnormal changes over time
It has separate modes for CPU, memory, and network monitoring, plus a full computer mode that watches everything together:
gowhoatemy --cpu
gowhoatemy --memory
gowhoatemy --network
gowhoatemy --computer --interval 10
Instead of dumping raw metrics, it explains what changed:
Spotify started listening for UDP traffic on port 5353
node grew by 140 MB
Chrome CPU jumped from 4% to 19%
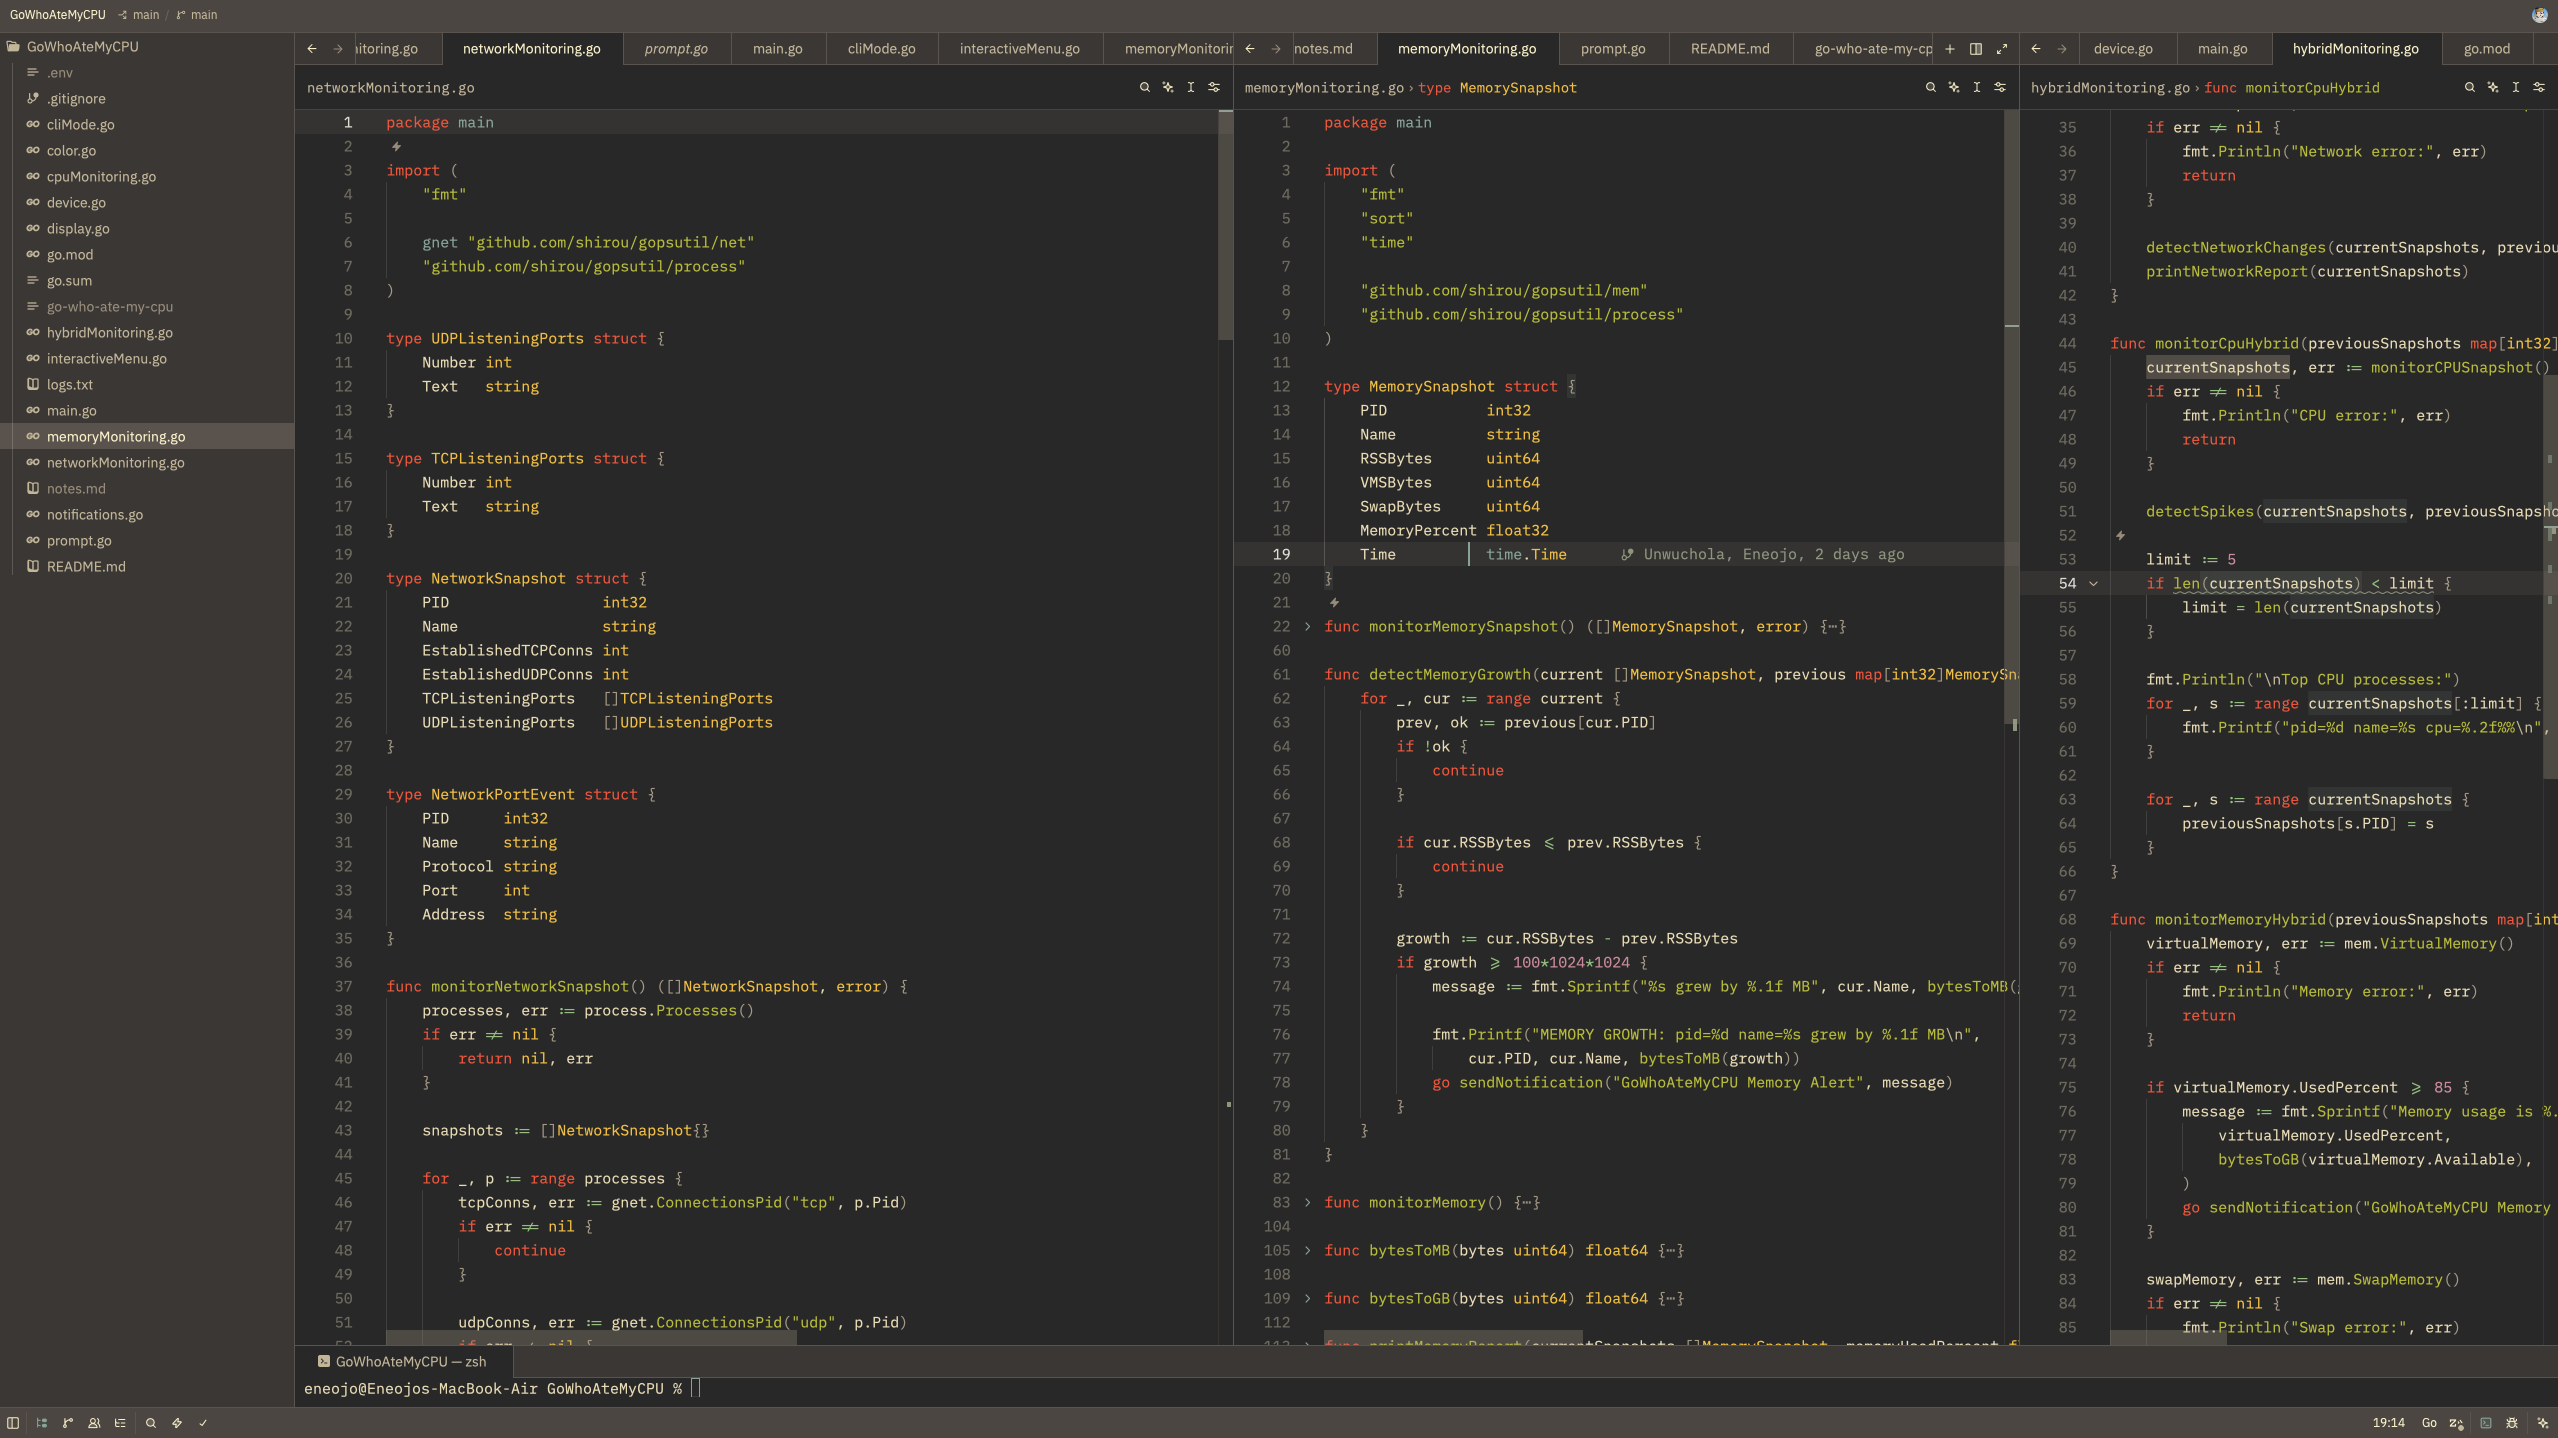
How I Built It
I built it in Go, wanting something lightweight that sits close to the system.
gopsutil handles the data collection: CPU, memory, process info, disk, and network metrics.
The core idea is snapshots. The tool captures system state, waits an interval, captures again, then diffs the two. Memory and networking are straightforward enough; read the current RSS, swap usage, listening ports, and established connections.
For the CLI I used Kong as the cli parser so the program could be used with proper flags and subcommands. Notifications use macOS osascript..
Challenges
Making output useful, not just complete. I kept asking: would this make sense to someone who just wants to know why their computer is slow?
Network addresses are messy. Ports and addresses can show up as *, localhost, or IPv6 depending on context had to understand what each format actually meant before I could display them in a good way
CPU spike detection It was a little different than network and memory monitoring mode
Built With
- golang
- gopsutil
- kong

Log in or sign up for Devpost to join the conversation.