-
-
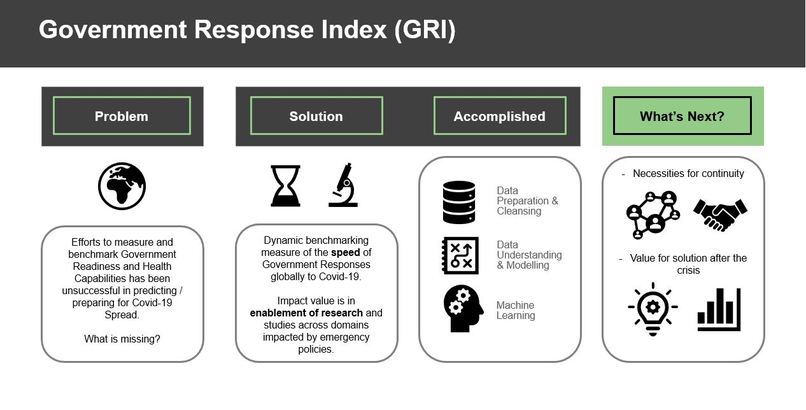
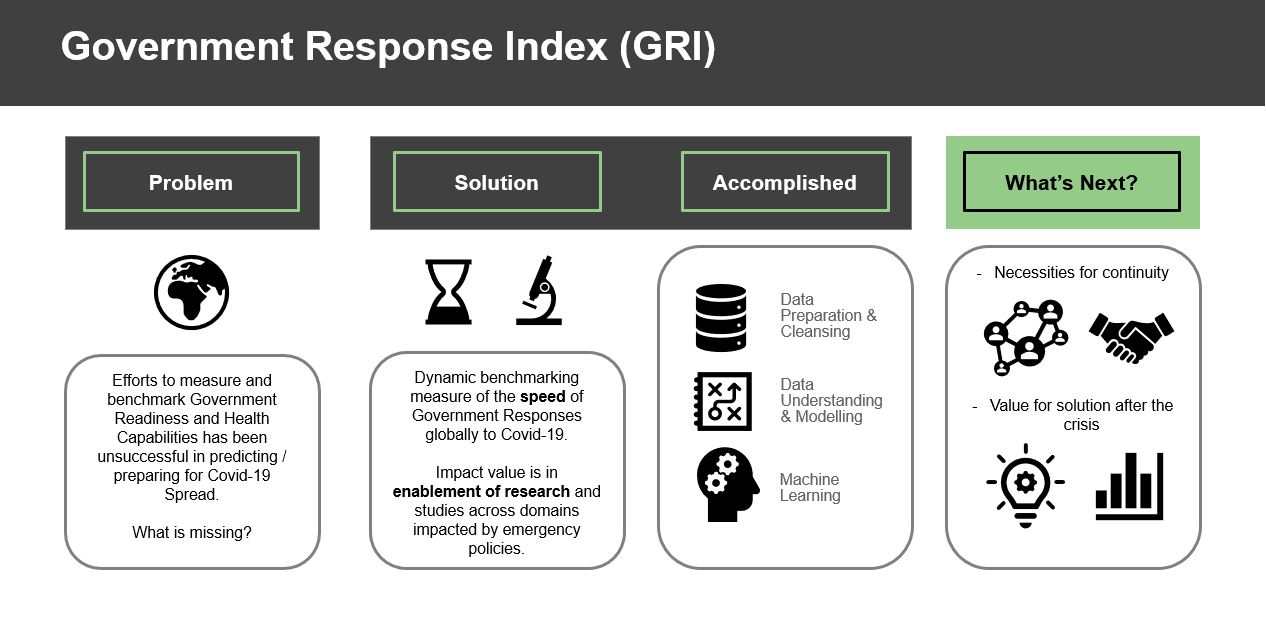
High-level Business Case
-
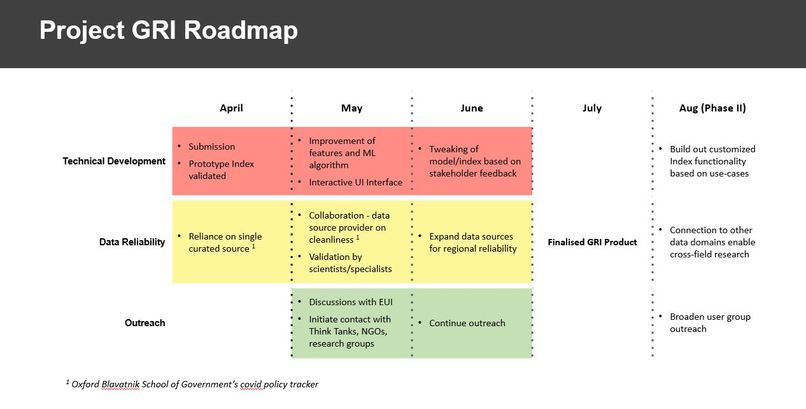
Product Roadmap and Plan
-
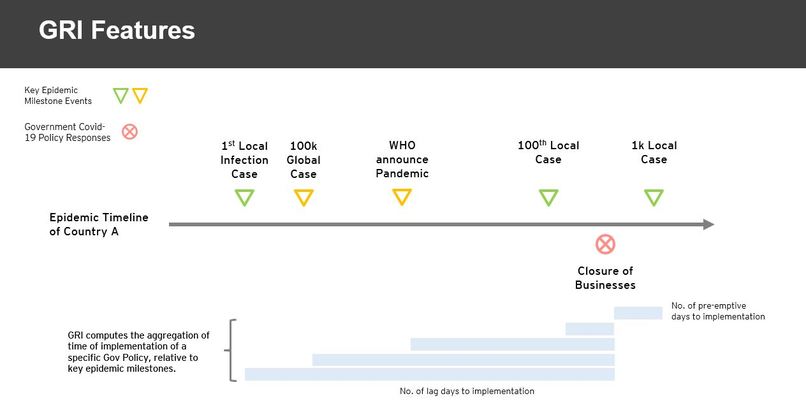
Illustration of the Index feature component
-
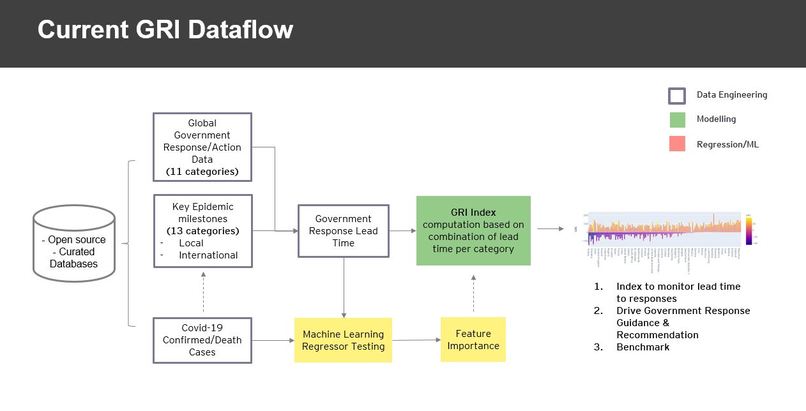
GRI Dataflow


When and how quickly should governments implement containment restrictions during a pandemic? This Index uses a machine learning-assisted approach with temporal features to inform you.
Inspiration
Prior to SARS-CoV-2, it seemed obvious which countries had the most robust infrastructure, systems and health measures in place to contain an epidemic/pandemic. Several indexes had also attempted to measure government preparedness, such as the Health index.
However with the coronavirus epicenters shifted to Central Europe and North America, it is now clear that we are missing several important factors in monitoring government responses to pandemics.
Two previously unmeasured factors which we now observe to be of vital importance are:
- the Speed of governments in recognizing an epidemic threat and kicking off testing and containment measures;
- the Timing of implementation, so as to maximise the the public health benefits, while minimising the strain on individuals and businesses.
Moving forward, governments and research institutions need to study and understand the impact of these restriction measures across various domains, including sociopolitical, economic, mental, etc.
What it does
Introducing the Government Responsiveness Index (GRI)
The GRI provides a dynamic benchmarking measure of the speed of Government responses globally to Covid-19. Speed is assessed by government actions taken relative to several key epidemic milestones events (ie. day of first infection, day of infections by increasing order of magnitude, international pandemic announcements).
The GRI is built from a combination of:
- 11 Categories of Government Actions; and
- 13 key Epidemic Milestone events; resulting in
- 143 Temporal features (weighted by Machine Learning feature importance); across
- 138 Countries
The GRI's primary users are likely to be government/public policy action teams, research groups, universities, or anyone studying the impact of government pandemic controls during and post-COVID-19. Researchers can leverage the following aspects and capabilities of the GRI:
- A comparable cross-country/region benchmark on Gov policies;
- Useful base data that measures preemptive or delayed responses by number of days;
- A Machine Learning model that explains which Policy implemented at which Timing resulted in the most Impact.
The GRI currently pulls open source data from Oxford OxCGRT for government action dates and categories; and John Hopkins CCSE for cumulative COVID-19 infection/death rates.
What Do the Experts Say?
Is there truly a use-case for this Index? Over the course of the Hackathon, feedback has been obtained from mentors/experts on how they would imagine themselves leveraging the GRI in the field:
Aiste Lehmann (Business Continuity) - - - Expanding index features to include dates of removal/release of government restrictions - - - Impact of the timing of restriction implementations, on the time taken to re-open / remove restrictions - - - Studying the effectiveness of policies in reducing infection rates and further reducing the strain on hospitals
Tamara Espineira (Social & Political Science) - - - The coincidence (or not) with elections and the stability of political majorities, on the implementation of restrictions during epidemics - - - Studies on the level of centralisation of governments at national and state level, and the impact on implementation speed during epidemics - - - Correlation studies against Transparency, Corruption and Human Development Indexes
Jakub Legat (Economics) - - - Impact analysis on various sectors as disrupted by timing of government restriction policies - - - Combination with various country demographic and economic factors as a better predictor for Infection rates - - - Analysis on the least impactful policies, and recommendation to have these eased up first
Data Journey Over the Weekend
Refer to GRI Dataflow slide
Data Preparation & Cleansing Data pulled from Oxford and John Hopkins had to be cleansed and restructured into the proper format. Different formats in country/region names, dates and ranges of data had to be treated with the help of various Python libraries.
Data Understanding & Modelling Building the features of the GRI required extracting all the specific 13 key epidemic milestone events from the Confirmed Infection Cases data, unique to each and every country. Next the same was done for each of the specific 11 categories of Government Responses, also unique to each country.
Finally each Key milestone event is mapped back to each category of government responses for each country. This is how 143 Temporal features are obtained to compute the GRI.
Machine Learning & Feature Explainability The hypothesis to be tested was that the speed and timing of government implementations could affect the outcome of infection rates in countries.
For this, several Machine Learning regression algorithms were used to test the GRI temporal features in explaining the variance for population normalised Confirmed Infection Cases. Regression algorithms included Extra Trees Regressors, LGBM, XGB and Random Forest regressors, and scored against Holdout and Cross-validated test sets. Results were very promising with initial test runs of 27 temporal features resulting in an explainability of 30% of the variance and R2 of 0.3. Subsequent tests using the full extent of the temporal features resulted in an increase of variance explainability to an average of 45%, with one run reaching upwards of 70%.
By assessing the feature importance, we are also able to determine which temporal factor (which is essentially a cross section of a Government Action at a point in time) is most significant in predicting the Confirmed Infection Cases. This is how we are able to identify when is the best time to implement a certain Government restriction.
Visualisations Please refer to the demo link below.
The icing on the cake, built mainly using Plotly.
The usefulness of the GRI stems from the index itself and the features used to compute it, therefore visualizations are merely an add-on. However some nice visuals are always great to stimulate the imagination on how it can be used.
What's next for Government Responsiveness Index (GRI)
Project Continuity
Refer to GRI Roadmap slide
Outreach - This has to happen immediately with potential user groups (government and research institutions) in order to verify the usability of the GRI. As these user groups will eventually rely on the GRI in their studies, close collaboration is encouraged.
Data Reliability - Collaboration with data source providers such as Oxford is highly desirable, to increase data understanding and maintain data cleanliness. Further collaboration with regional and local government policy data providers will also help increase the granularity of the computations.
As at date, a collaboration request has been sent to the Oxford team, however a response is yet to be received
Technical Development - Continuous improvements of the Index computation complexity, the underlying data structures, as well as the Machine Learning models. Feedback from user groups will also result in tweaks to the index.
Value after the Crisis
The impacts of Covid-19 will long exceed the current public health crisis.
In terms of the studies from all fields on the impact of the implementation of widespread emergency policies on various aspects of life.
And in terms of the learnings we will derive in order to combat future pandemics that will occur at higher frequencies in shorter intervals. We need to meticulously study the approaches, the best practices, and the blunders made in order to develop robust frameworks in our fight against the invisible enemy.
This is where the GRI finds its purpose, not as the ultimate solution, but as the first of many more complex solutions to come, that leverages data and machine learning to drive meaningful insights and correlations.


Log in or sign up for Devpost to join the conversation.