Inspiration
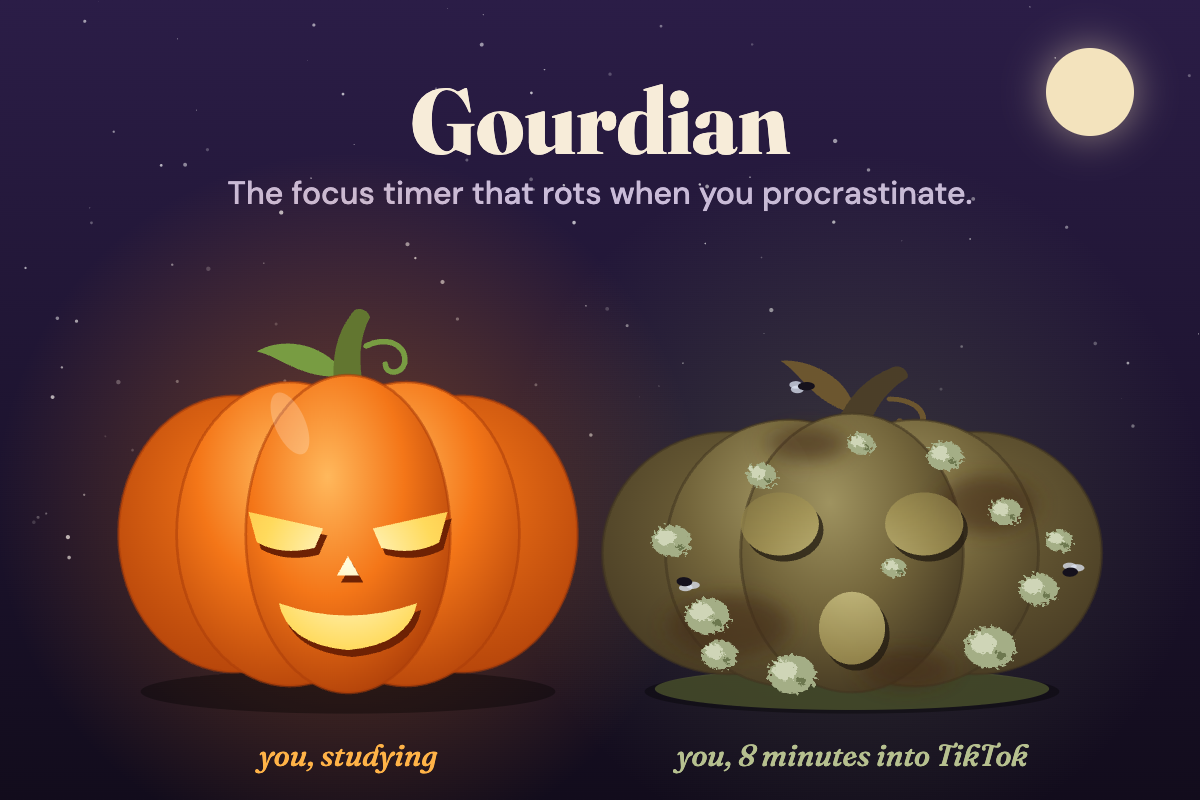
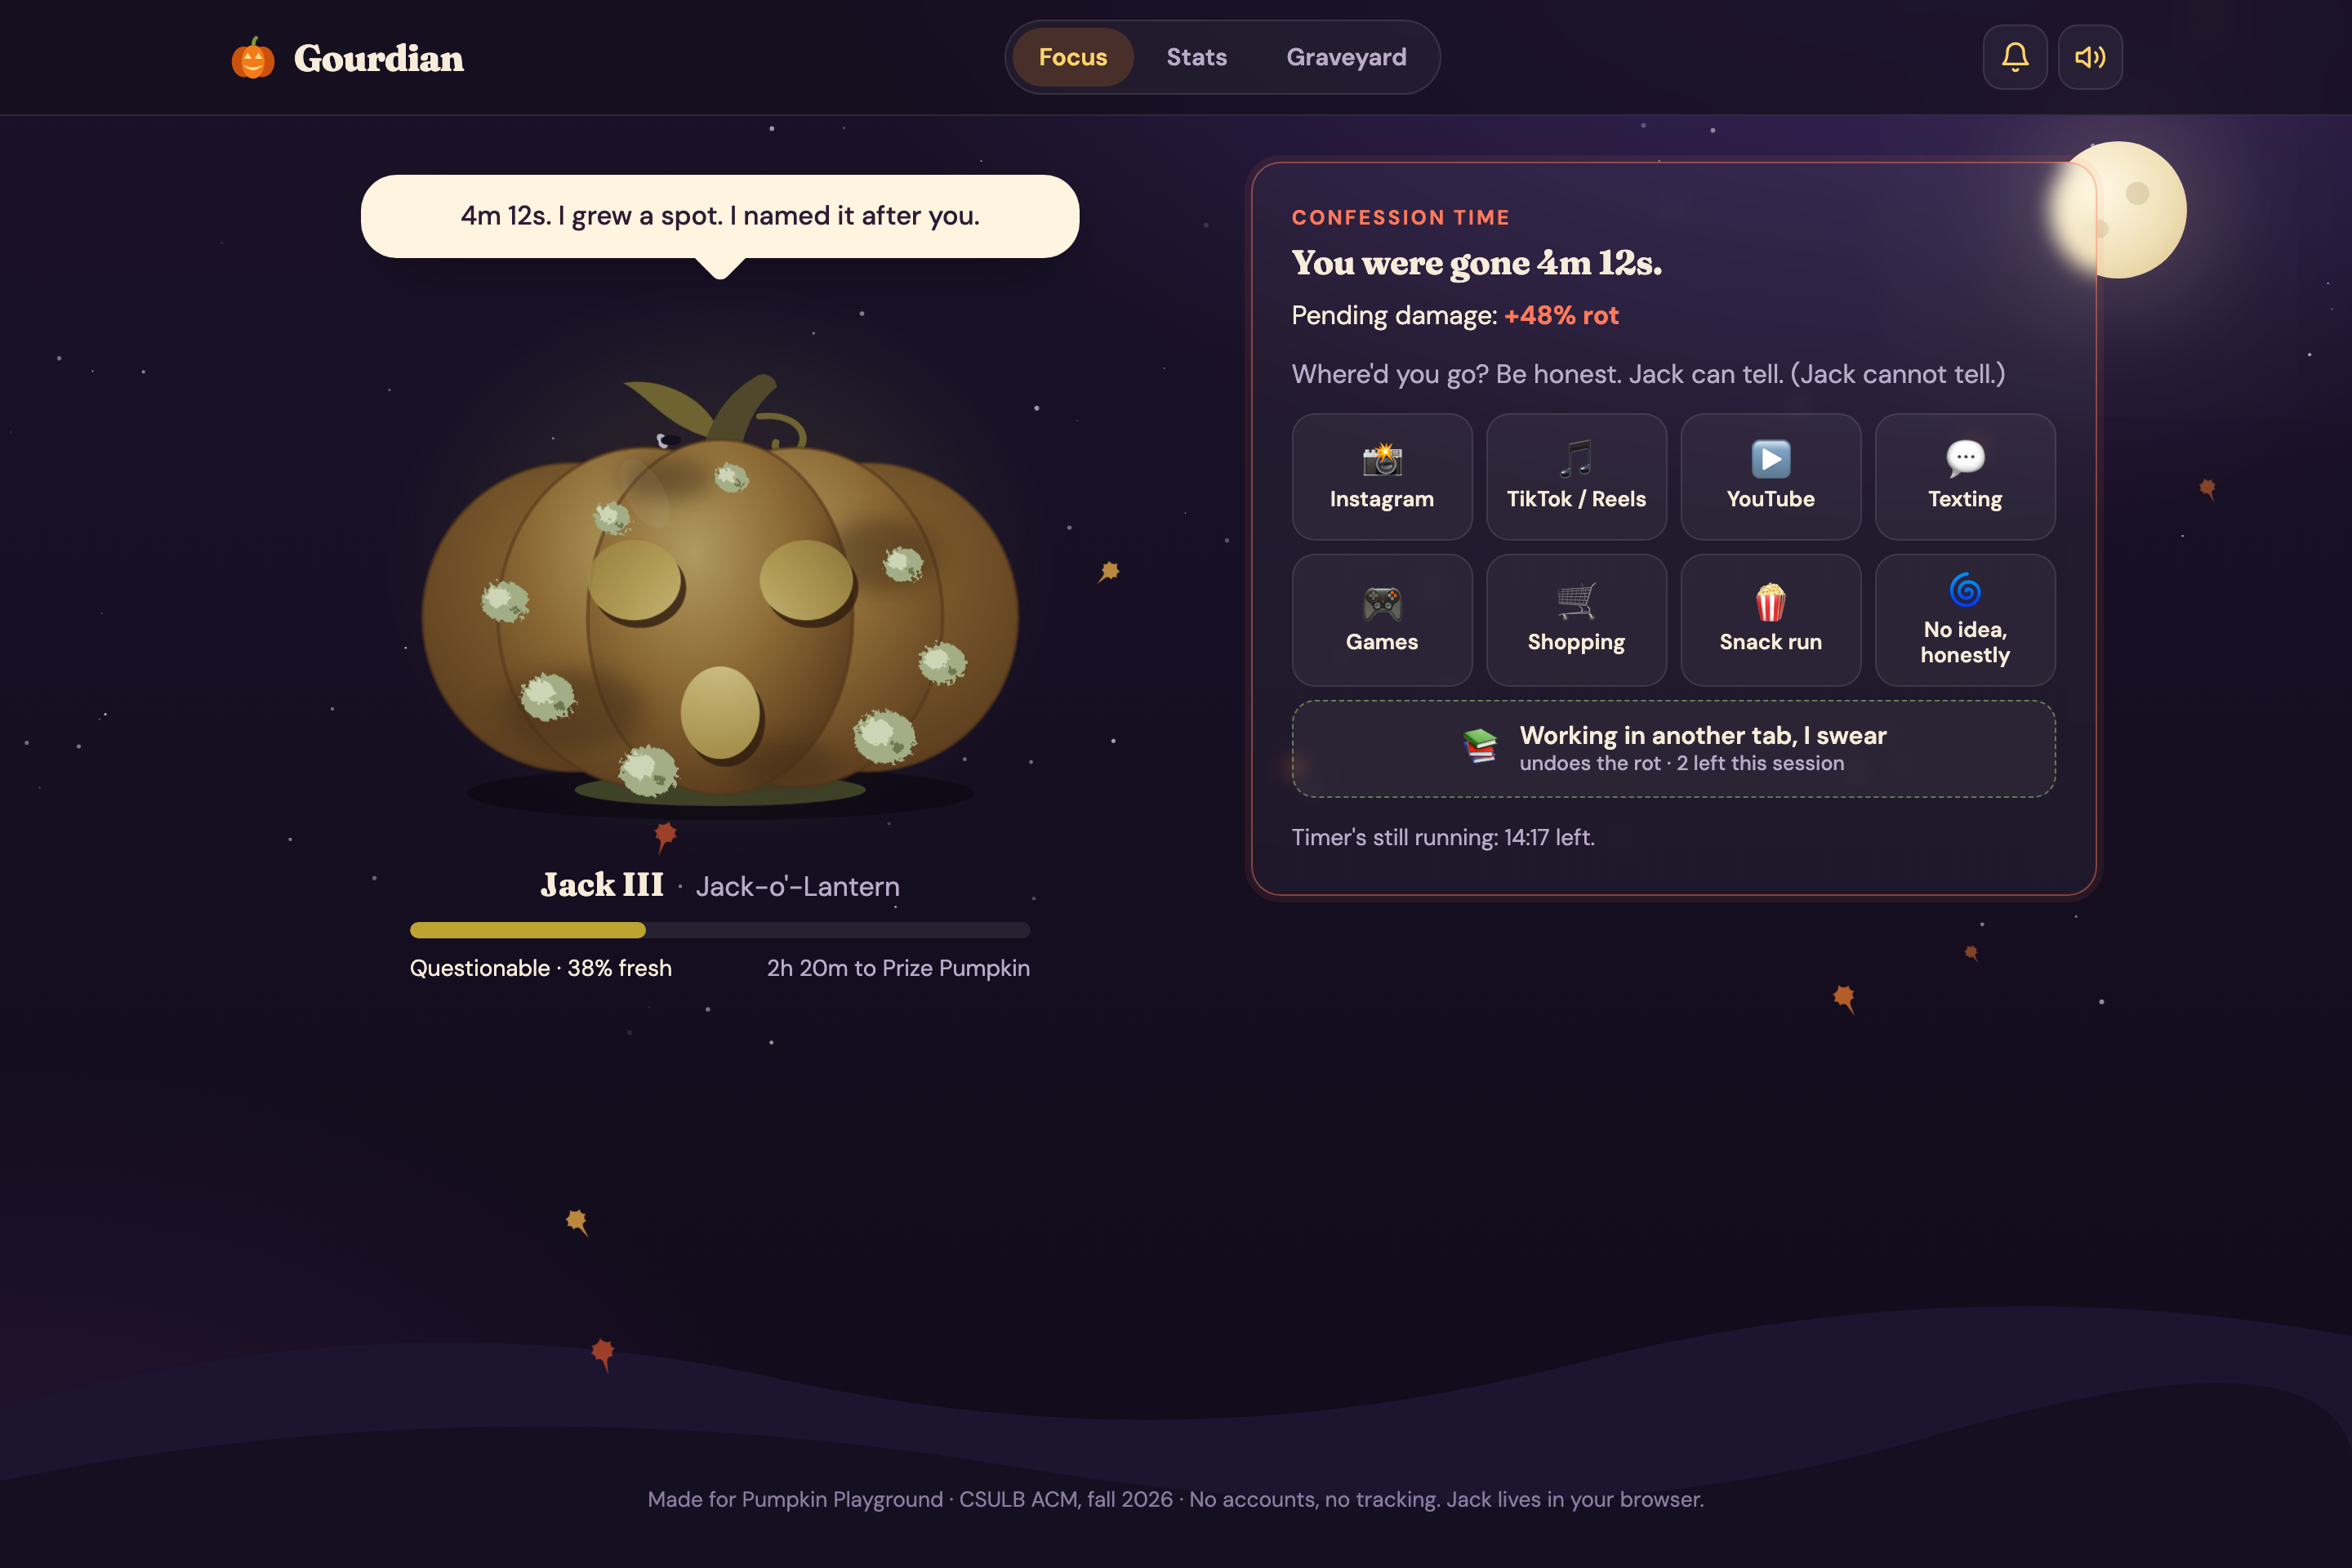
Gourdian started as a Halloween joke for Pumpkin Playground: a focus timer guarded by Jack, a pumpkin who rots while you're off in another tab and makes you confess where you went when you come back. While building it we noticed the confessions were quietly becoming a dataset. Every session was a minute-by-minute record of exactly when attention leaked, for how long, and to which app.
That raised a better question than "how do we guilt people into focusing?": can the pumpkin learn? Procrastination is close to universal in college (80–95% of students, per Steel's 2007 meta-analysis), yet focus apps hand everyone the same 25-minute Pomodoro with no evidence that 25 is right for you. We wanted a timer that measures your own pattern honestly, predicts when you're about to slip, and tests its own interventions, without sending a single data point to a server.
What it does
- A session length fitted to you. A survival curve of "minutes until the first slip" picks the longest session that keeps about 70% of your sessions slip-free, and the timer offers it as a "for you" option.
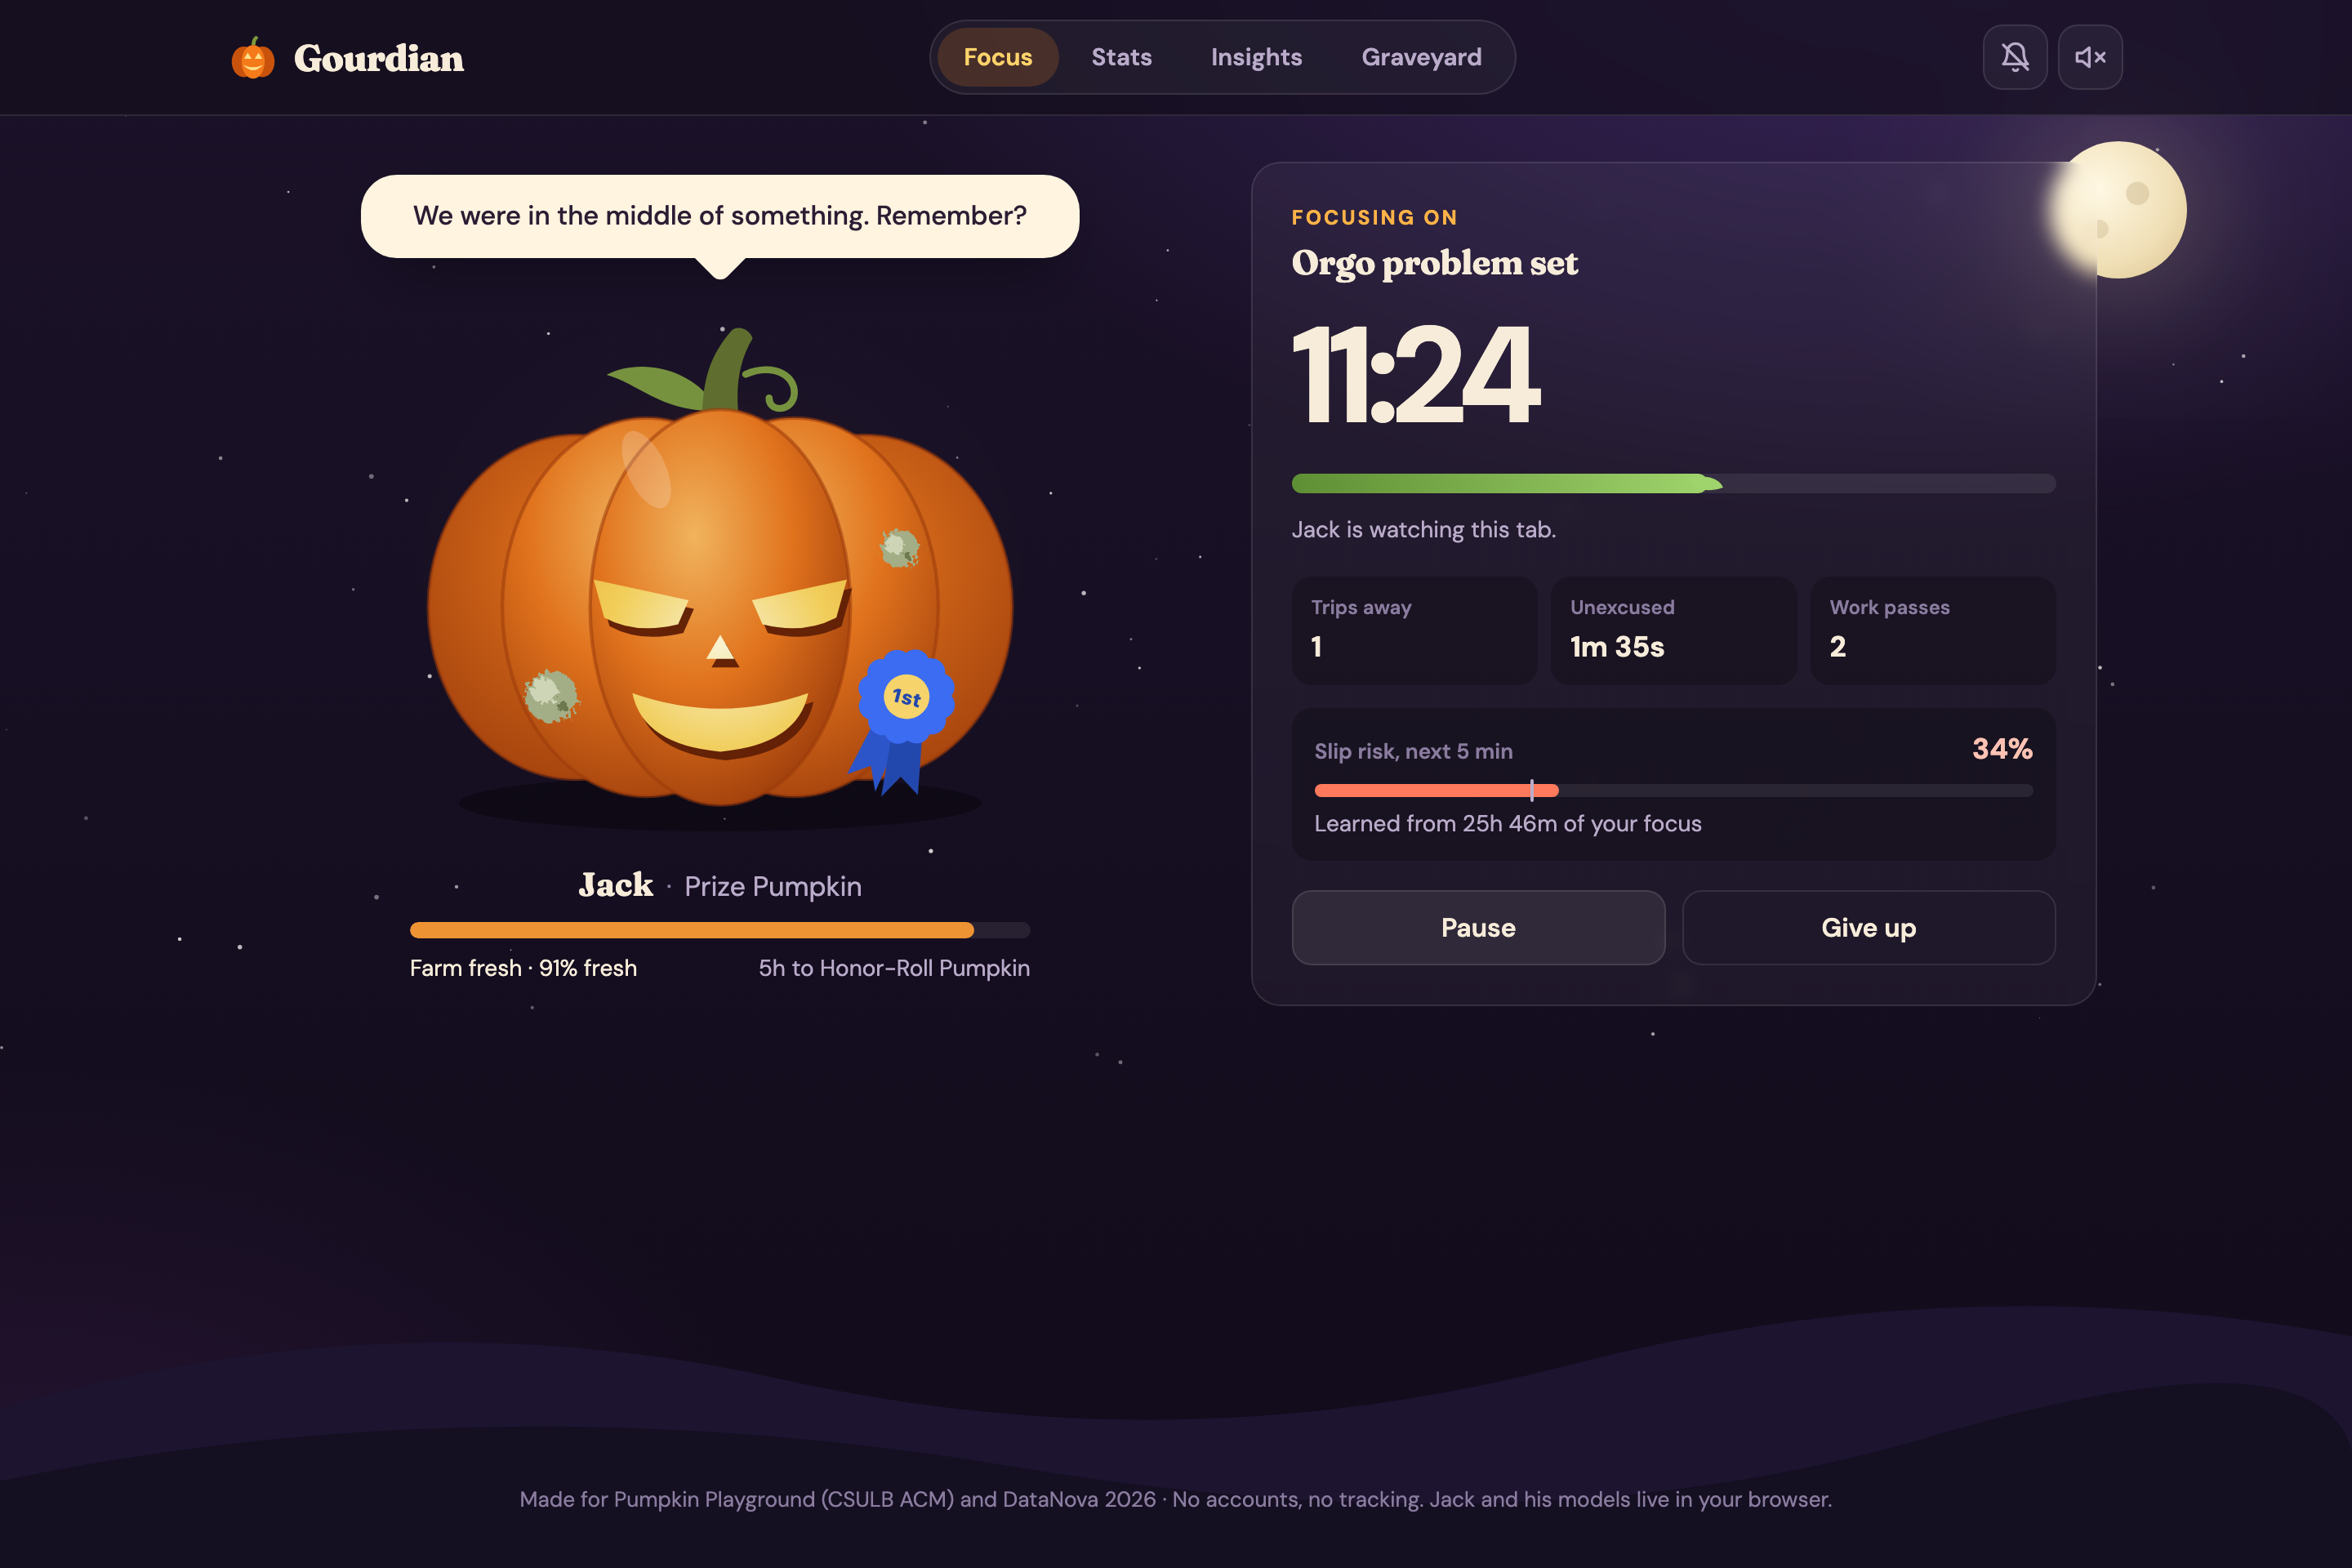
- A live slip-risk meter. Every minute you work, a model trained in your browser estimates the chance you'll leave in the next 5 minutes.
- Warnings that measure themselves. At high-risk moments Jack warns you, but only half the time, at random. Comparing warned and unwarned moments estimates whether the warnings actually work for you.
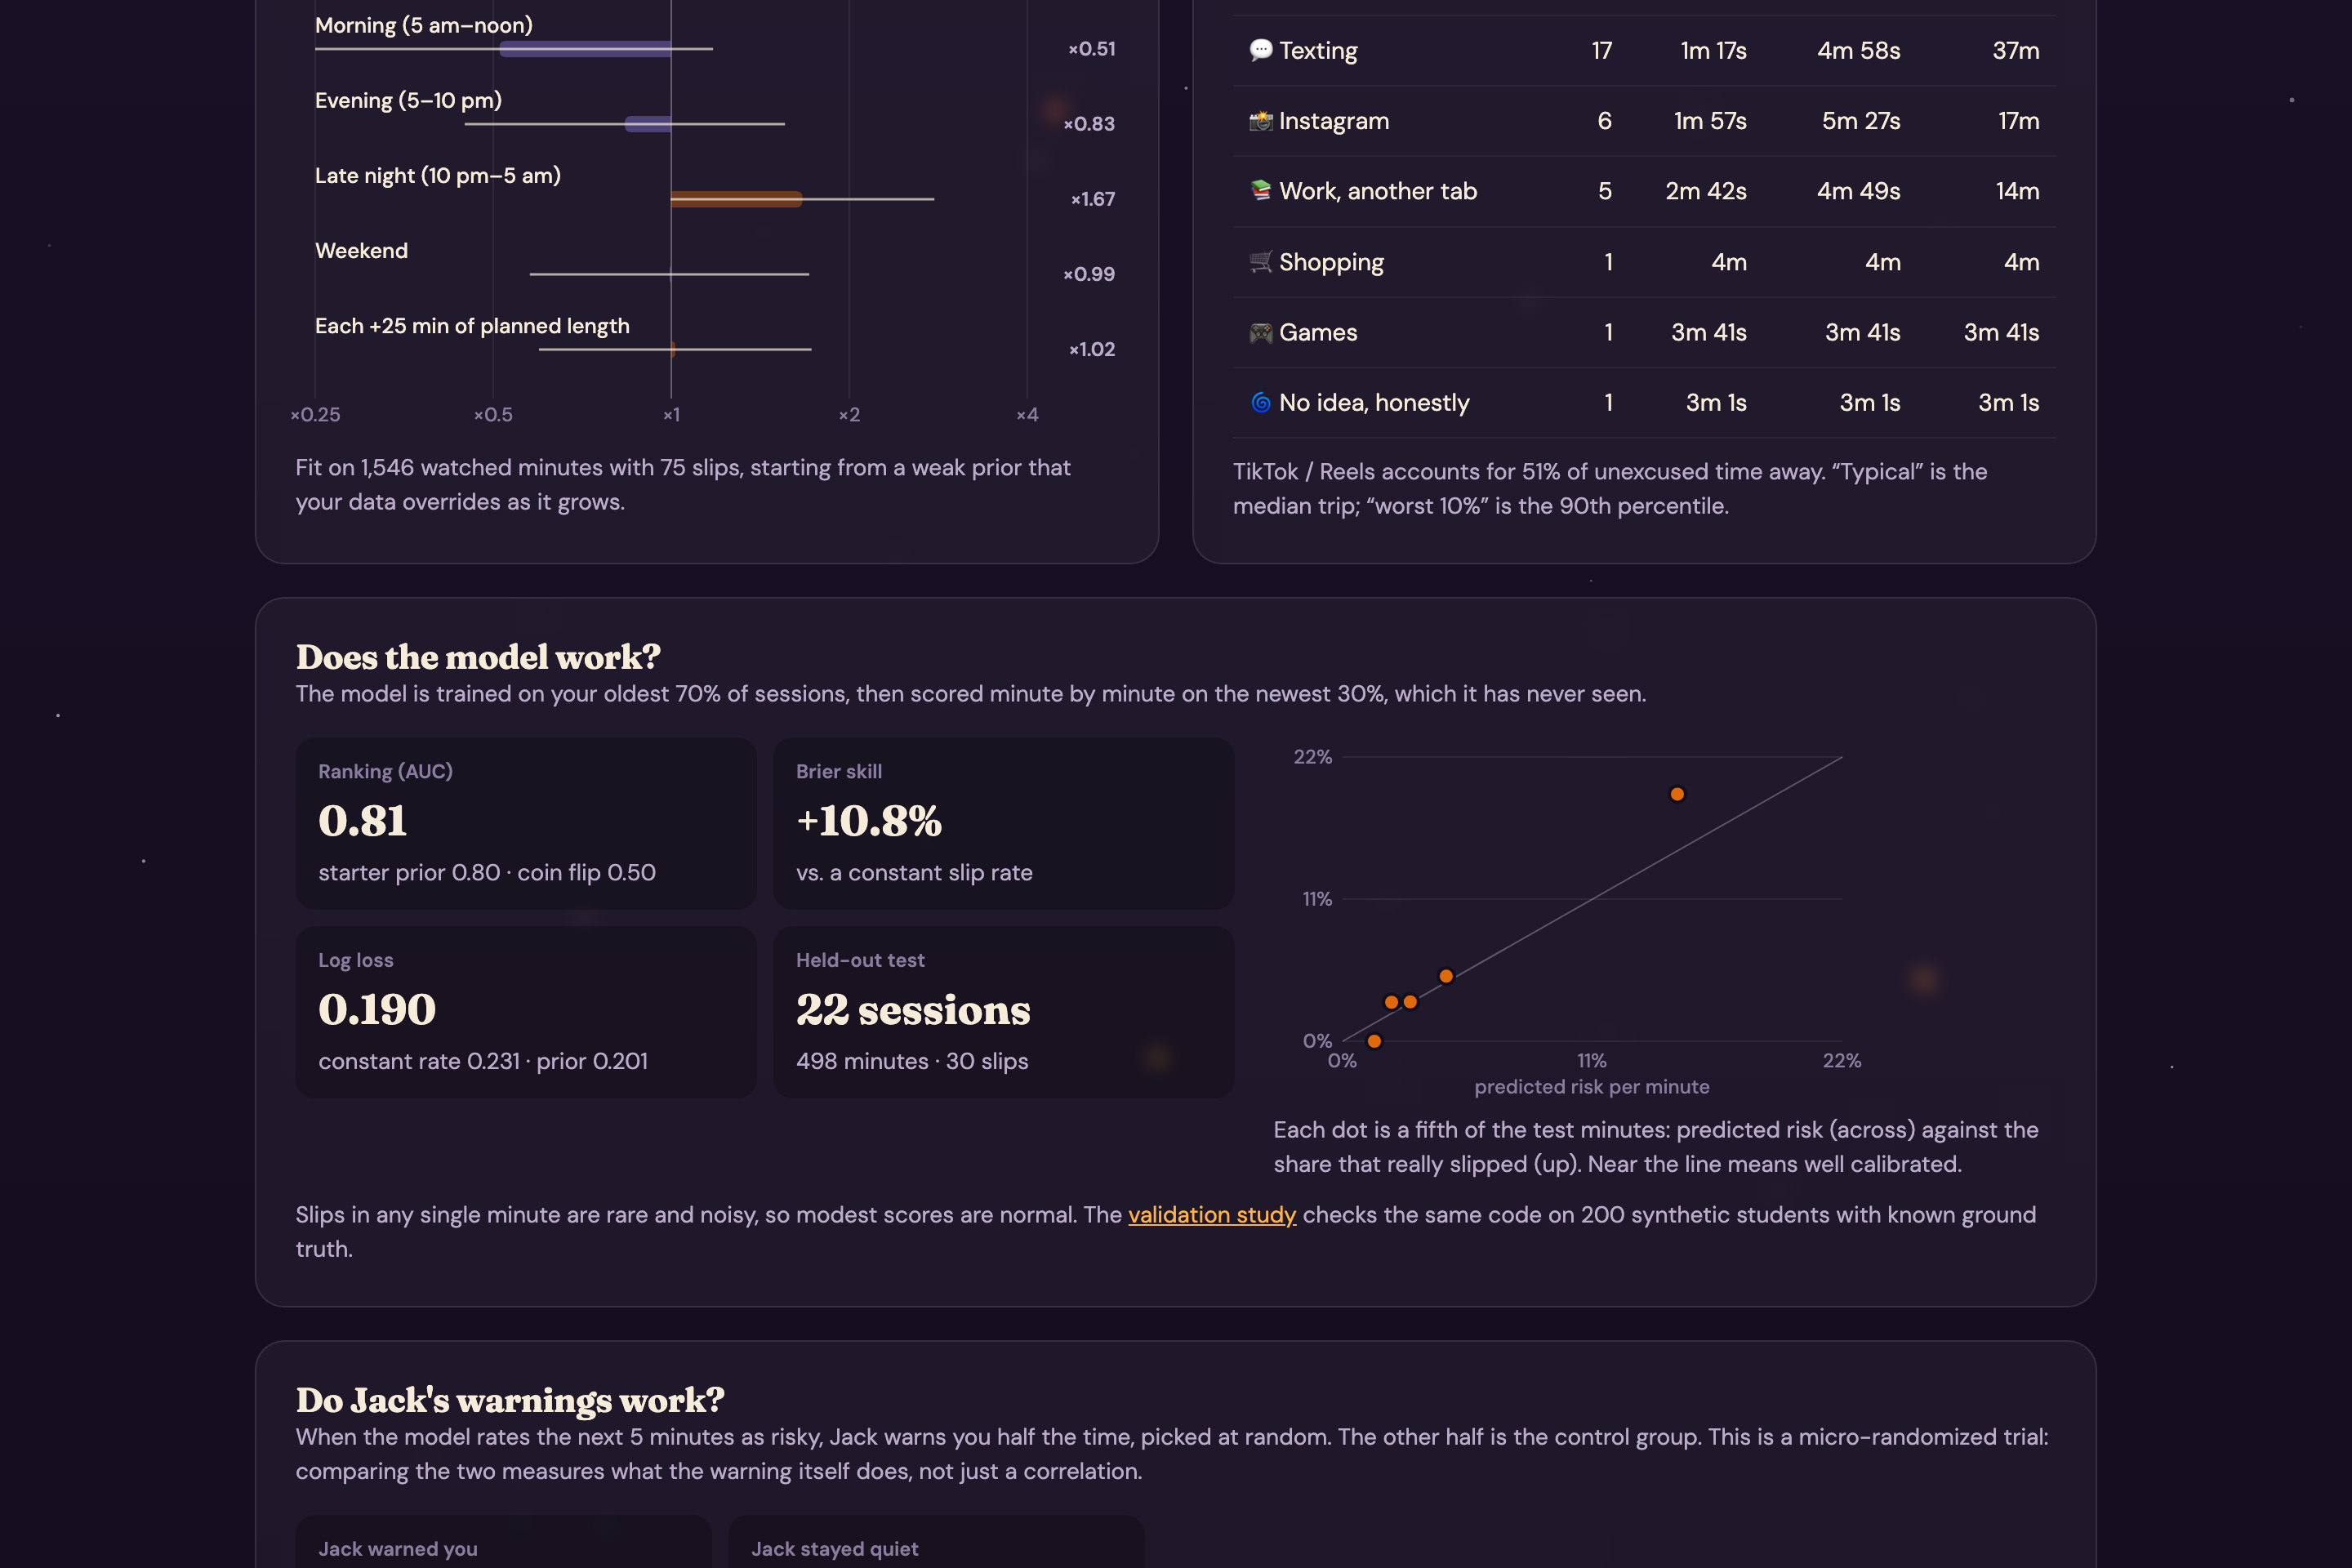
- An Insights page with your survival curve, slip rates by hour, risk factors with intervals, the cost of each distraction, an honest held-out model check, and CSV/JSON export. A synthetic sample student is preloaded so you can see six weeks of results right away.
How we built it
Gourdian is a static site in vanilla JavaScript: no framework, no dependencies, no build step. The Page Visibility API notices when you leave, and a Web Worker keeps time in background tabs. Every trip of 10 s or more triggers a confession; work in another tab is logged but never counted as a slip. All of the statistics are written from scratch in about 400 lines (js/insights.js), so the same file runs in the browser and in Node tests.
1. Survival analysis. Each session gives a time to its first slip, or a censored time if it ended clean. The Kaplan–Meier estimator handles censoring correctly:
$$\hat{S}(t) = \prod_{\text{slip times} \le t} \left( 1 - \frac{\text{slips at that minute}}{\text{sessions still slip-free}} \right)$$
with a Greenwood 95% band on the log(−log) scale.
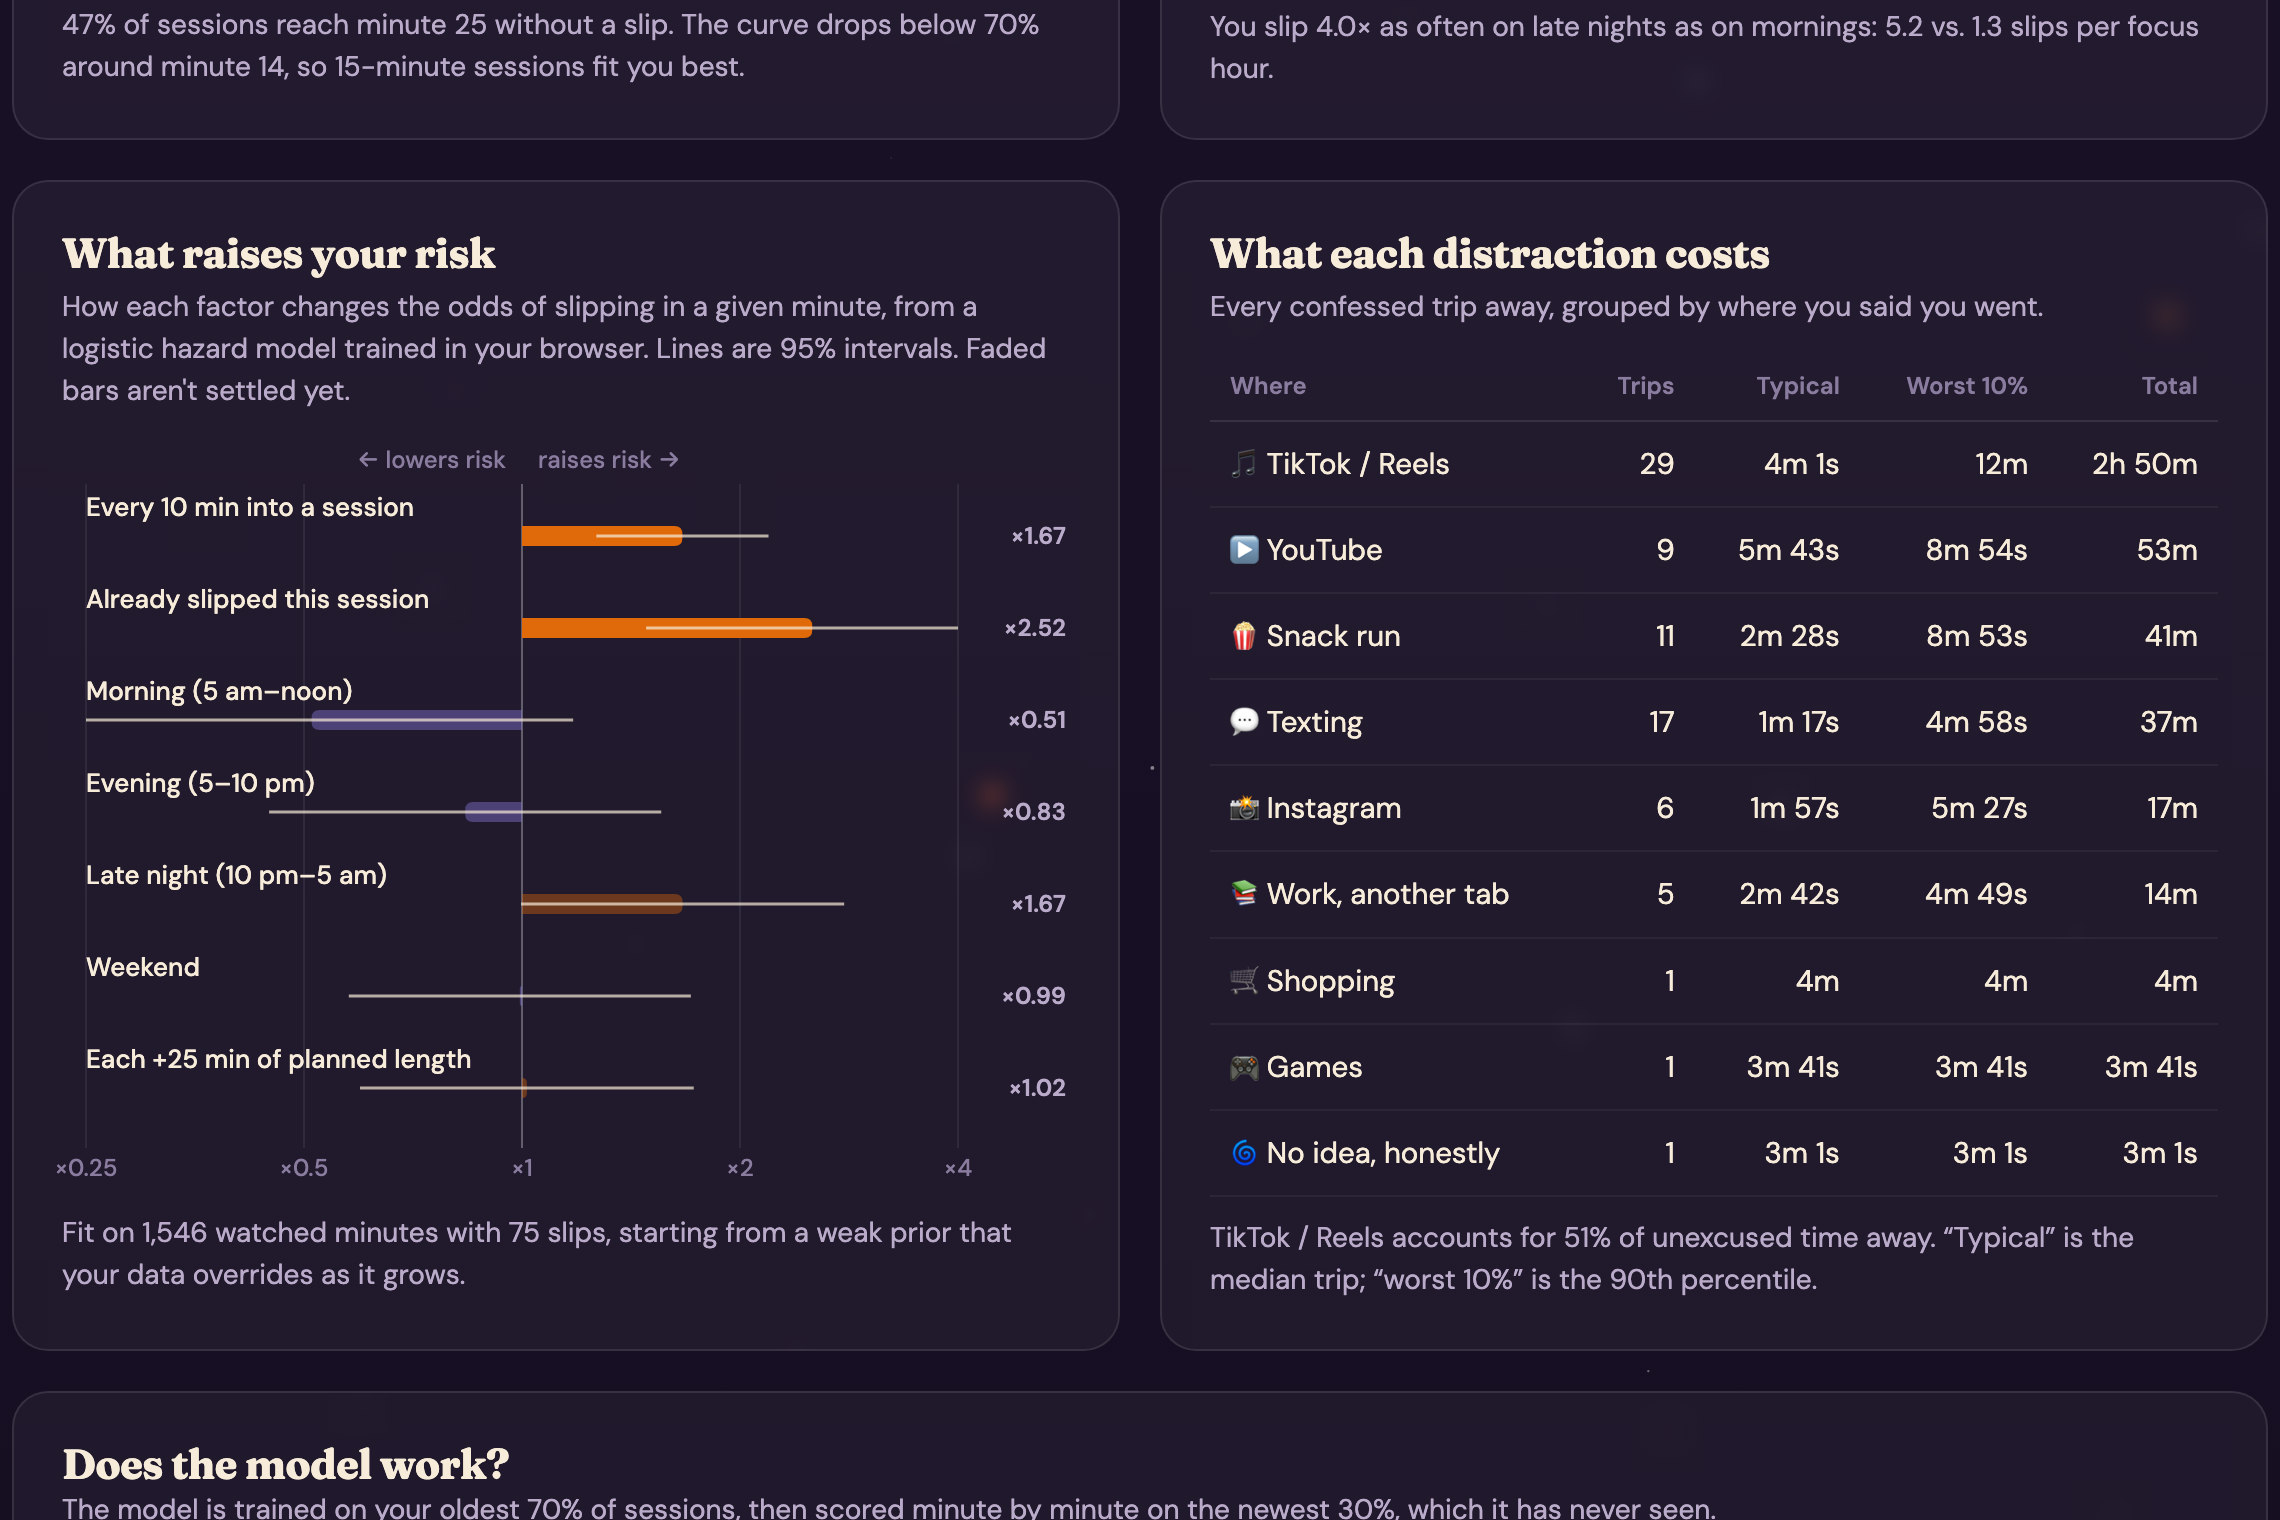
2. Discrete-time hazard model. Every watched minute is one row: did a slip start in this minute? A logistic regression uses minutes into the session, whether you already slipped, part of day, weekend, and planned length:
$$\operatorname{logit} h(m) = \beta^{\top} x(m)$$
It's fit by MAP with a weak Gaussian prior, using Newton's method with a backtracking line search, so a brand-new user gets sensible predictions from session one and their own data takes over as it accumulates. The meter compounds the per-minute hazard:
$$P(\text{slip in the next 5 min}) = 1 - \prod_{k=0}^{4} \bigl( 1 - h(m+k) \bigr)$$
3. Empirical-Bayes hourly rates. An hour with ten minutes of data is mostly noise, so each hour's rate is shrunk toward your overall rate \( \bar{\lambda} \) with a Gamma–Poisson estimator:
$$\tilde{\lambda}(h) = \frac{y(h) + \tau \bar{\lambda}}{E(h) + \tau}$$
where \( y(h) \) counts slips, \( E(h) \) is focus hours, and \( \tau \) is one hour of prior exposure.
4. Micro-randomized trial. When predicted risk reaches 30%, the app flips a coin (warn or stay quiet), then waits 8 minutes before deciding again. Because the choice is random, the difference in slip rates over the next 5 minutes estimates the causal effect of a warning for that one student.
5. Validation where the truth is known. We don't collect anyone's data, so to test the methods we wrote a simulator that generates students minute by minute from known coefficients. It powers the sample student and a validation study (npm run validate) of 400 simulated students, 200 where the starter prior is roughly right and 200 where it's deliberately wrong. The study fits the app's own code on each student's oldest 70% of sessions and scores the newest 30%. Highlights, all on synthetic students:
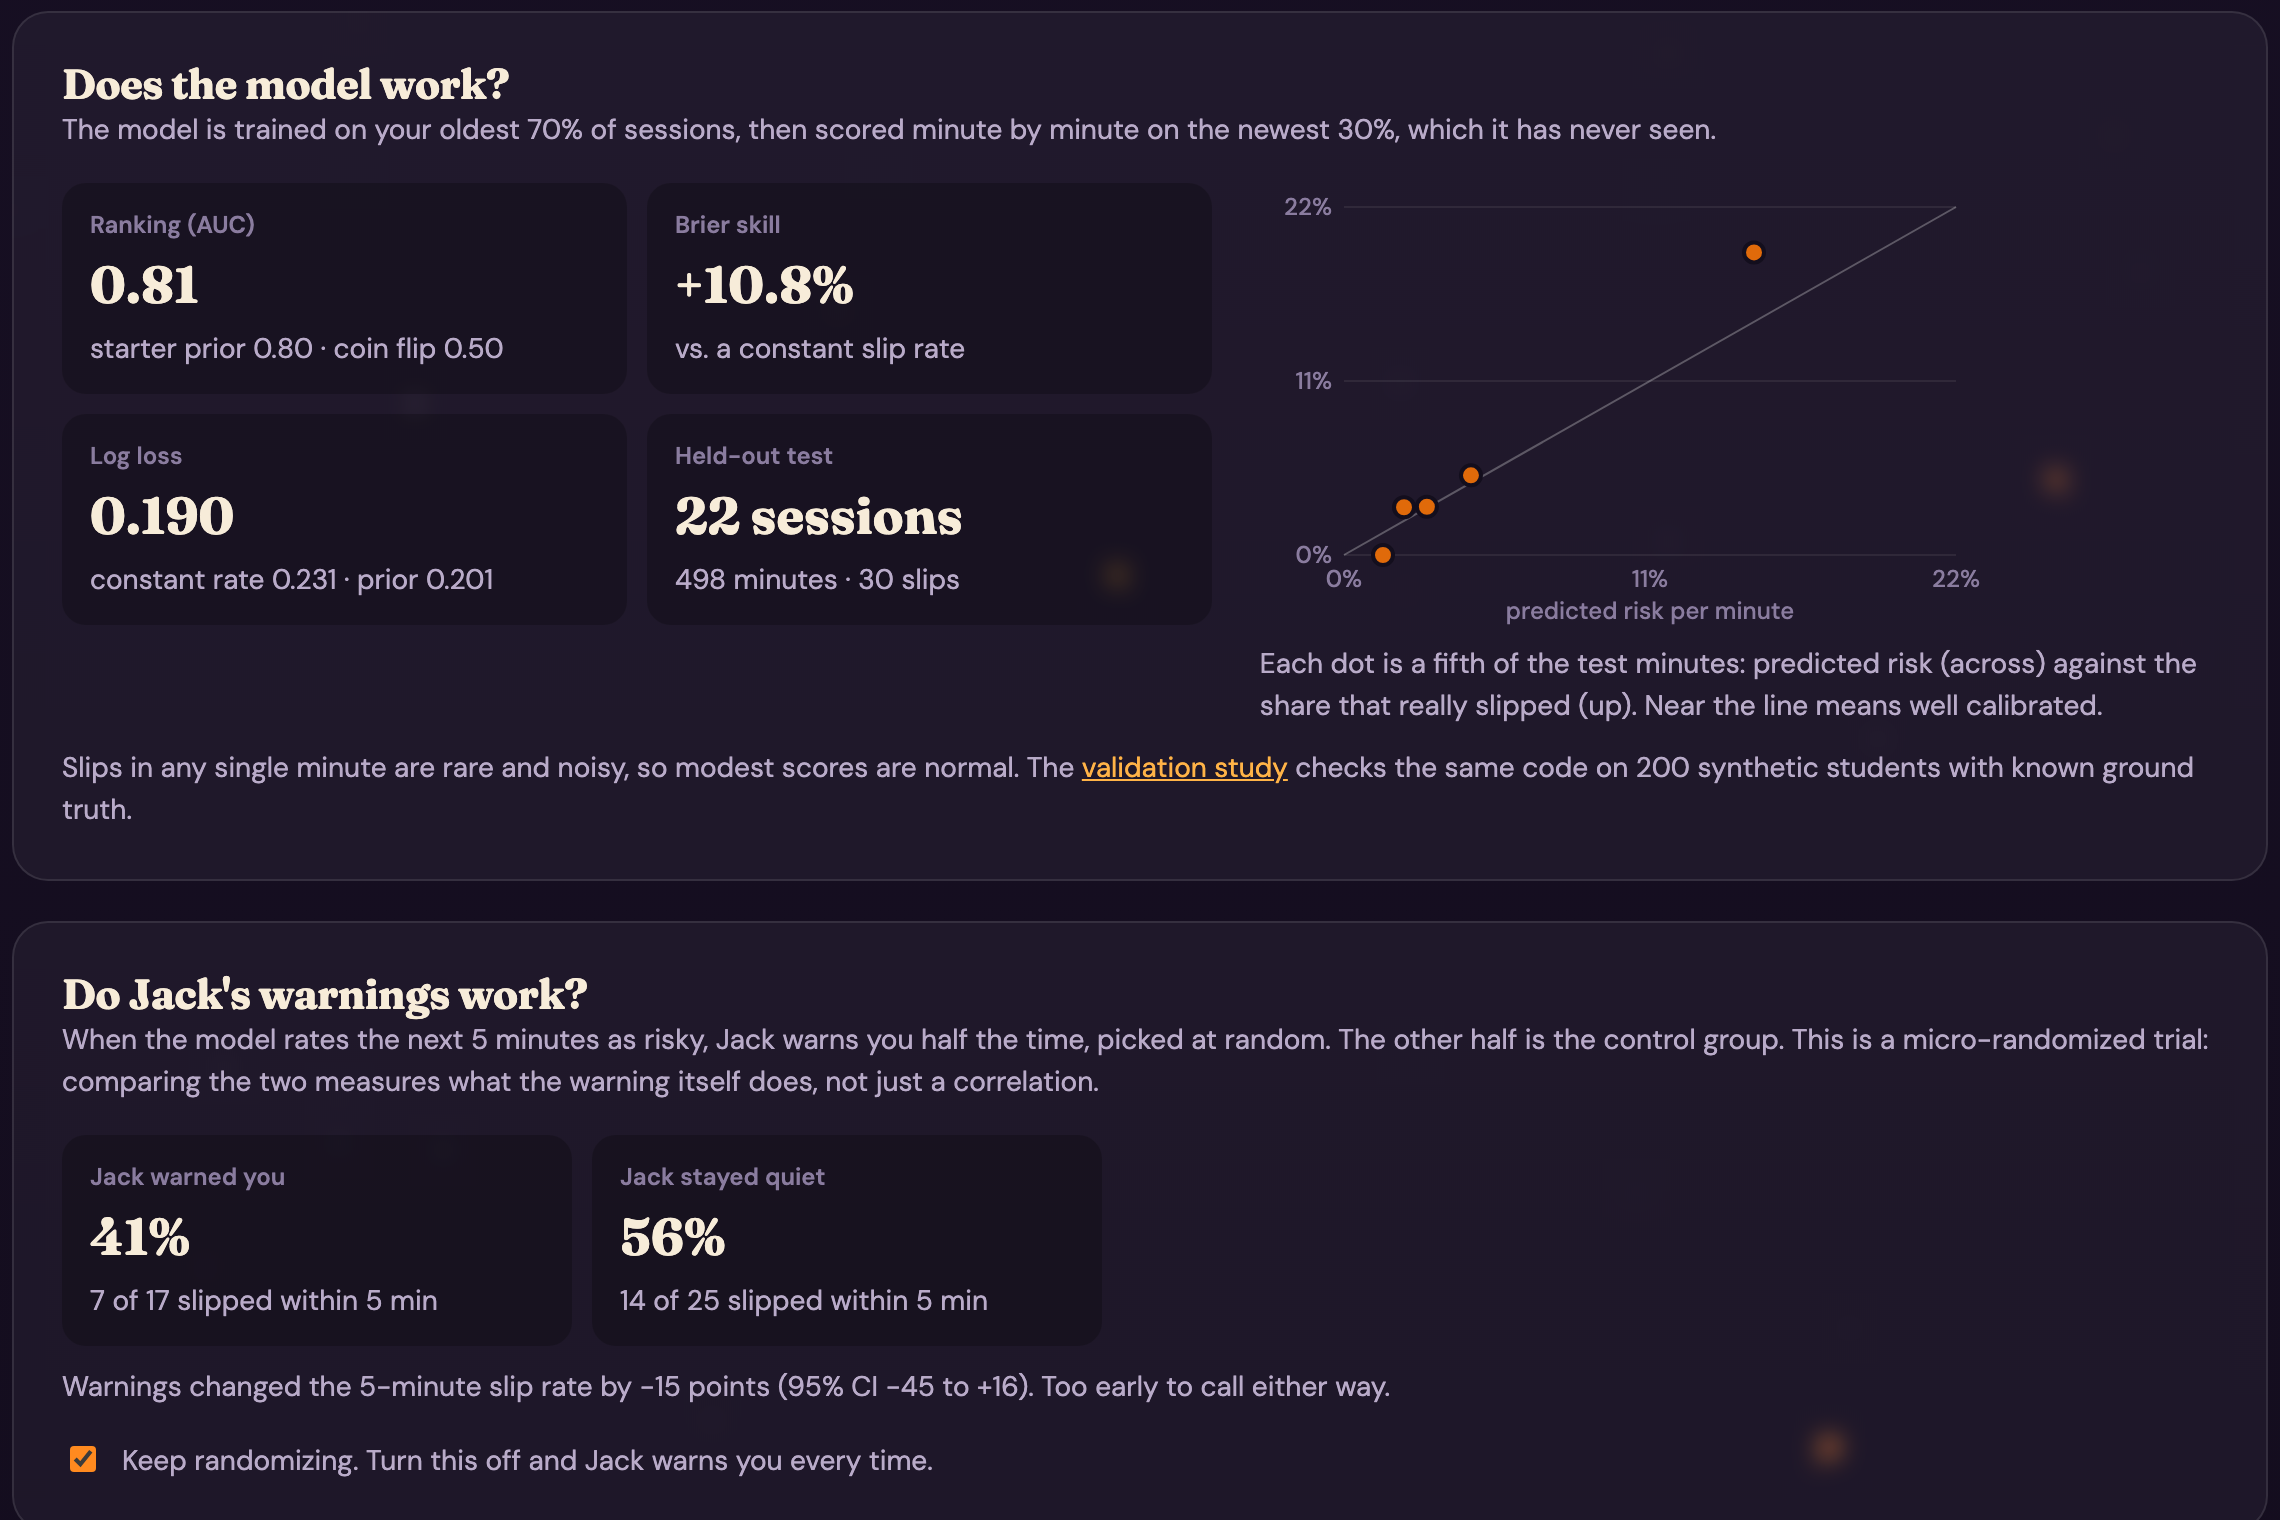
- When the starter prior is wrong, held-out AUC is 0.675 for the personal model vs. 0.596 for the prior alone (0.696 with the true coefficients), and the personal model wins for 91% of students. It keeps improving with history: 0.59 with no sessions, 0.69 after 80.
- Calibration: the riskiest fifth of minutes is predicted at 12.1% and observed at 11.3%.
- Kaplan–Meier 95% bands contain the true curve 95–98% of the time, and empirical Bayes cuts hourly-rate error by 88%.
- The warning trial recovers a real effect (−7.0 points, 95% CI −9.3 to −4.6) and finds nothing in an A/A check (+0.2 points, CI −2.1 to 2.6).
Eleven unit tests, including the textbook 6-MP leukemia Kaplan–Meier example, run in GitHub Actions before every deploy to GitHub Pages.
Challenges we ran into
- Clean sessions aren't failures. A naive "average time to first slip" throws away every session you finished without slipping and makes you look worse than you are. Treating them as censored observations fixed it, and it's why survival analysis is the right tool.
- Cold start. A new user has zero data. A hand-set prior gives reasonable predictions on day one, but a wrong prior could stick, so we built a validation scenario where the prior is deliberately wrong and checked that the model unlearns it.
- Newton's method diverged. One simulated heavy procrastinator sent the coefficient estimates off to absurd values. A backtracking line search on the log posterior fixed it, and interval coverage came back to 91–99%.
- Thin data tells lies. One bad night can make 11 pm look catastrophic. We shrink thin hours, fade bars with under an hour of data, and hide medians and intervals until there are enough sessions to support them.
- Proving it works without users. Privacy by design means there's no data to validate on. The simulator solves that, but it shares the model's functional form, so it shows the estimators are correct, not that real people behave this way. We say so in the app and in the deck.
- One site, two hackathons. The live site is also our Pumpkin Playground entry, so every change had to be additive, and the sample student had to look identical in every time zone and across daylight-saving changes.
What we learned
- Survival analysis, discrete-time hazards and micro-randomized trials come from medicine and mobile health, and they fit a focus timer surprisingly well.
- For a rare, noisy, minute-level behavior, an AUC around 0.65–0.70 is close to the ceiling. Calibration and honest intervals matter more than a flashy accuracy number.
- A prior is a product decision: it decides what a new user sees on day one.
- Simulation with known ground truth is a powerful way to test estimators, as long as you're upfront about what it can't show.
What's next
A consented pilot with real students to replace the hand-set prior with an empirical one; a repeated-measures analysis of the warning trial pooled across consenting users; contextual-bandit warnings that adapt their timing and wording; and a browser extension that pre-fills the confession.
Built With
- bayesian-statistics
- canvas
- css3
- data-visualization
- empirical-bayes
- github
- github-actions
- html5
- javascript
- kaplan-meier
- localstorage
- logistic-regression
- machine-learning
- micro-randomized-trial
- monte-carlo-simulation
- node.js
- page-visibility-api
- statistics
- survival-analysis
- svg
- web-audio-api
- web-workers

Log in or sign up for Devpost to join the conversation.