-

GGG Logo
-

Home Page
-

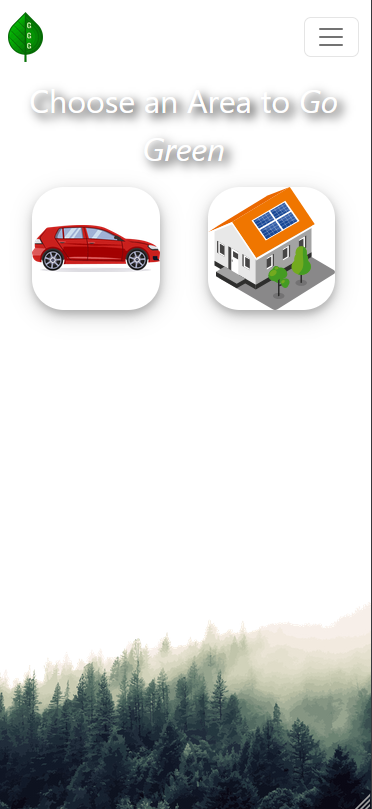
Mobile Home Page


Inspiration
We believe that everyone deserves to know how they are transforming the world we live in. In this current state of the world, new technologies are being developed to try to mitigate the harmful effects of climate change. The future of our planet and our people is in our hands and we strive to encourage effective ways to keep it clean.
What Does it Do?
Our helpful tool we developed allows the user to visualize the data of their carbon footprint depending on how they change their behavior. With simple graphs that are easy to read, our program will help you make your choice towards a better future.
Challenges
We ran into the most challenges when making sure that we had all the correct equations to show the most important information to our user and how to properly implement line graphs through chart.js.
Accomplishments
We are extremely proud of the UI of our website and the use of chart.js to formulate easy-to-read graphs to show the cost of an EV, the cost of solar panels, and CO2 emissions emitted based on vehicle type over time.
What Did We Learn?
We learned how to create databases and collect information from them. We also learned more about web design and the importance of statistics.
What's Next for Gotta Go Green?
Integrate several more options, such as biking, rail transportation, public transportation, and aircraft, to reduce our CO2 emissions and costs for the future.


Log in or sign up for Devpost to join the conversation.