-

jank logo from google images
-
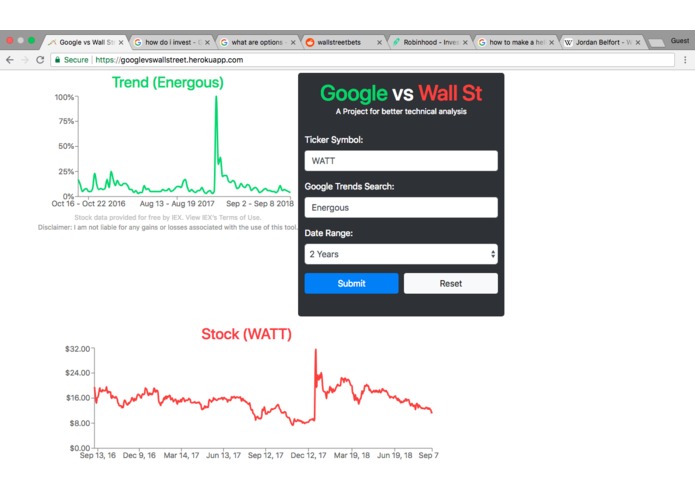
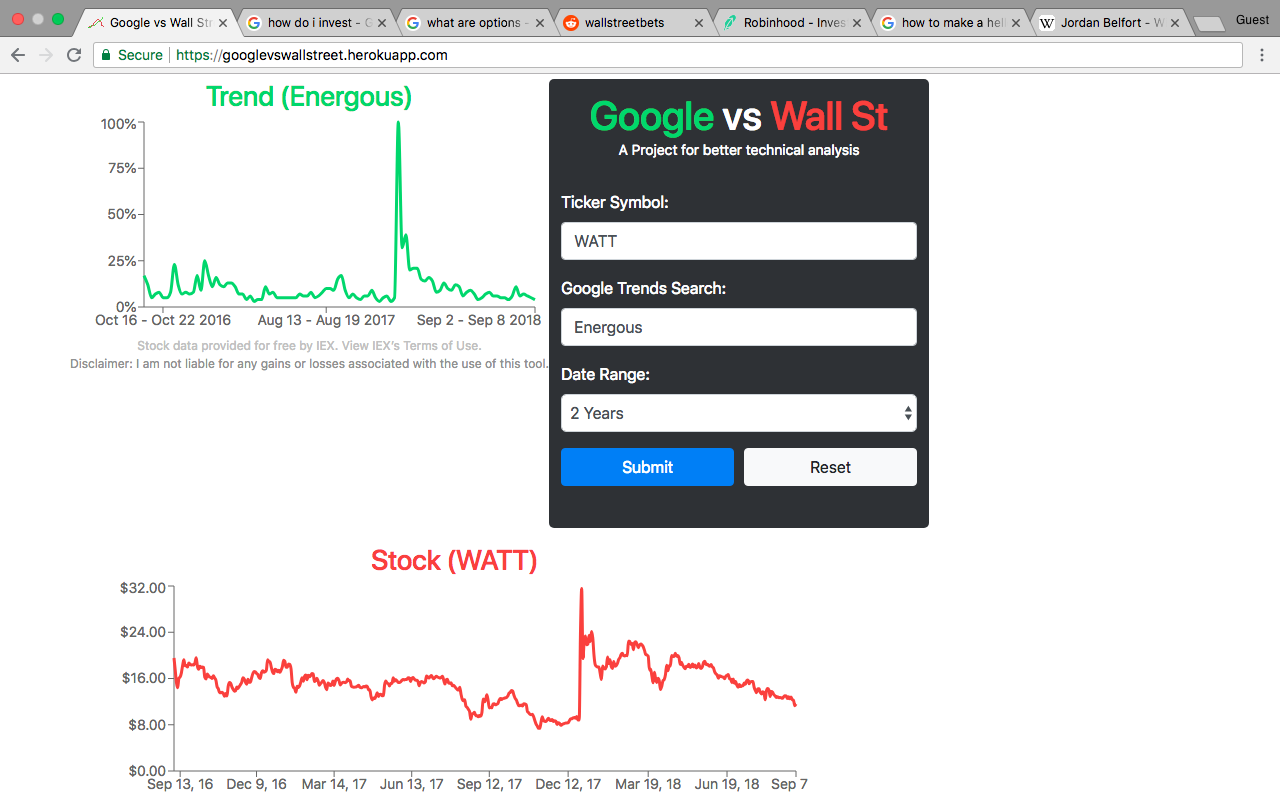
"energous" vs $WATT
-
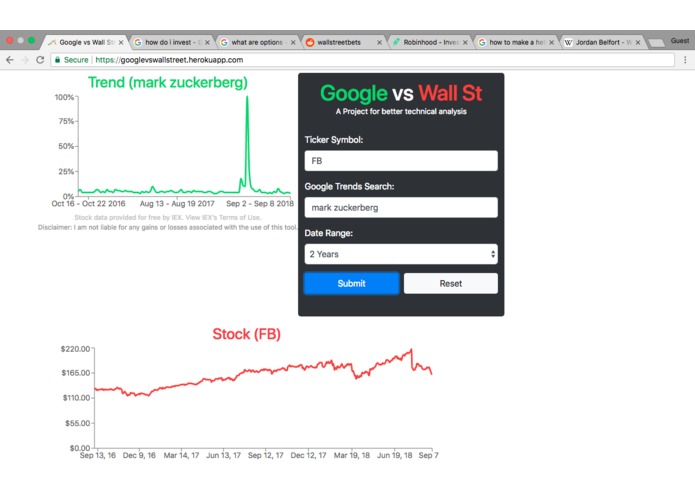
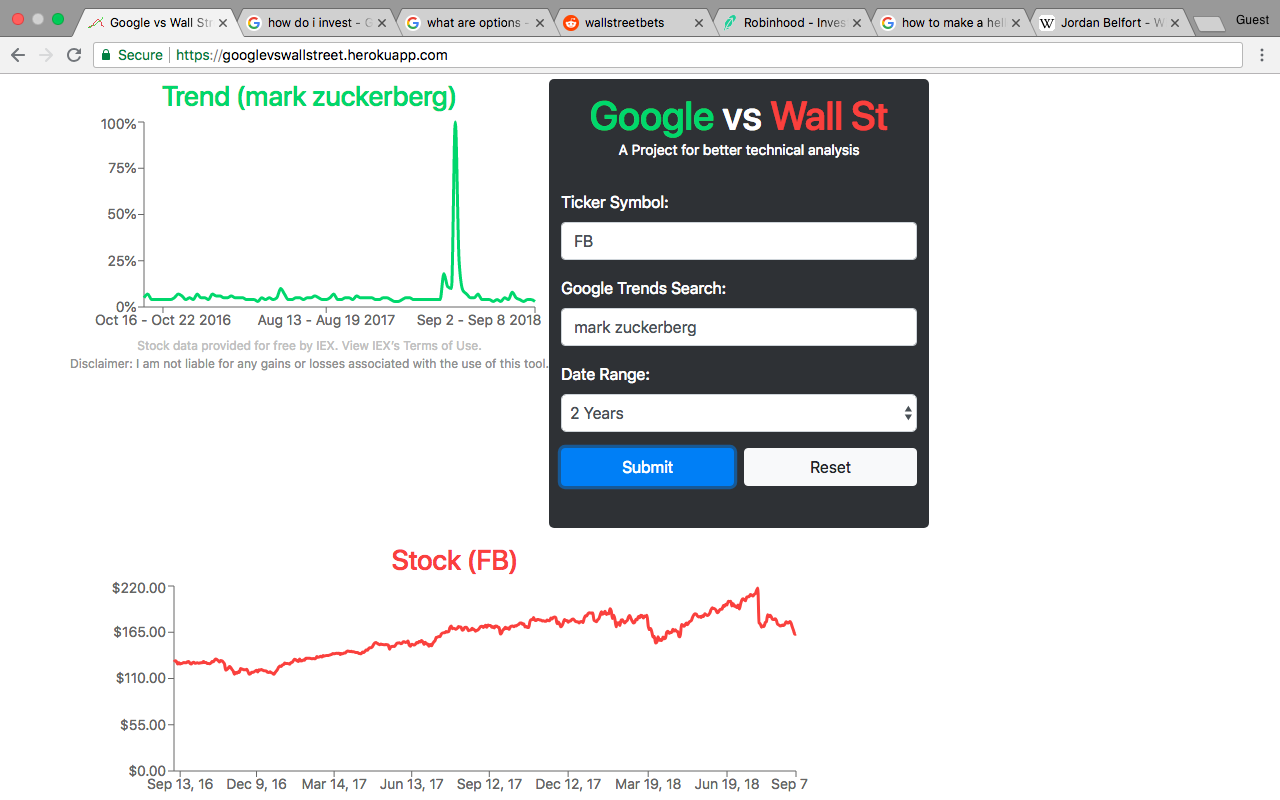
"mark zuckerberg" vs $FB
-
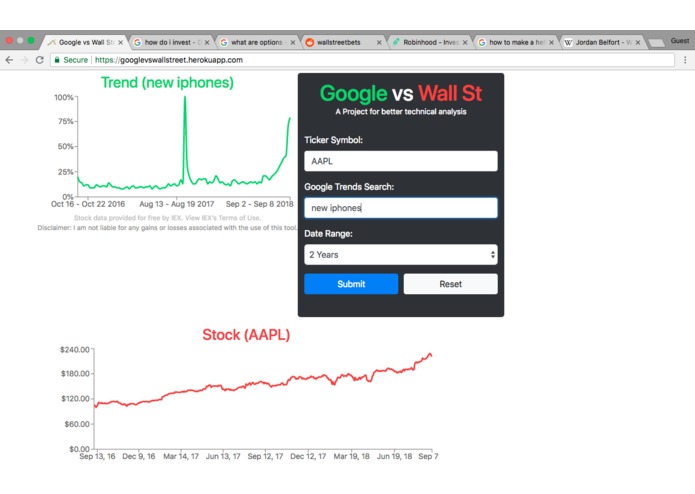
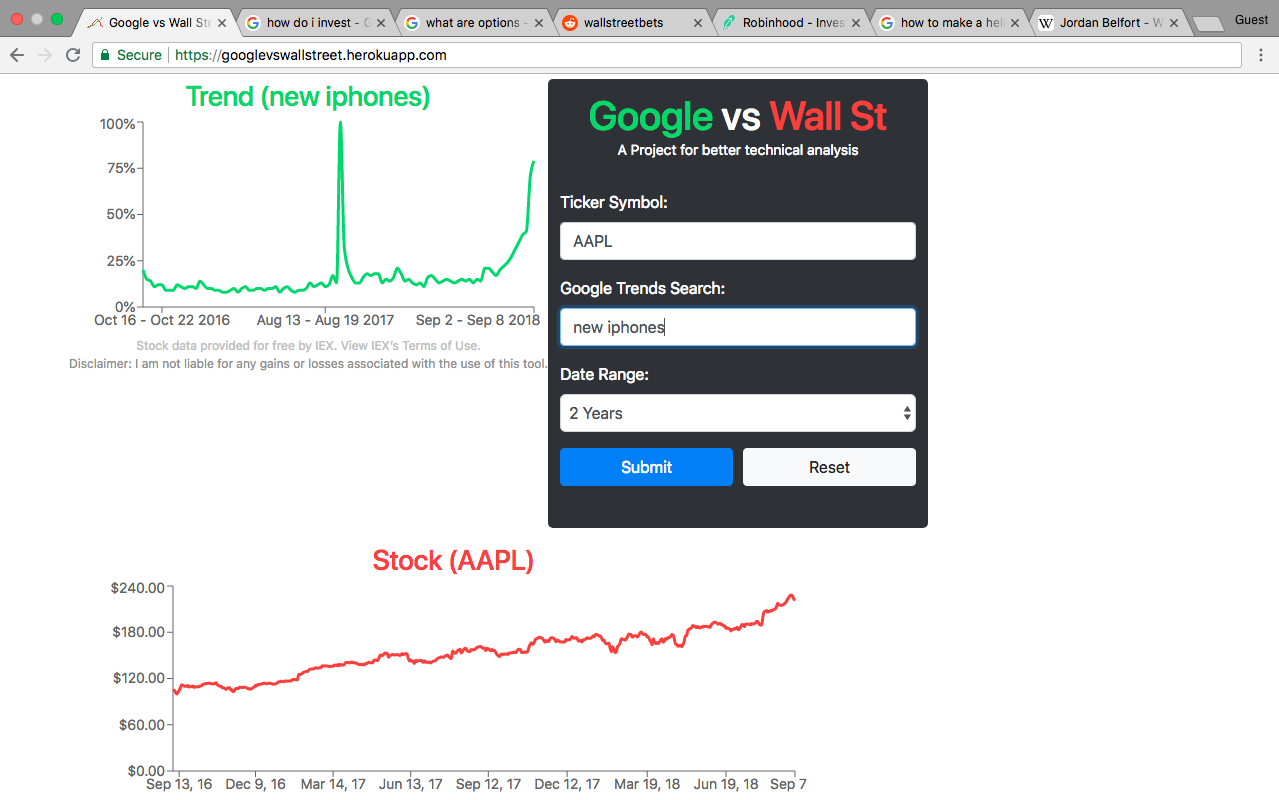
"new iphone" vs $AAPL
-
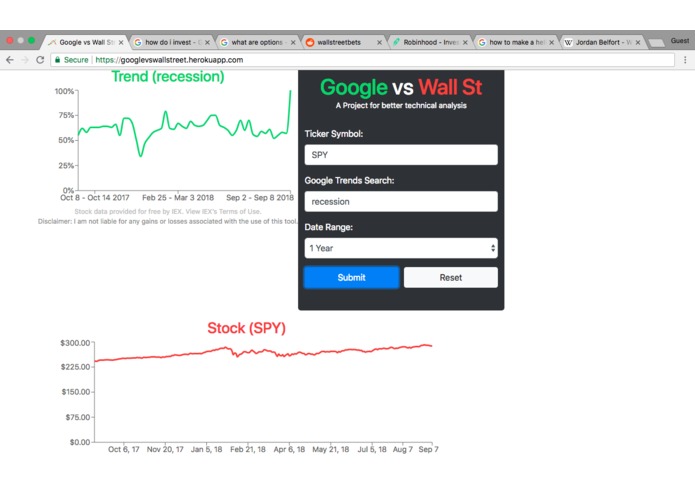
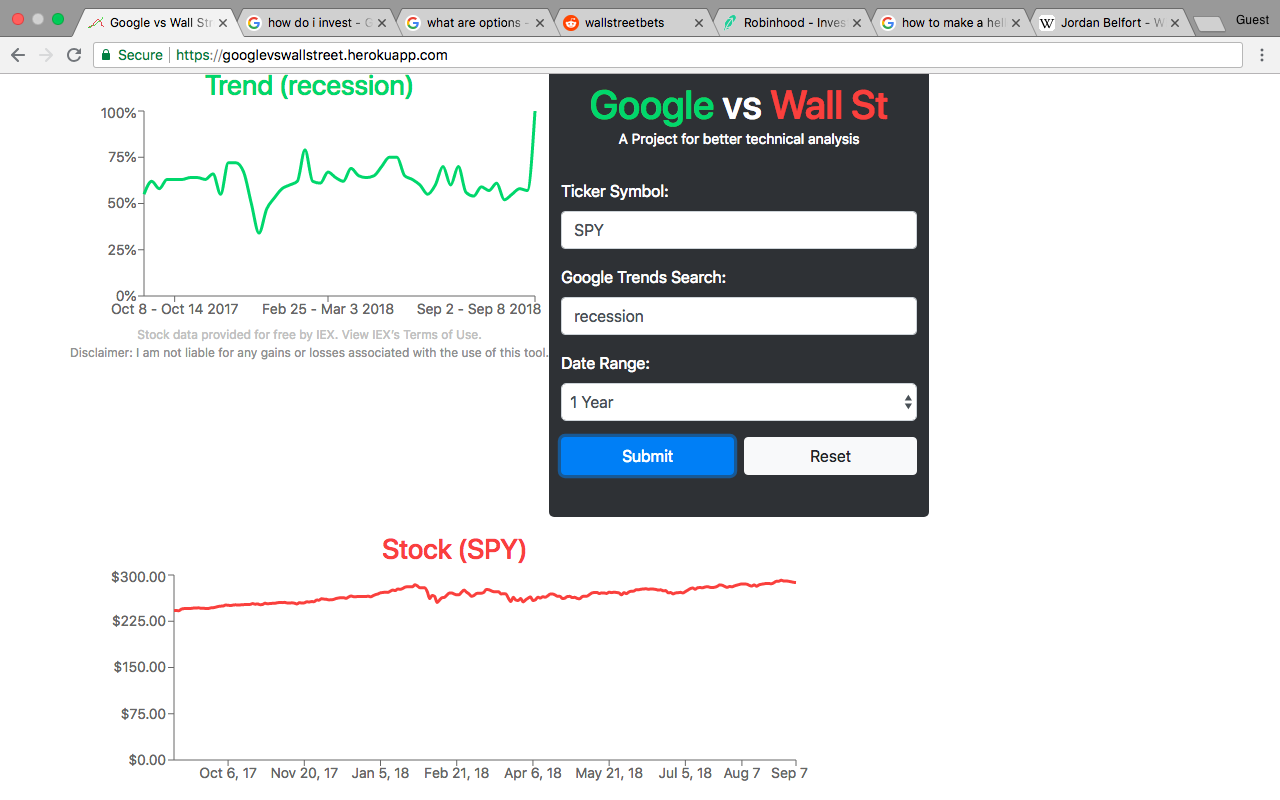
"recession" vs $SPY
-
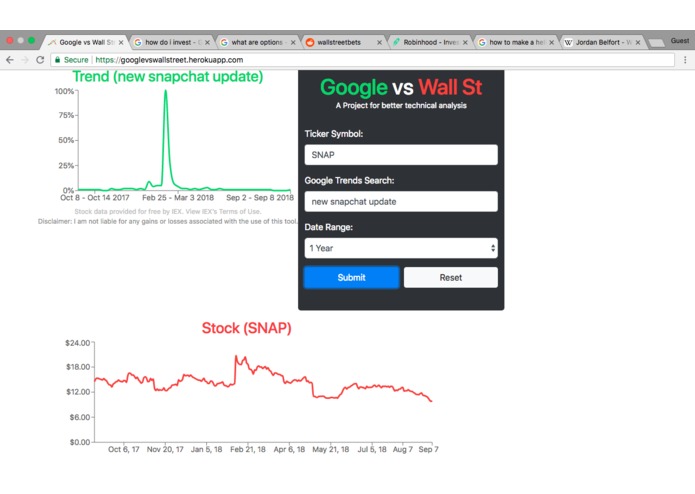
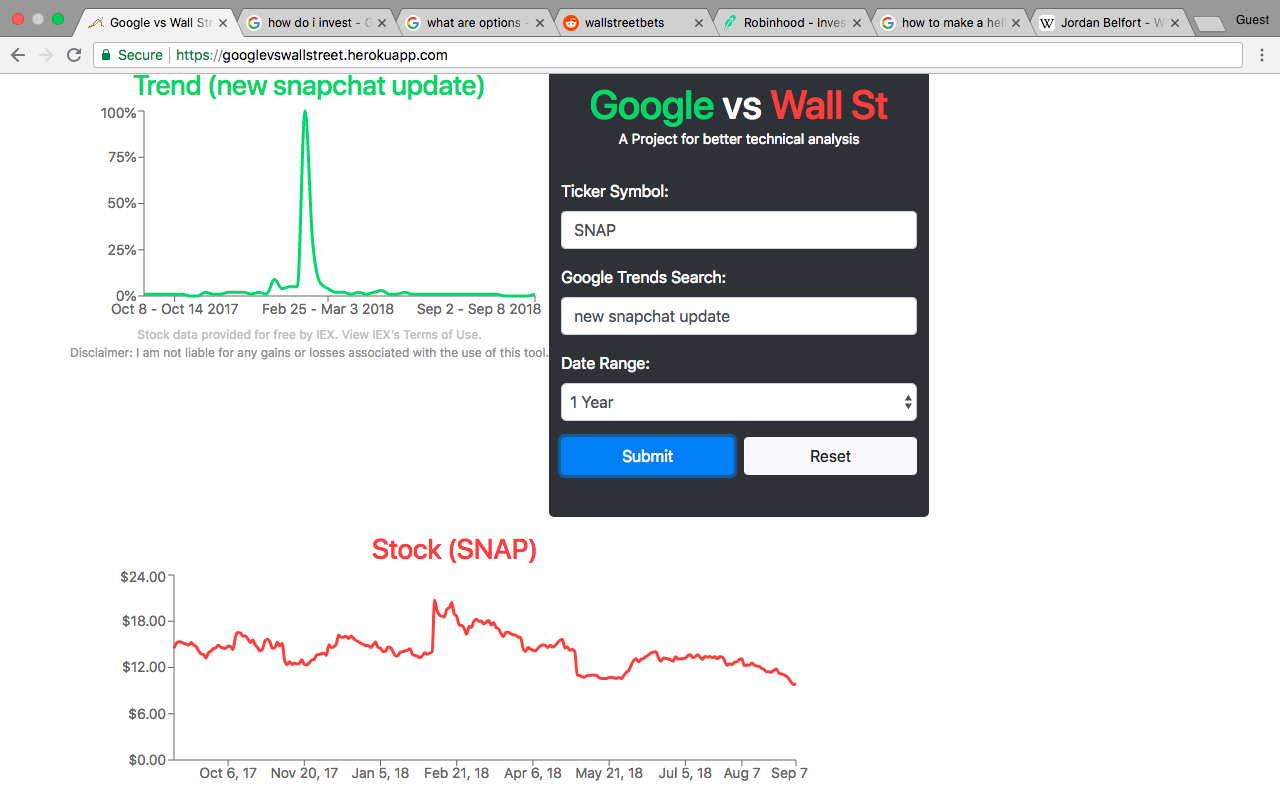
"new update" vs $SNAP

Inspiration
I started trading stocks and options about a month ago. After a few weeks of not listening to people on https://reddit.com/r/wallstreetbets say things like "don't buy $AAPL $220 puts 1 week out, you're going to lose all of your money" or, "why would you short $TSLA before the Joe Rogan Podcast, our lord and savior Elon is gunna kill it" I wanted to see if there was a way to see the direct correlation between stock prices and Google Trends.
Another reason I wanted to do this was that I also heard rumors that Kylie Jenner tanked $SNAP stock after complaining about the new UI/UX update (which is still trash, but we can talk about that later).
How it works
Pulls data from the IEX API for stock data, which is an API used by Bloomberg (to some degree) and the Google trends api via this node package, to display a correlation between Google Search trends and different stock tickers.
How I built it
React, Node, HTML, CSS, Heroku, Google Trends api via this node package
Challenges I ran into
- Front end development
- JavaScript
- The x-axis doesn't perfectly align for each graph
- Originally I wanted to display each graph on the same x and y axis
- Sometimes when you try to search for a ticker symbol that isn't on the NYSE it doesn't display. You also can't display bad investments that aren't on the US stock market like "BTC" or "ETH", or other scams.
- Trends API is really deprecated and throttling (looking at you, Google)
Accomplishments that I'm proud of
Having a final hackathon project
What I learned
I learned that I hate front end (again)
What's next for Google vs. Wall Street
Possibly pushing updates to the application that allow the trends for both the stock ticker, and google trends to update in real time, as well as give users better time coordinates they can filter their data with (for example, give people an option to see timelines for trends such as: 1 day, 1 week, and 1 month, and all time options as opposed to just 1 year, 2 years, 5 years).


Log in or sign up for Devpost to join the conversation.