-
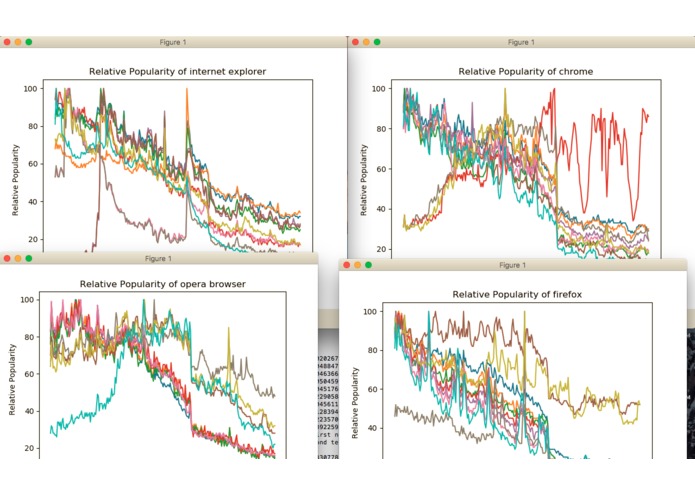
Interesting representation of browser interest on search engines 2012-2017.

Inspiration
I was inspired by the abundance of unused and untapped potential of search engine statistics, and how this data can be valuable to firms in their decisions and planning for the future.
What it does
Using a modified custom build google trends API, the algorithm takes one or more search terms and displays the popularity of that term over time. By cross referencing one or more terms with other similar terms, the algorithm takes the big picture of a set of search terms. By statistically analyzing the datas through a quadratic least squares regression, the algorithm gives those inputted terms a past and direction, allowing a completely new and unique view of the data.
How I built it
I used an open source python google trends API (not created by google), as the backbone of the project, changing the API source to better fit the efficiency and input needs of my algorithm. Next I used this same interface to access an expandable number of additional variable terms, and cross reference those terms with the root term. I used bounds to determine the breadth and depth of analysis. Next, using the matplotlib library, I created a easily accessible, comparable, and expandable visualization of the data over an any possible number of terms.
Challenges I ran into
Installing and configuring the pytrends API was especially dificult, as I needed to alter the API to fit my needs, and I was not aware of how an API works. Also, I had to completely wipe and reinstall my python computer framework because of multiple versions.
Accomplishments that I'm proud of
I am proud of my visualization, which is eye catching, expandable, and easily readable.
What I learned
I relearned python, about Google API, handling large amounts of data, and Unix command line syntax.
What's next for Google Trends Custom API For Emerging Technologies
This algorithm is only the beginning of huge capabilities in this framework. After removing the data from google trends, there are countless applications and visual representations to be made. The data is very responsive to real world events as easily shown in the data and has clear value to private entities looking to analyze portions of the market.

Log in or sign up for Devpost to join the conversation.