🏗️ Project Story — ValueVista: Intelligent Real Estate at a Glance
🌟 Inspiration
The spark for ValueVista came from a frustrating experience shared by millions: searching for a home or investment property without truly understanding the context—neighborhood safety, future property value, commute time, walkability, or long-term costs. Most platforms only surface listings, not insights.
We envisioned a tool that could democratize real estate intelligence, helping everyday buyers, investors, and renters make smarter, data-backed decisions. Inspired by tools used by institutional investors and urban planners, we set out to bring that power to the public—with beautiful visualizations, AI-driven recommendations, and interactive maps.
🔍 What It Does
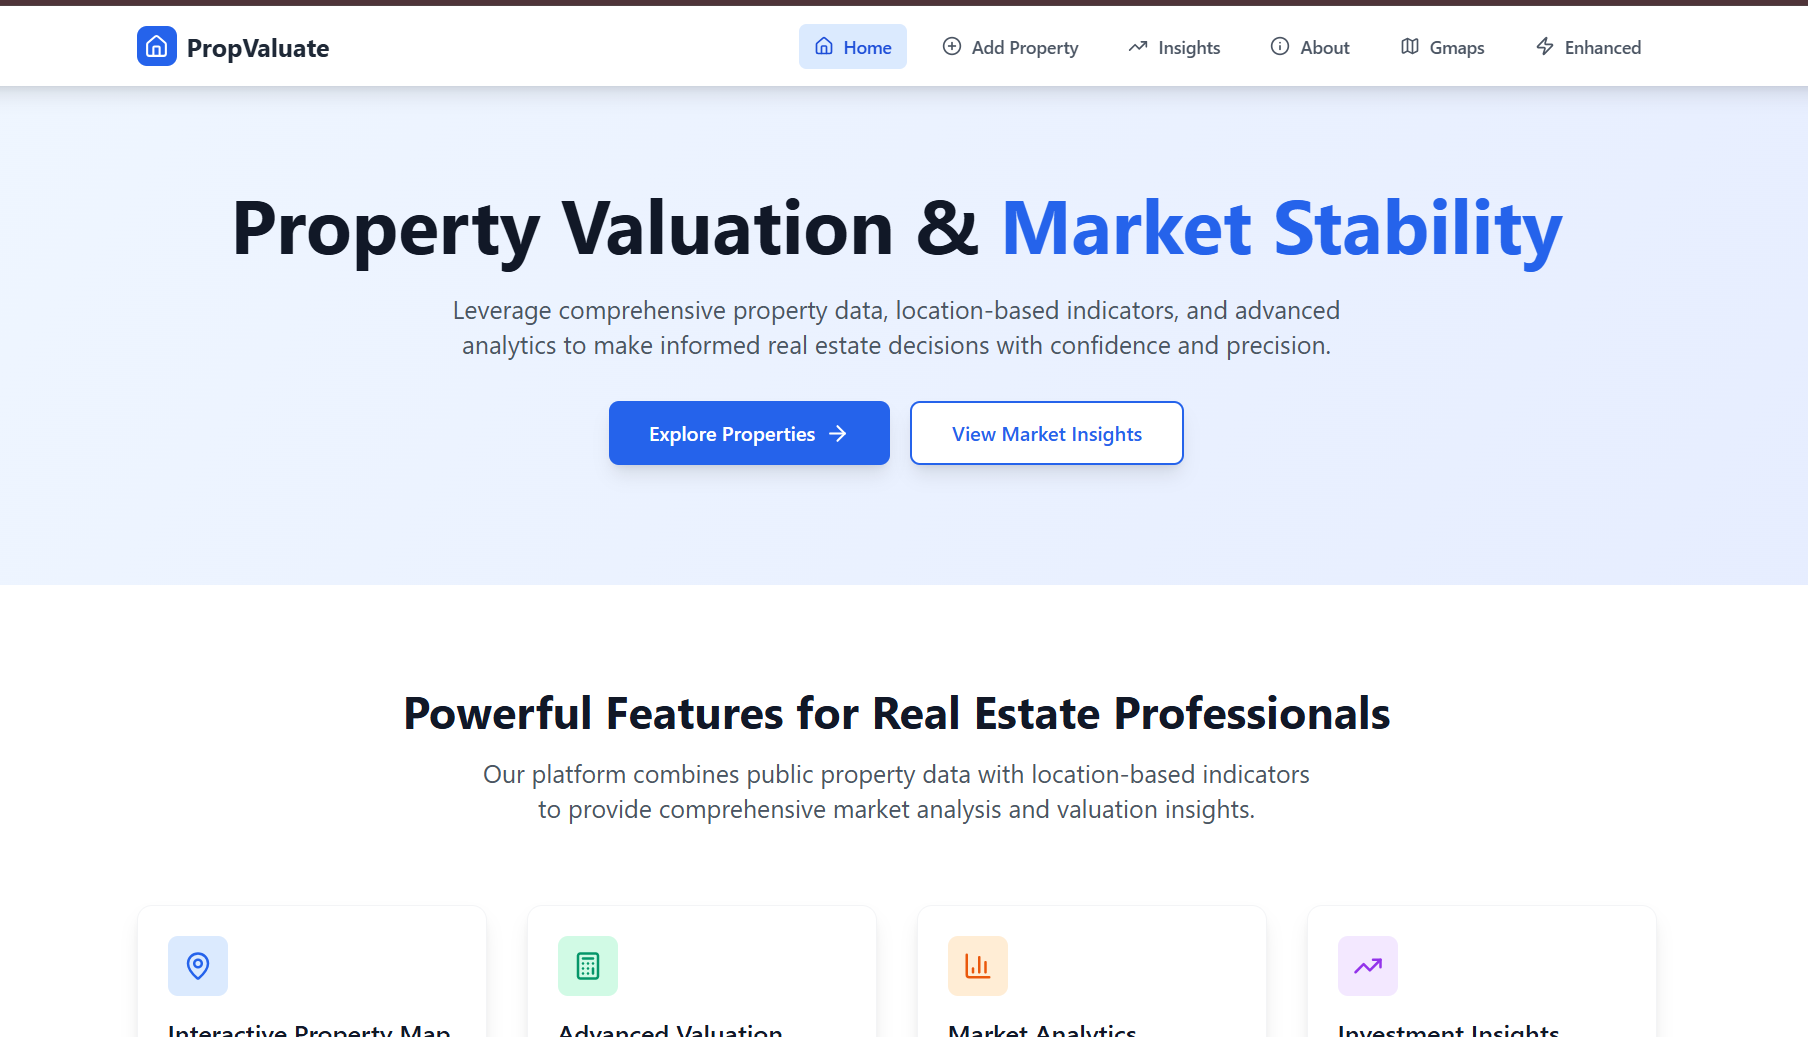
ValueVista is a comprehensive, next-generation real estate platform that empowers users to:
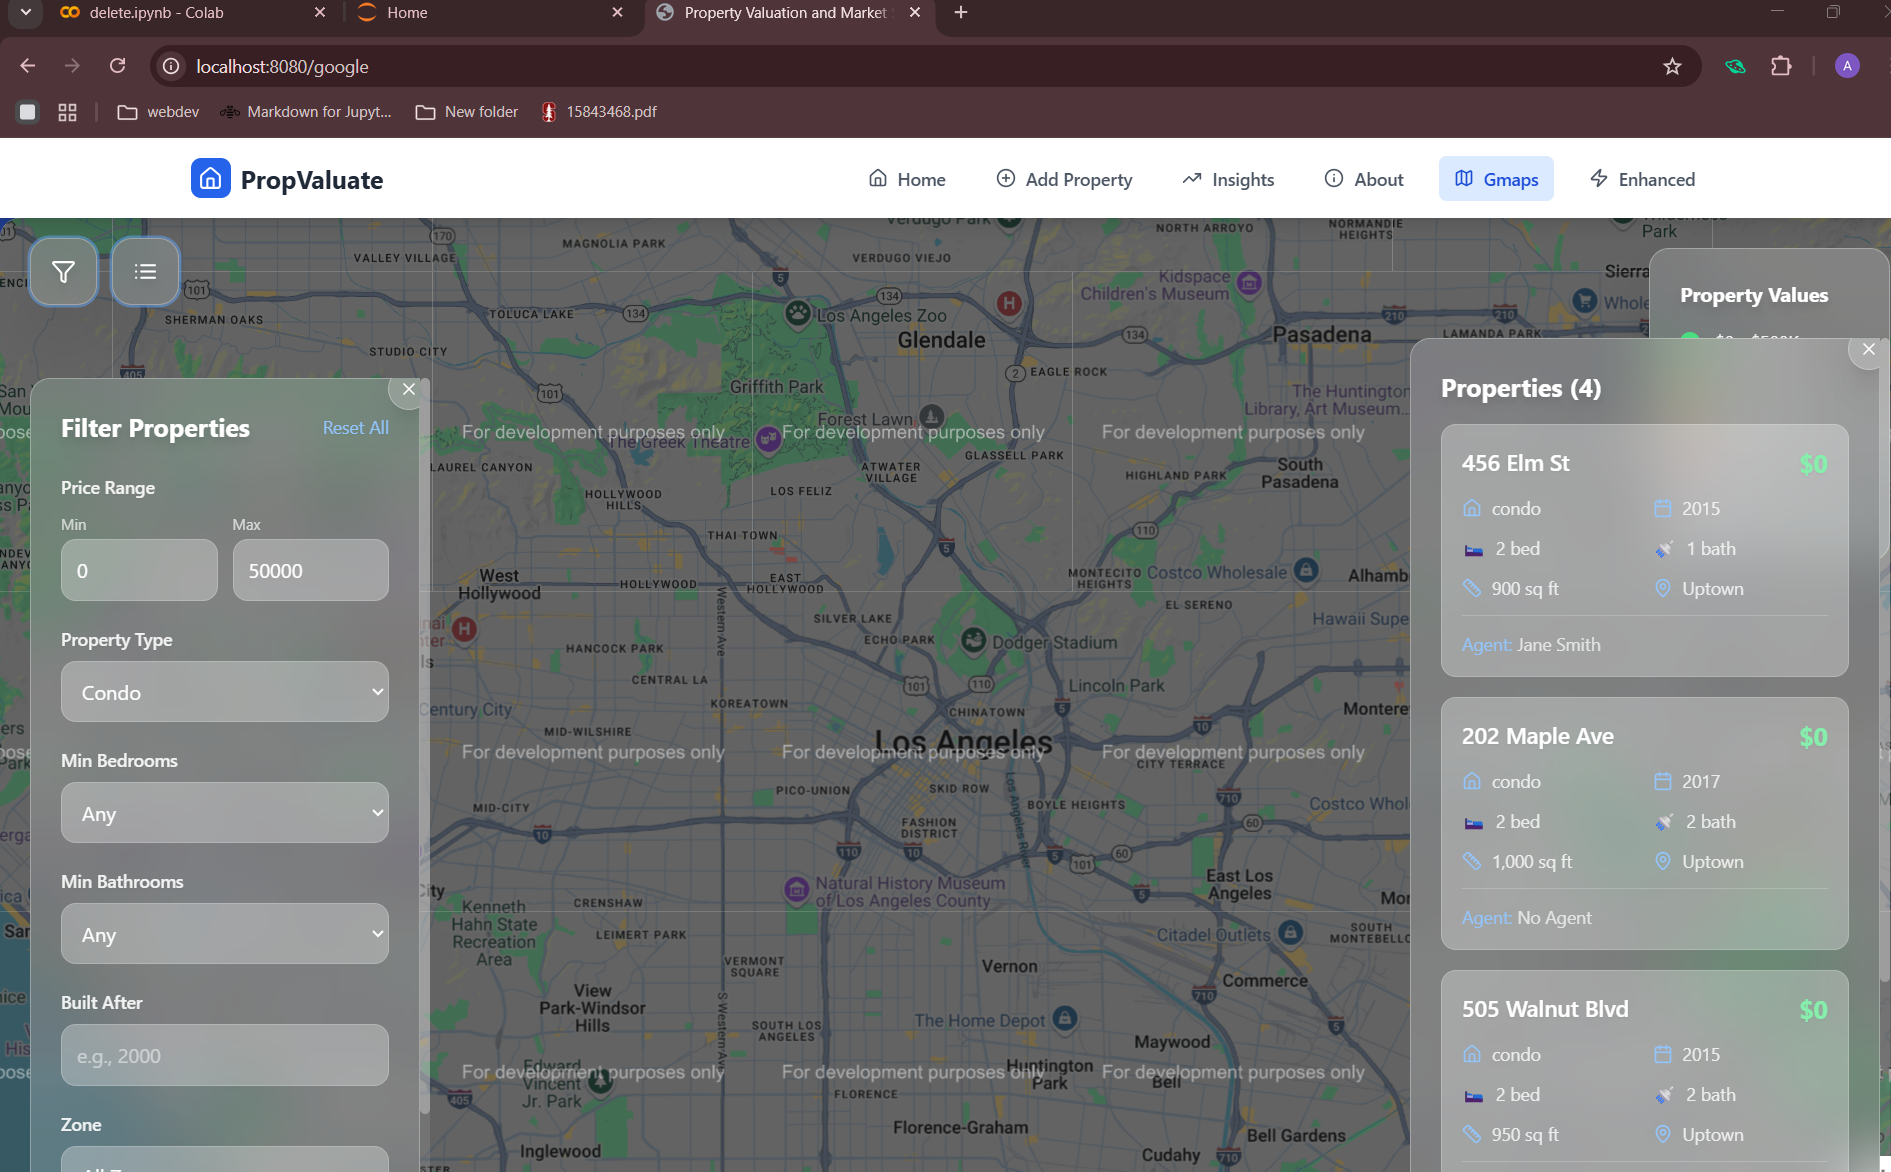
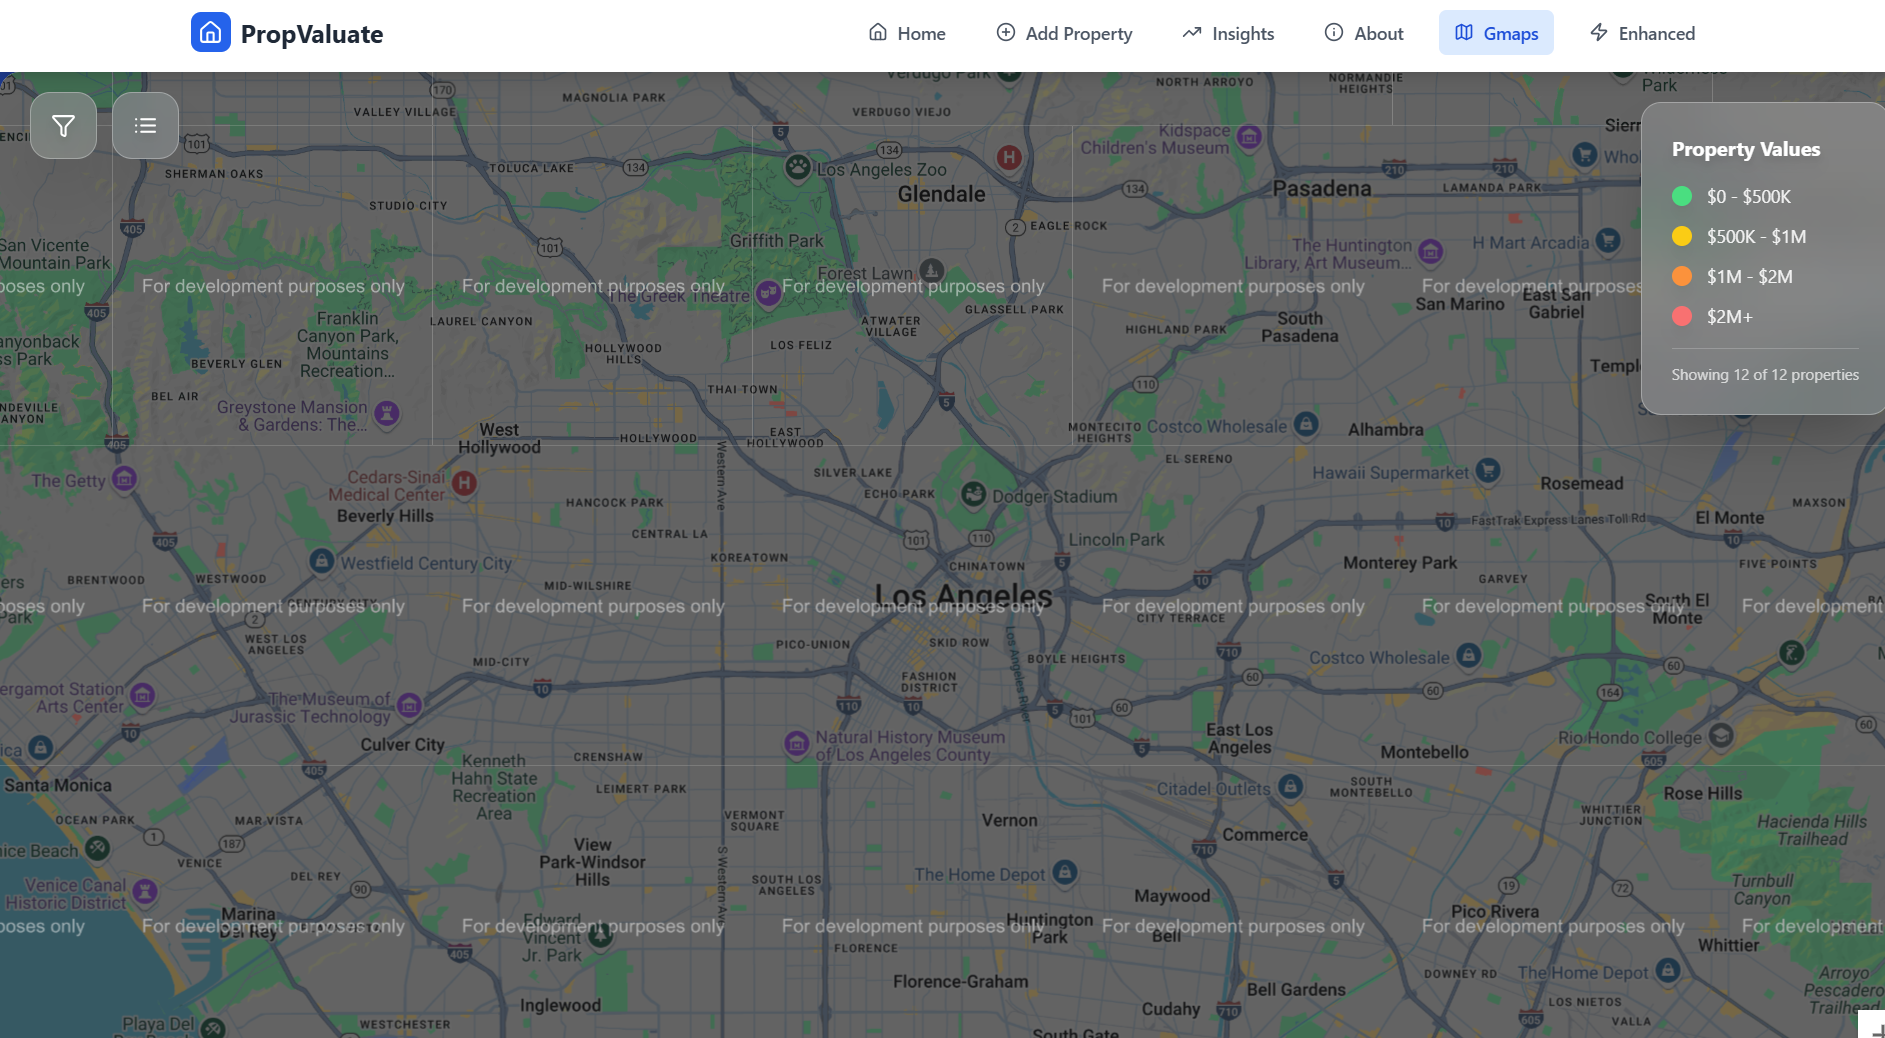
- 🔥 Visualize property density, prices, and construction age on dynamic heatmaps
- 🧮 Calculate total cost of living, ROI, and mortgage scenarios in real time
- 📊 Analyze school zones, commute times, public transit, and local businesses
- 📅 Save searches, compare properties side-by-side, and receive opportunity alerts
- 🤝 Connect with agents, neighbors, and service providers in-app
🛠️ How I Built It
✨ Frontend
- React with JavaScript
- Tailwind CSS for design system
- Lucide Icons for a lightweight icon library
- Google Maps API and Mapbox GL for layered visualizations
⚙️ Backend & APIs
- GraphQL (custom schema via Apollo Server)
- Node.js with Express for backend services
- MongoDB (with Mongoose) for geospatial storage
- External APIs:
- Google Places API
- Google Places API
🧗 Challenges We Ran Into
- Data inconsistency: Normalizing location, pricing, and time-series data across various APIs and public records
- Rendering performance: Balancing real-time overlays and animation with responsiveness on lower-end devices
- UX vs data depth: Conveying complex insights (e.g., ROI or commute stress) without overwhelming users
- Mobile optimization: Retaining interactivity and clarity for small screens and touch-based navigation
🏆 Accomplishments That We're Proud Of
- 🌍 Created a fully interactive geospatial analytics experience for everyday users
- ⚡ Achieved smooth rendering performance using virtual layers, lazy loading, and caching
📚 What We Learned
- Great UX is what you hide as much as what you show
- AI models don't replace decision-making, they enhance it
- Community matters — neighborhoods are about people, not just data
- Planning for scale early—via modular components, cache-first logic, and performance profiling—saves major rework
🚀 What's Next for ValueVista
- 📡 AR View: Augmented reality overlays of listings and insights using mobile cameras
- 💬 Voice Search: Natural language search ("Show me homes under \$500k near top-rated schools")
- 📈 Predictive Investing Tools: 5-year market value forecasts using machine learning
- 🛠️ Agent Portal: CRM, lead tracking, and market tools for professional agents
- 🌐 International Expansion: Multi-language support and global API integration
- 🔗 Blockchain Smart Contracts: Secure and transparent transaction processing
- 🧠 Neural Insight Engine: Behavior-driven, real-time insight suggestions powered by usage patterns

Log in or sign up for Devpost to join the conversation.