


Inspiration
We were interested in applying our data analysis skills to a real world problem like Stock analysis. We got the data and spent the first day figuring out what the data meant. After this, we cleaned the data and tried to extract meaning from it by analyzing it.
What it does
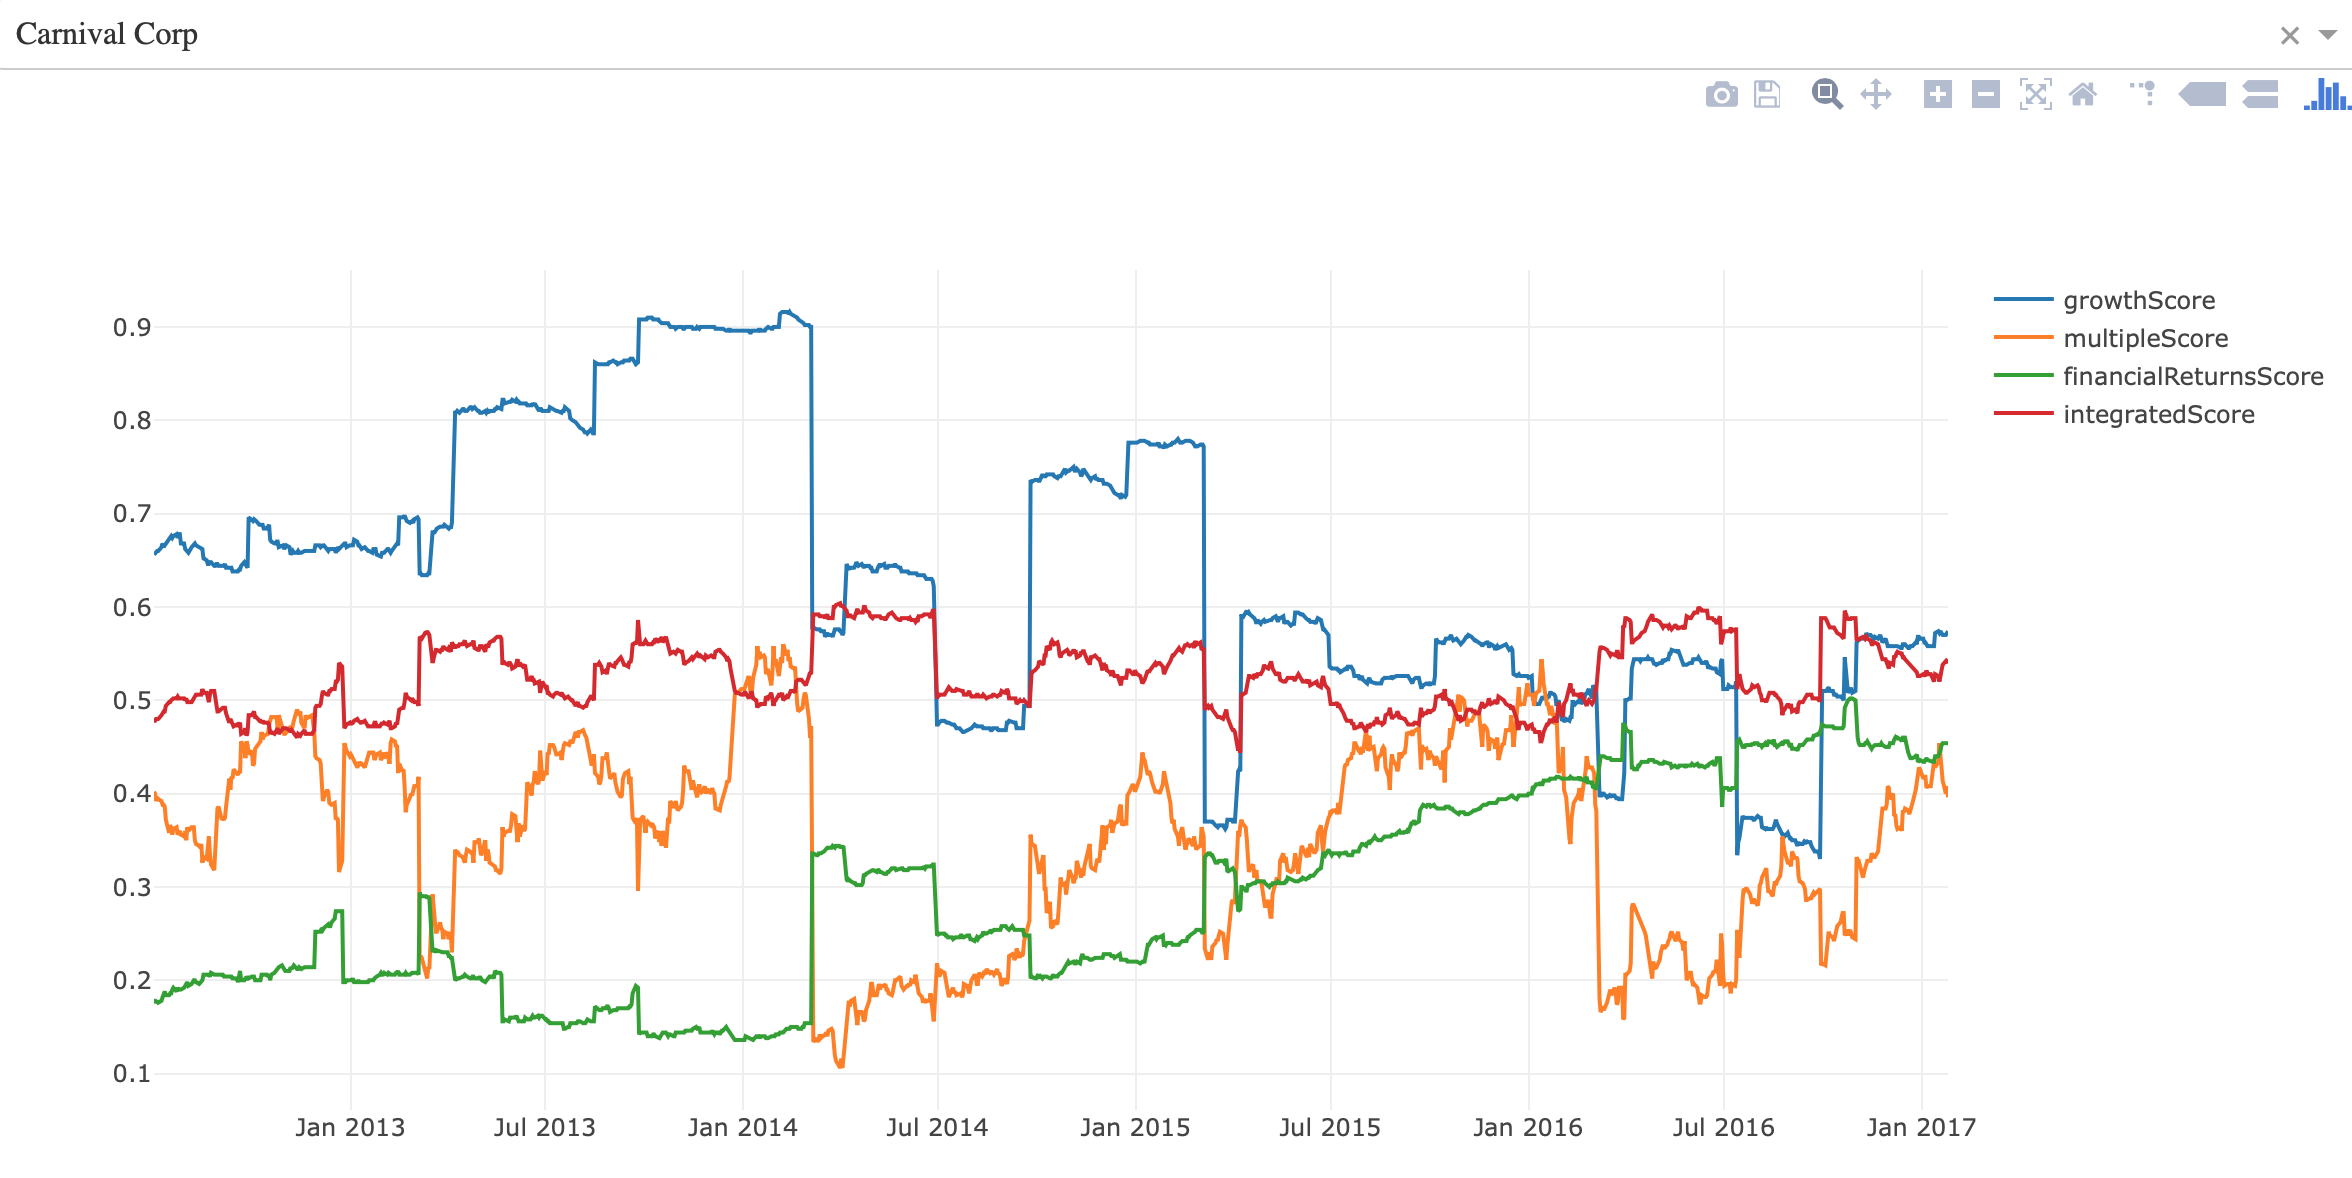
This application presents the Goldman Sachs Marquee data in a user-friendly manner and then also recommends stock picks in different categories based on user preferences.
How we built it
python (pandas/numpy) as the backend to query and analyze, using dash as the backend
Challenges we ran into
Figuring out the front-end aspect of the project. We spent too much time trying to figure out various front-end platforms.
Accomplishments that we're proud of
We were able to develop meaningful analysis and visualization from raw data
What we learned
We were able to learn a lot of front-end development since we did not have much prior experience
What's next for Goldman Sachs Marquee Visualizer
Could be carried out so that every day users can have a better way of knowing what stocks they should invest in

Log in or sign up for Devpost to join the conversation.