-
-
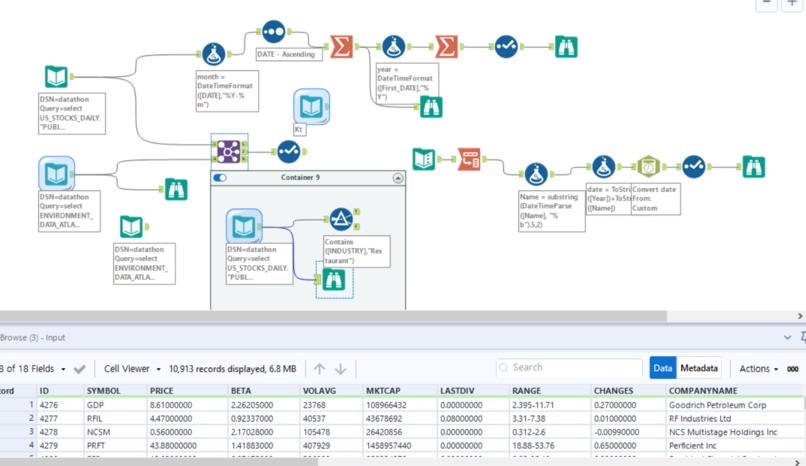
Data Analyzing Tool Alteryx
-
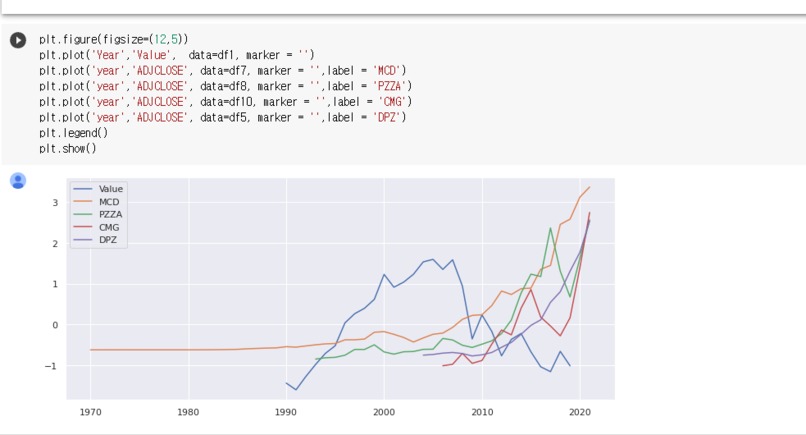
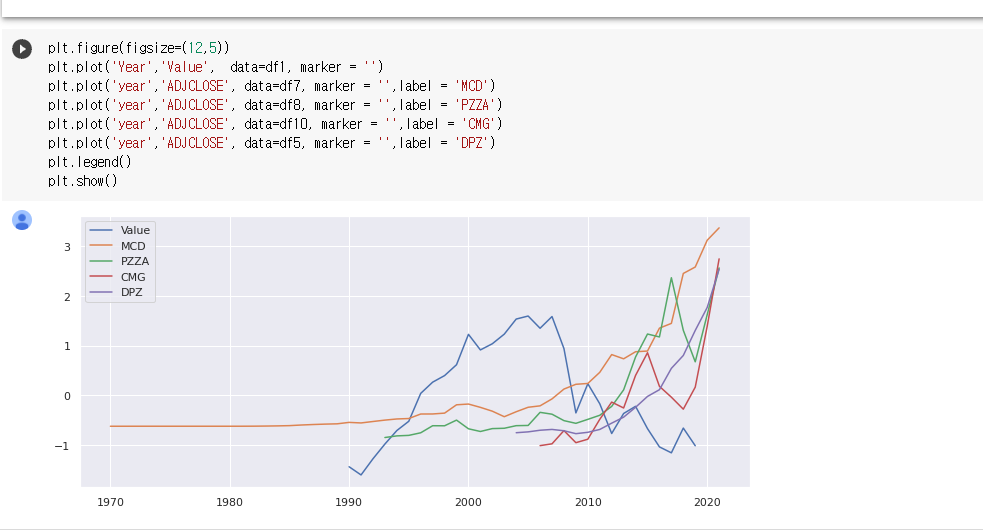
Graphical Representation of Restaurant Stock Price and CO2 Emissions
-
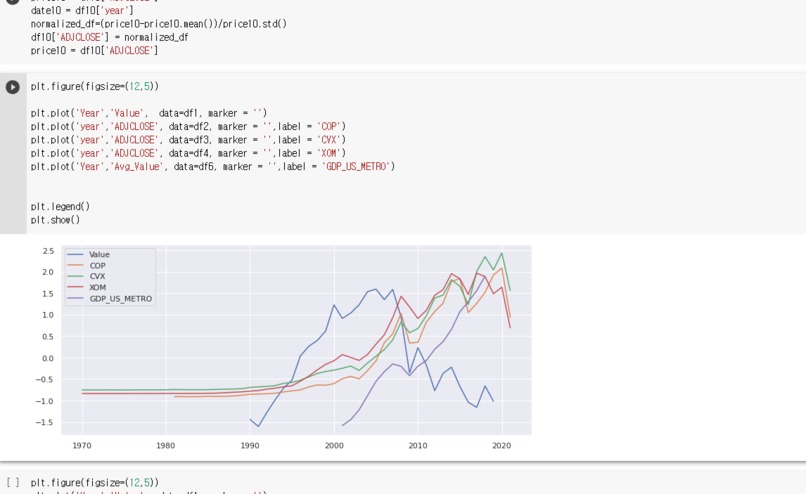
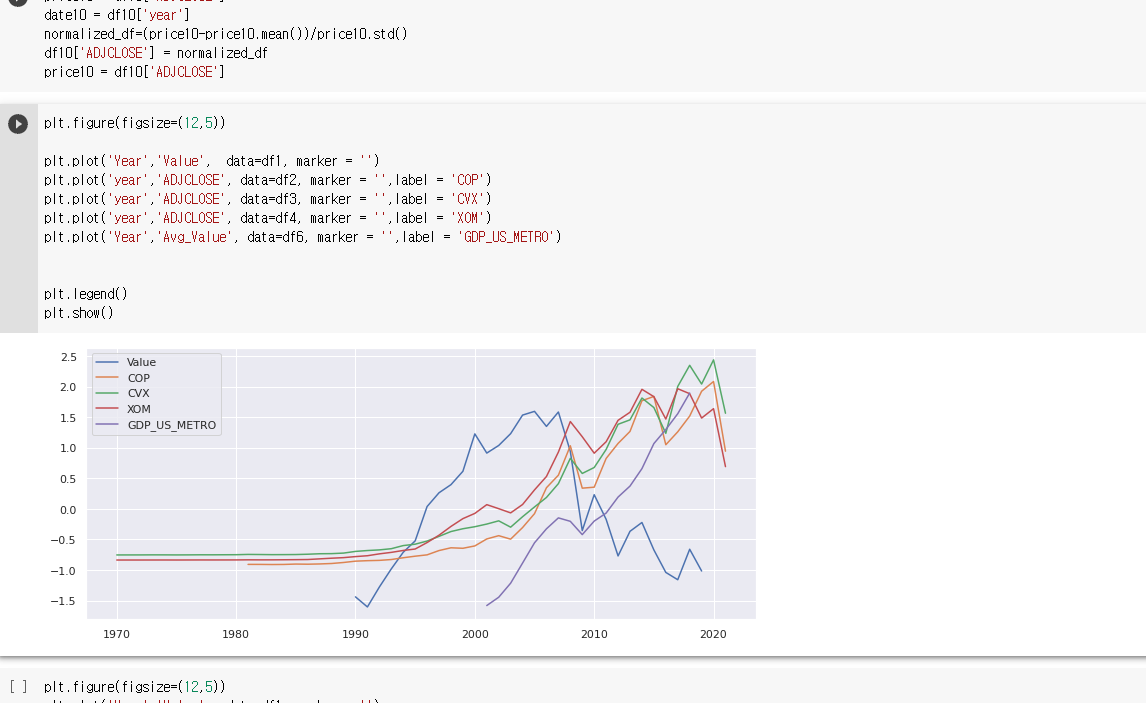
Graphical Representation of Oil/Gas Companies and CO2 Emissions
Inspiration
We were curious on how COVID-19 impacted the stock price and CO2 emissions within the United States and wanted to investigate if there existed any relationships. We continued to focus on how the stock price of a oil/gas company is correlated to the CO2 emissions of the United States.
What it does
We have found a relationship between CO2 emissions and the stock price of Conoco Phillips and Exxon Mobile. We also investigated the relationships between various restaurants and CO2 emissions of the United States but could not find a strong correlation between the two.
How we built it
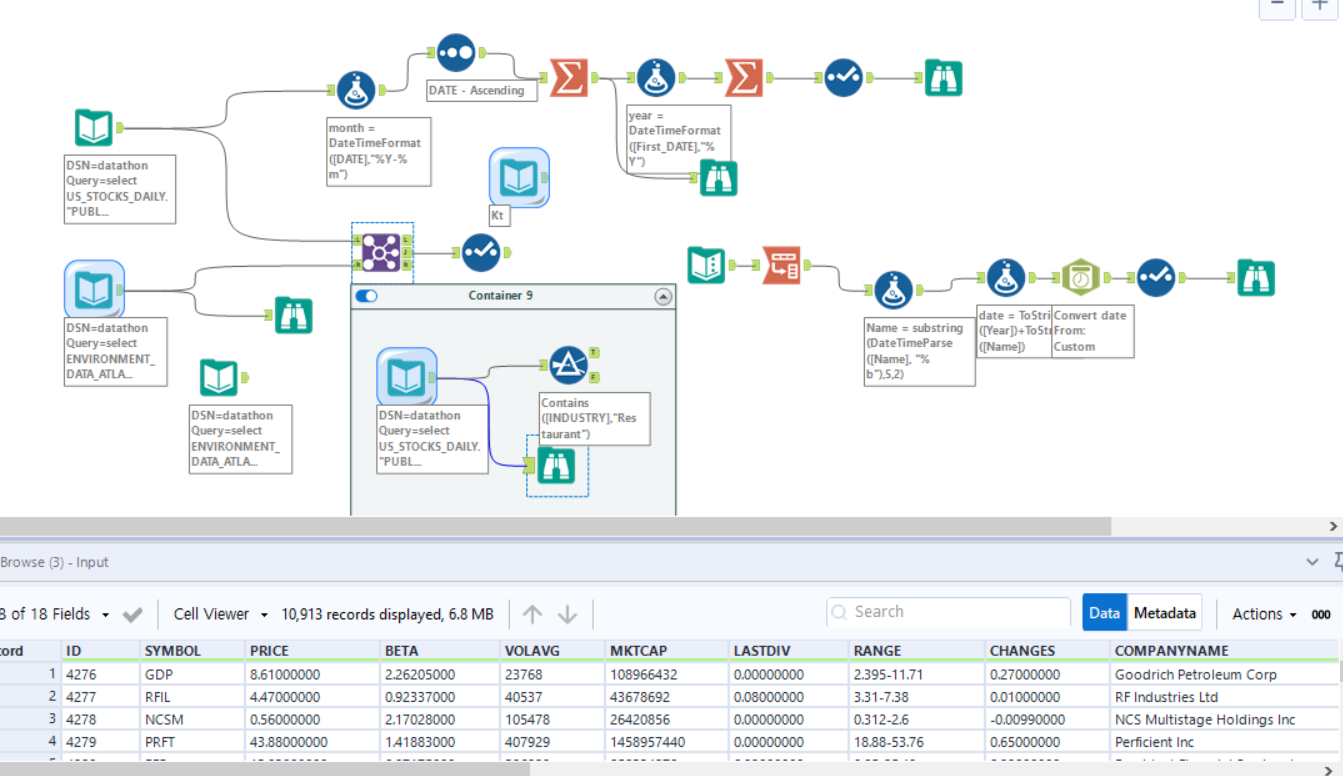
We have created charts to display these relationships. We've gathered the data from the available resources from Snowflake. We connected the Snowflake service to Alteryx data analysis tool.
Challenges we ran into
The largest challenge we ran into was the difficulty of finding datasets that were correlated with each other. Since there were over 100 tables to search in, each table containing different value types, it became a large search problem.
Accomplishments that we're proud of
We are proud to have found a correlation to explain! And the fact that most of us were able to learn a new tool analyze data.
What we learned
We learned how to comb through large amounts of data and think critically about the data we were looking at. We also learned how to use Snowflake and Alteryx software.
What's next for Goldman Sachs Challenge Submission
I think something we can improve on is to find a better algorithm to search through the datasets and create mathematical relationships between CO2 emissions and stock prices.
Built With
- alteryx
- google-collab
- snowflake

Log in or sign up for Devpost to join the conversation.