-
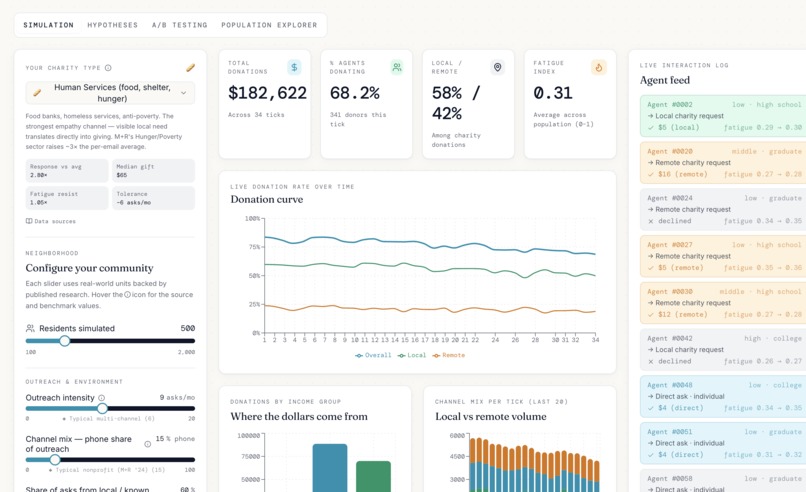
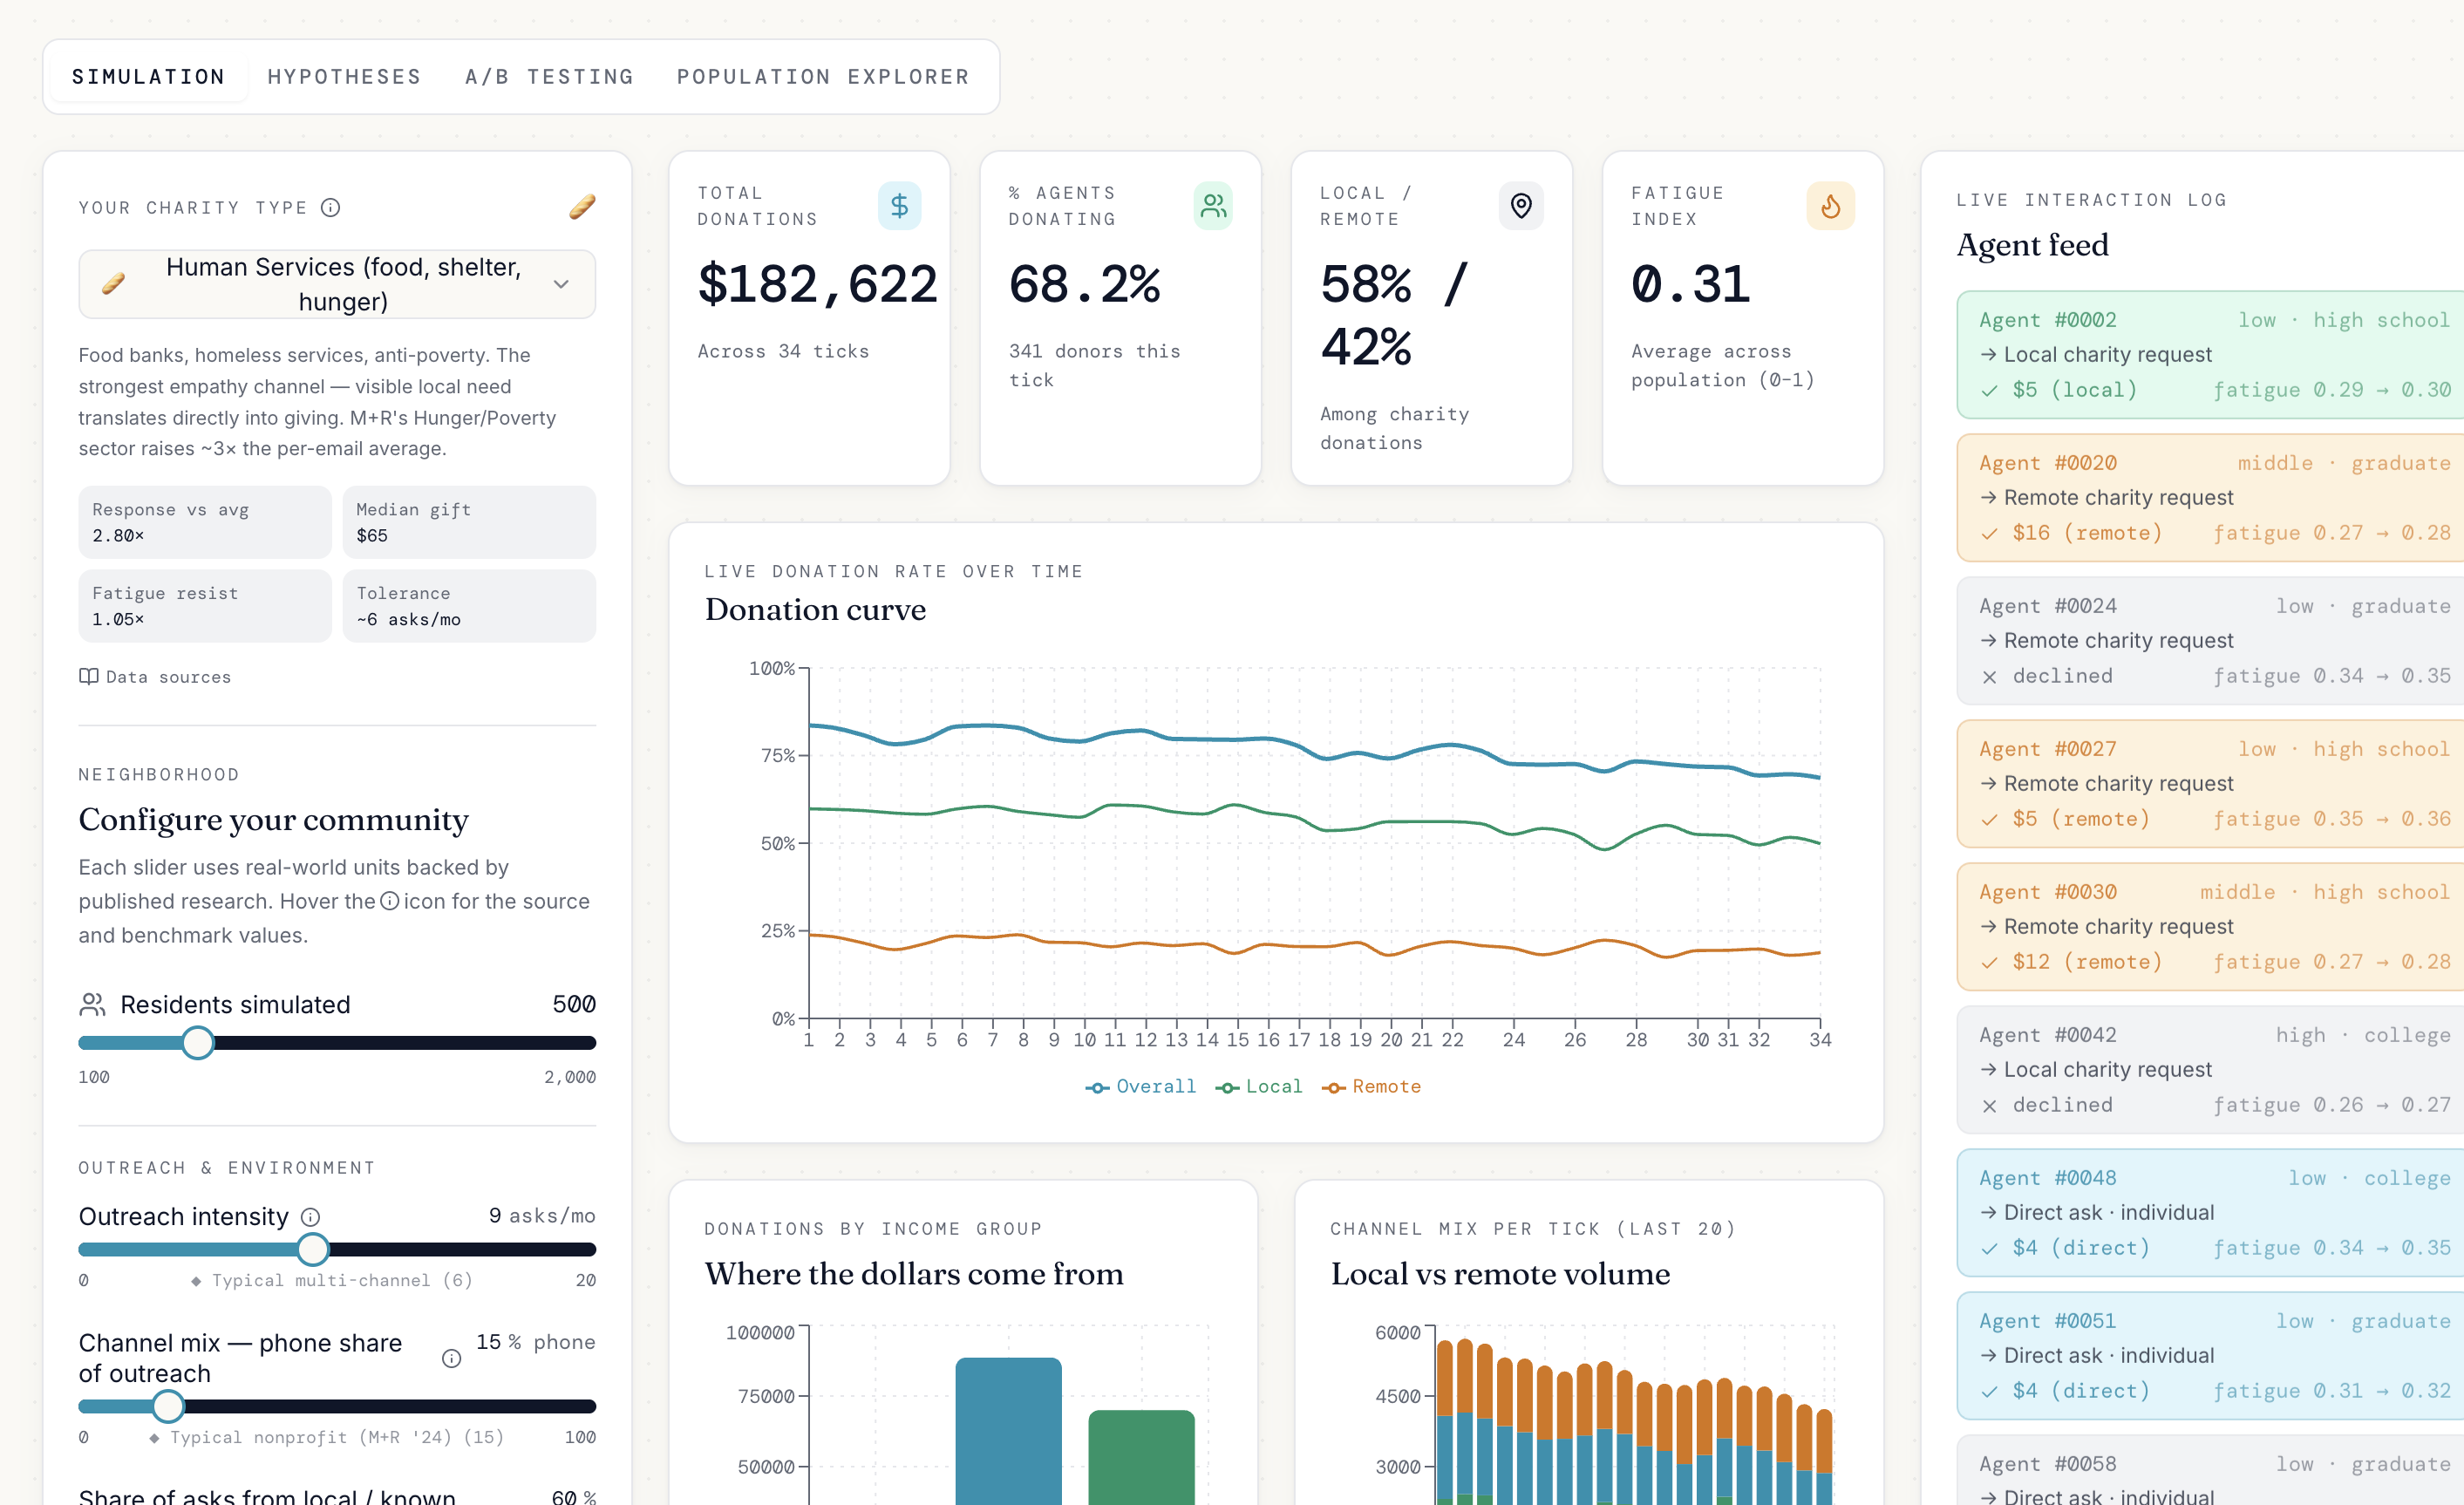
Live Simulation
-
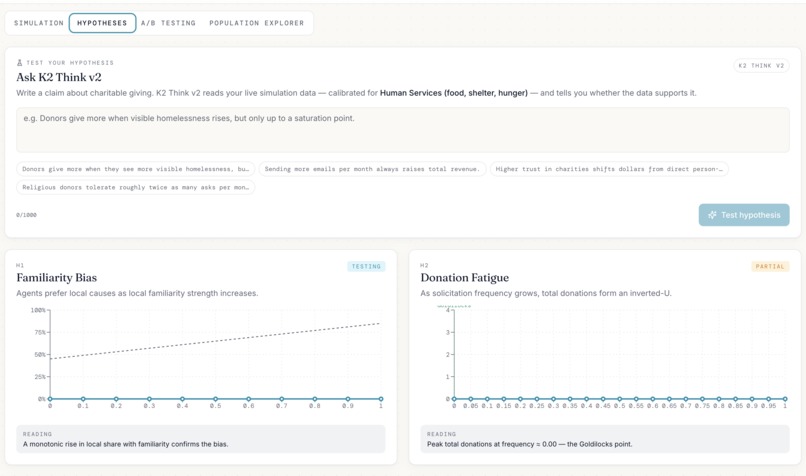
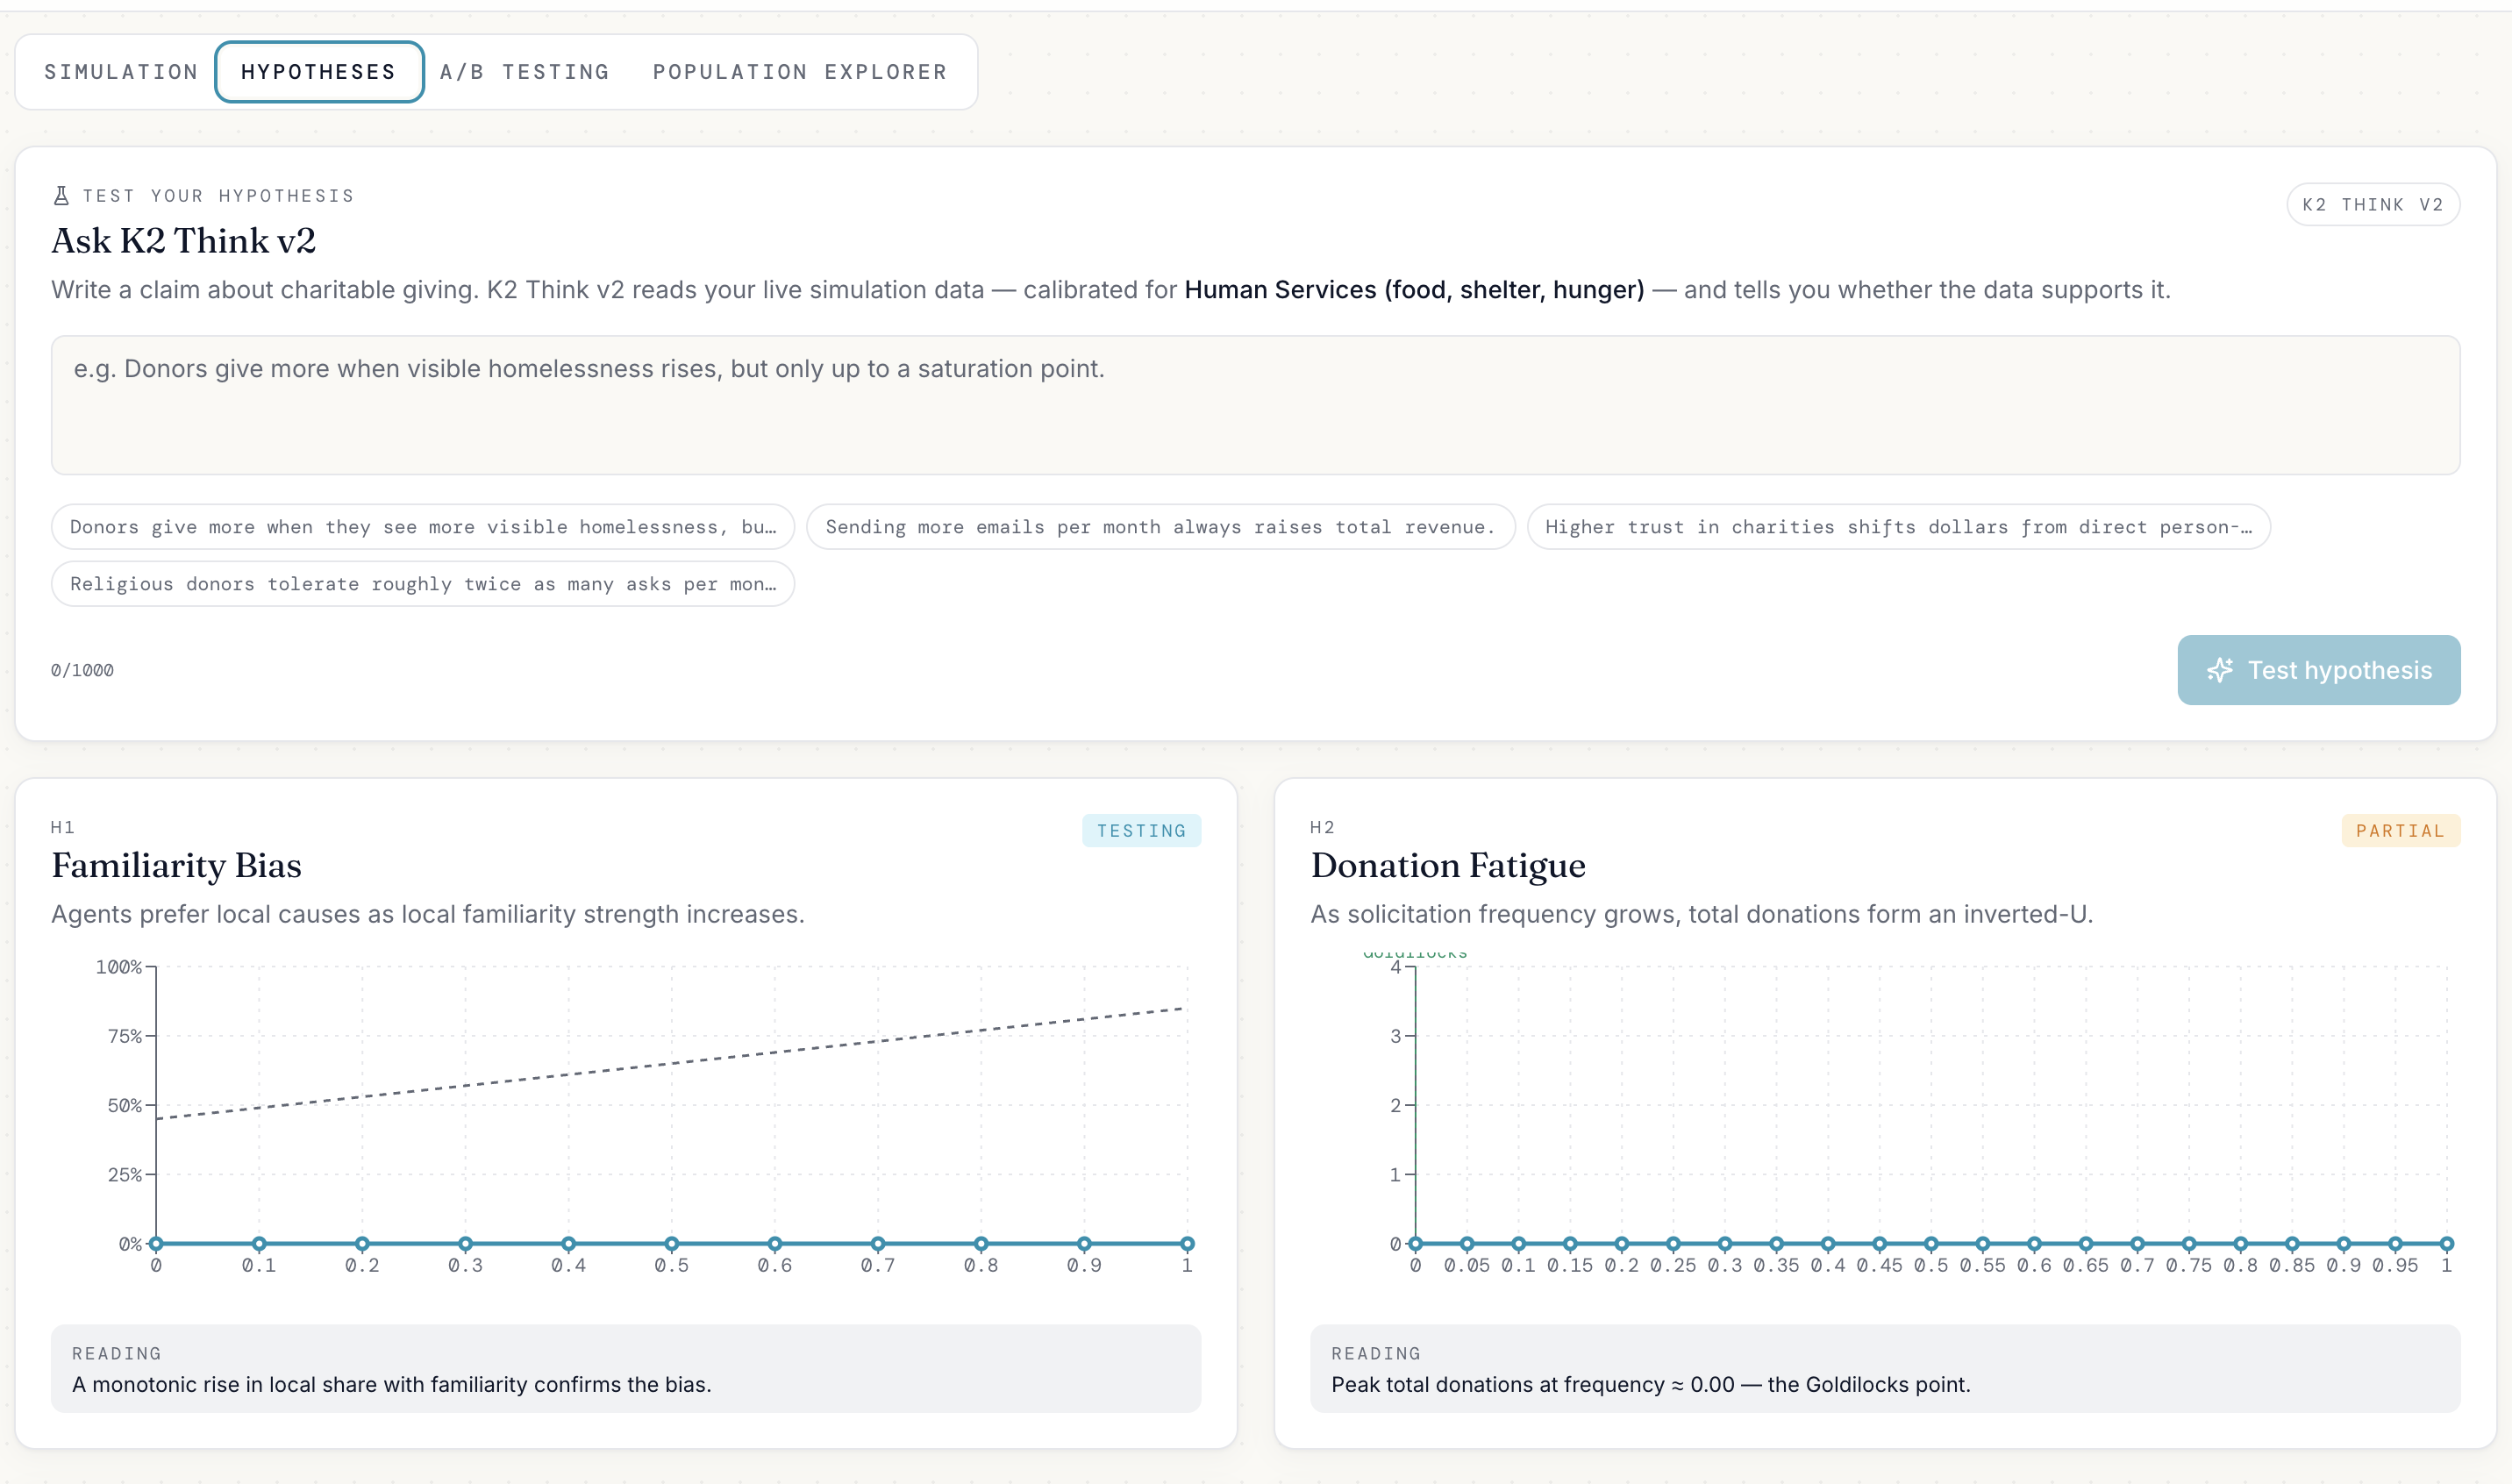
Hypothesis Testing powered by IFM
-
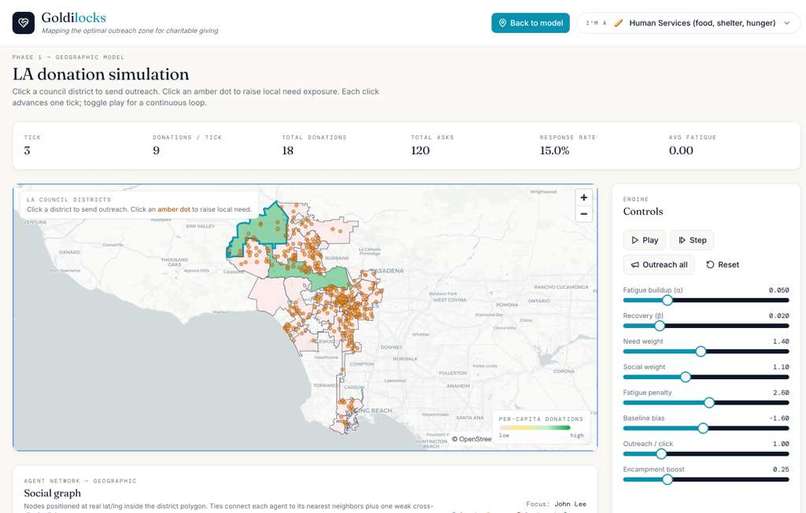
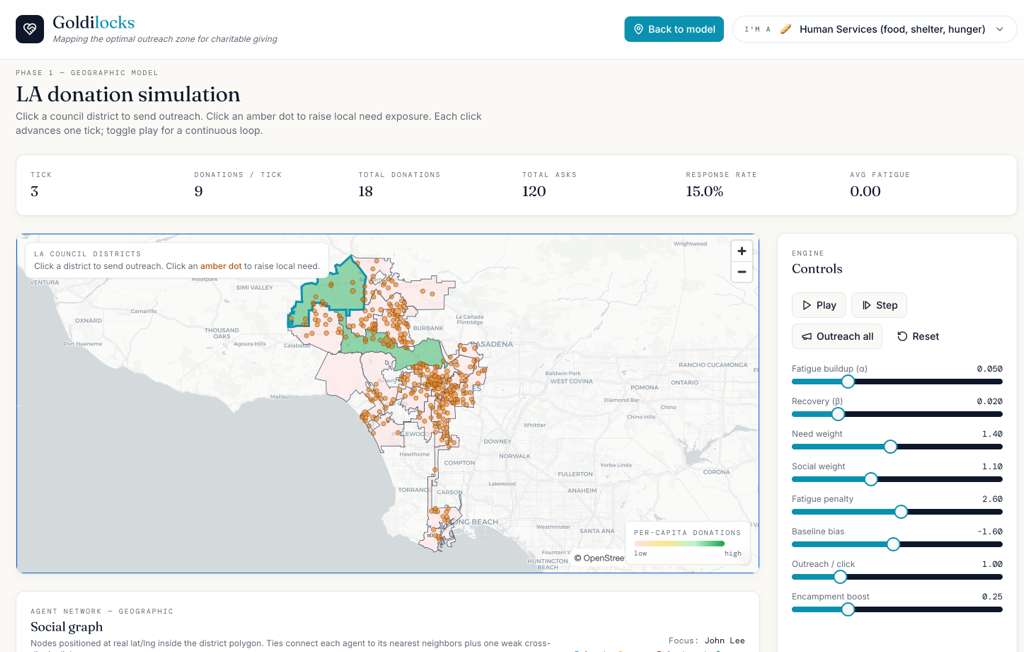
Geo-spatial Mapping w/ Interactability
Inspiration
A few months ago, I was walking through Los Angeles and passed the same stretch of street twice in one day. In the morning, I noticed a small encampment, with tents tucked against a wall and a couple of people sitting outside. It stuck with me. Later that evening, I got an email from a charity working on homelessness and I donated. A week later, I got another email. Then a text. Then another email from a different organization. Same issue, same urgency. By the third or fourth ask, I ignored it.
Nothing about the cause had changed. But my reaction had. That's what Goldilocks solves for.
What it does
Goldilocks is an interactive simulation platform that models how donations change based on: Outreach intensity Local context (e.g., homeless encampments) Social and neighborhood dynamics
This models how donor behaviour changes based on fatigue from outreach, visibility of poverty, familiarity with the non-profit organization (I'd donate to my local shelter but not Red Cross) and more mapped against a real simulation of people based on emotional mapping via survey responses.
Users can: Click on a district in Los Angeles Target a specific encampment Simulate increased outreach
And instantly see: A network graph of residents reacting (green = donation, red = no donation) A map of LA updating per-capita donation rates by district A live donation curve showing system-wide impact over time
It turns abstract fundraising strategy into a living, explorable system.
How we built it
Goldilocks combines three core systems:
Network graph (D3.js) Models individuals as agents connected by influence and shared exposure Geospatial map (Mapbox) Displays Los Angeles districts and overlays homeless encampment data (311-style datasets) Simulation engine (custom logic in React/JS) Updates each agent’s: donation probability fatigue (from outreach) response to local need
These systems are synchronized through a shared state layer, allowing:
Map interactions → network updates Network behavior → map and metrics updates
All behavior is user-driven and deterministic, making the system explorable rather than opaque.
Challenges we ran into
Balancing realism vs. usability Real donor behavior is complex. Simplifying it into intuitive rules without losing meaning was difficult. Making the network graph understandable Dense graphs quickly become noise. Getting to a point where interactions felt “alive but readable” took iteration. Linking spatial + network dynamics Connecting geographic events (like encampments) to individual agent behavior required careful modeling. Avoiding metric overload It’s tempting to show everything. Focusing strictly on per-capita donations made the product clearer.
Accomplishments that we're proud of
Turning a vague concept like “donor fatigue” into something visual and interactive Creating a system where micro decisions (individuals) visibly affect macro outcomes (city-level giving) Designing an interface where users can experiment and immediately see consequences Integrating real-world context (homelessness data) into behavioral simulation
What we learned
Visualization is as important as modeling A good model is useless if people can’t understand it. Human behavior is highly contextual Geography, visibility, and social signals matter as much as outreach itself. Interactivity drives insight Letting users “poke the system” reveals patterns far better than static dashboards. Simplicity wins Focusing on a single metric (per-capita donations) made the entire experience more powerful.
What's next for Goldilocks
Richer behavioral models Different donor types (habitual vs. reactive vs. fatigued) Multi-charity competition Better real-world data integration Live 311 feeds Census + income overlays Scenario testing “What happens if 3 charities target the same district?” “What if outreach shifts to digital vs. local?” Optimization layer Suggest “optimal outreach strategies” instead of just simulation Scaling beyond LA Expand to other cities with configurable datasets
Built With
- maplibre
- react18
- reactrouter
- tailwindcss
- typescript
- vite
- zustand


Log in or sign up for Devpost to join the conversation.