-
-
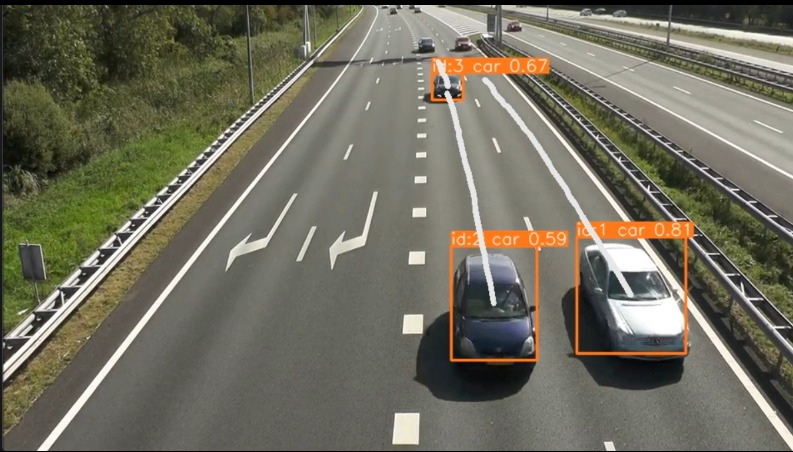
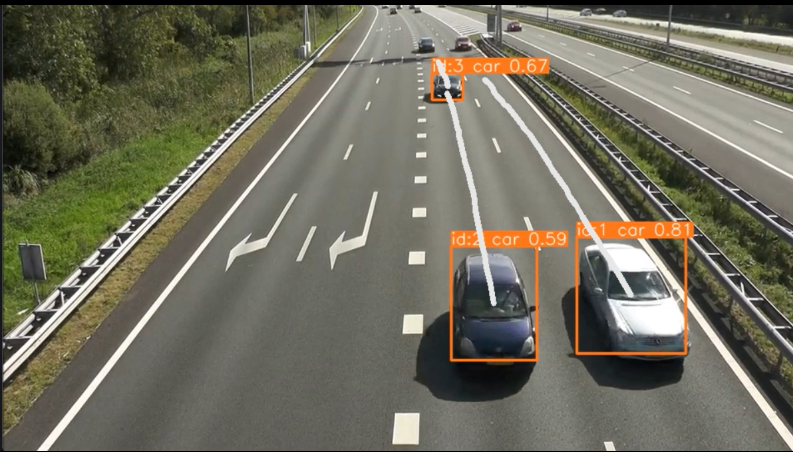
Camera tracking linearity of cars
-
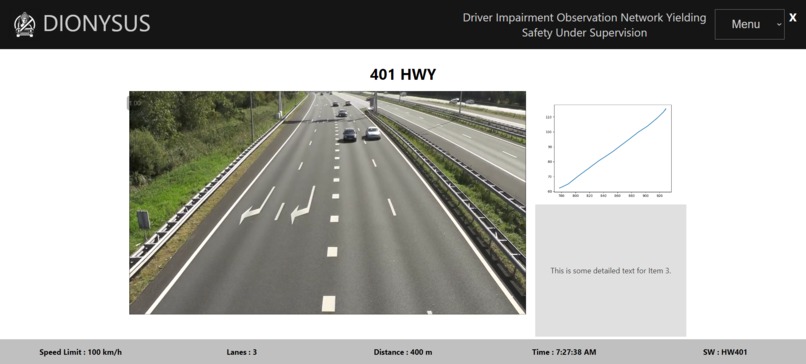
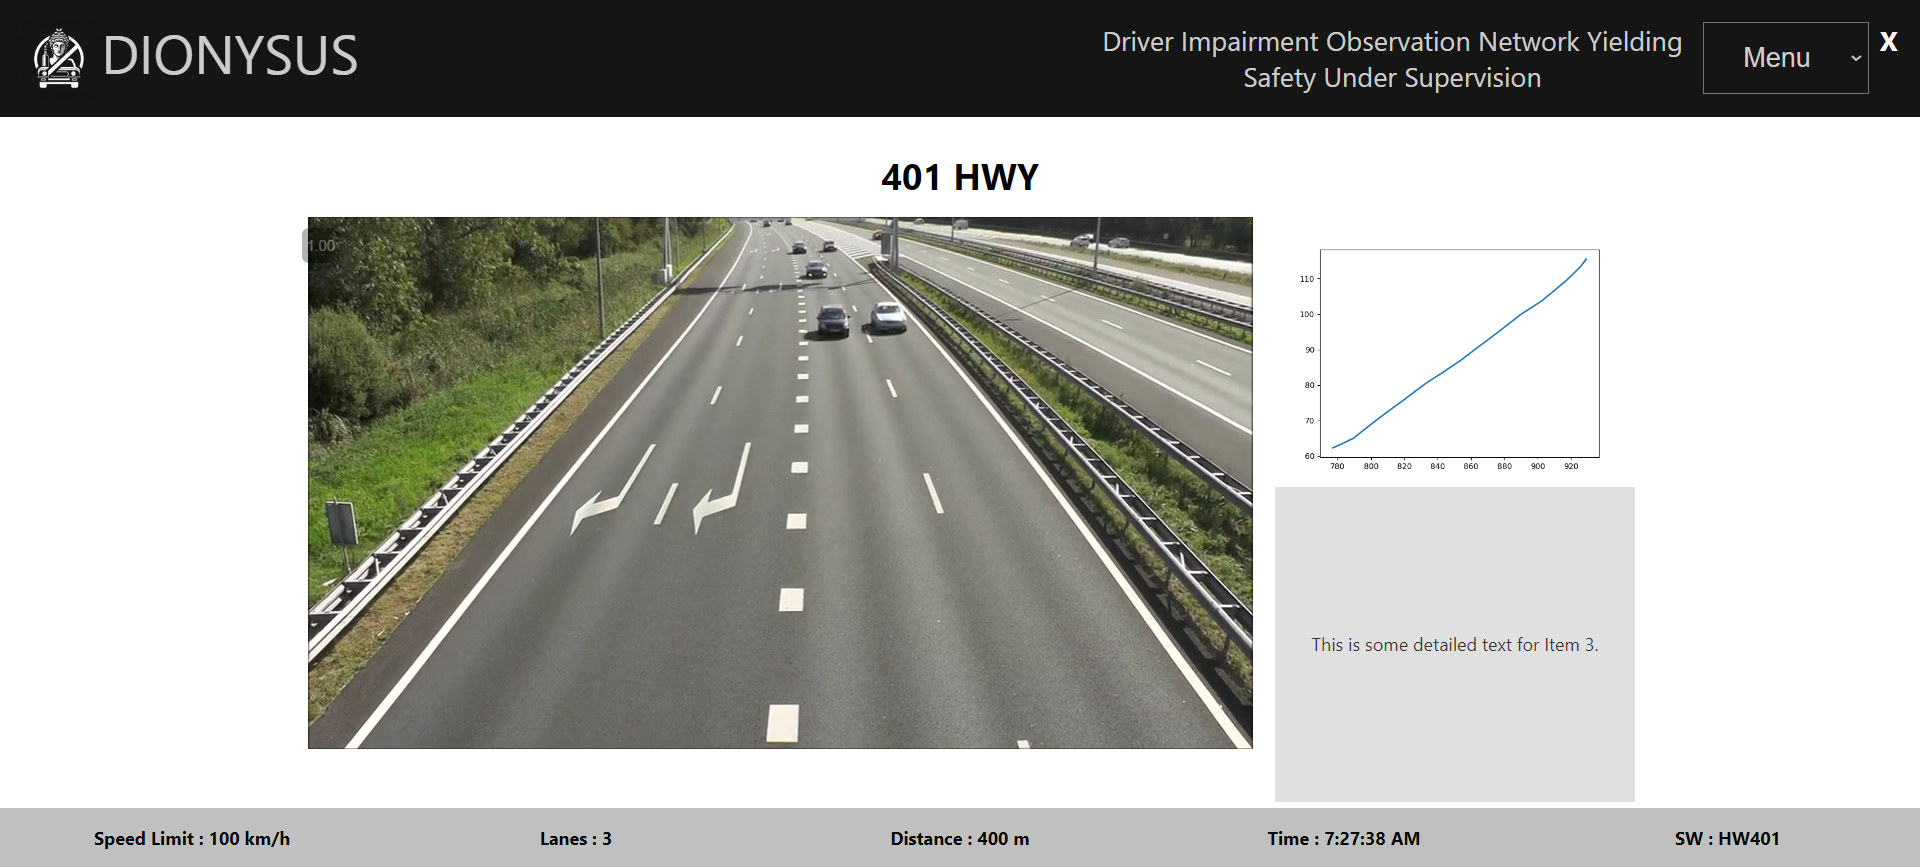
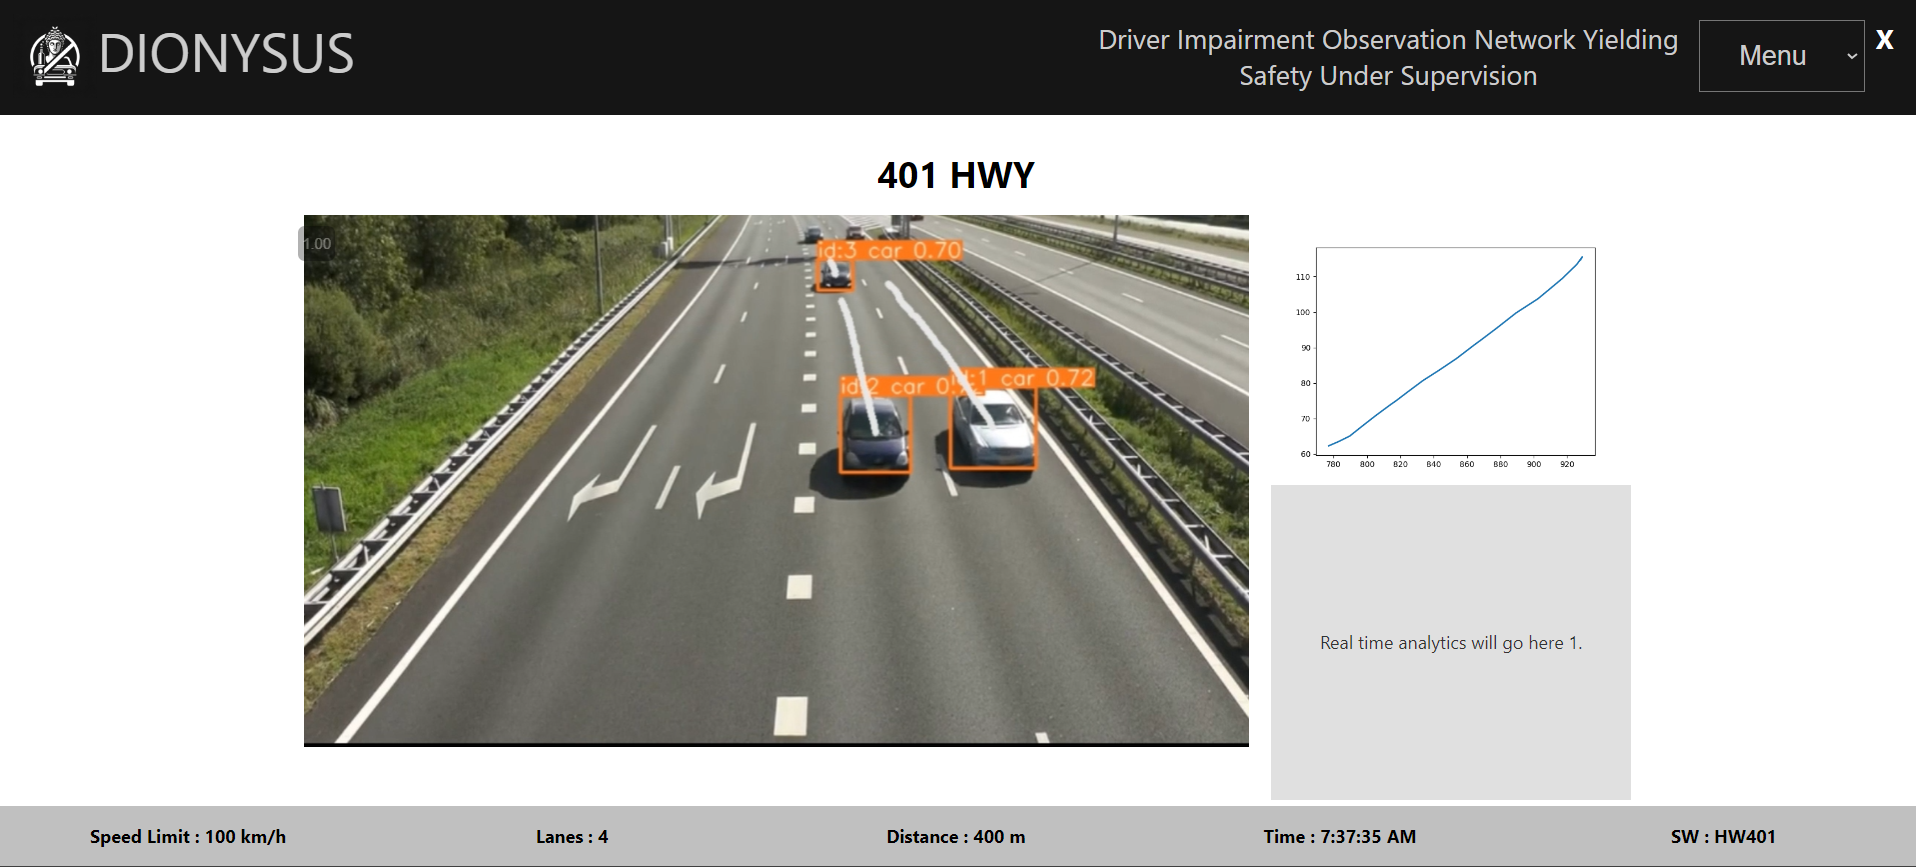
HUD display for law enforcement
-
-
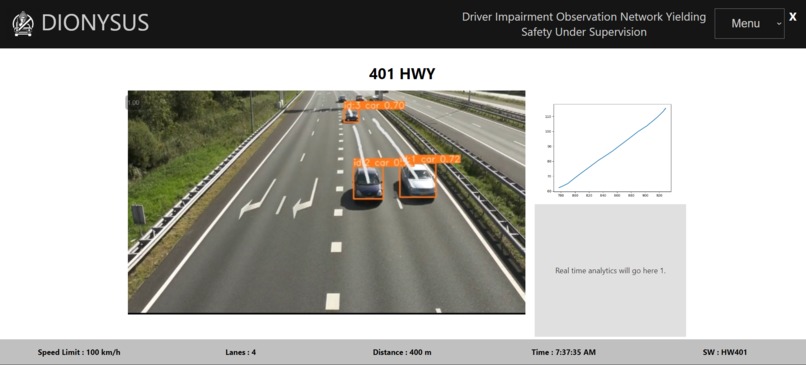
Inspiration
Every day, about 37 people in the United States die in drunk-driving crashes — that's one person every 39 minutes. In 2021, 13,384 people died in alcohol-impaired driving traffic deaths — a 14% increase from 2020. These deaths were all preventable. [1]
In 2019 alone, there were 15,000 injuries and 186 fatalities attributed to street racing. [4]
Daily: Every day, on average, 4 Canadians are killed and 175 are injured in impairment-related crashes. Annually: We estimate between 1,250 and 1,500 people are killed and more than 63,000 are injured each year in Canada in impairment-related crashes. [2]
In 2020, the total estimated annual cost of fatalities from accidents involving drivers impaired by alcohol was approximately $123.3 billion. This figure encompasses both medical expenses and the estimated costs associated with the loss of life. Of those killed in such accidents, 62% were the impaired drivers themselves, while 38% included passengers in the impaired drivers' vehicles, occupants of other vehicles, or non-occupants like pedestrians. Additionally, 229 children aged 0–14 years lost their lives in accidents involving alcohol-impaired drivers, accounting for 21% of all traffic-related fatalities within this age group for that year. [3]
And these are just the statistics from the US and Canada alone.
The prevention and reactionary methods for impaired driving and street racing just aren't cutting it. Along with the impact on families and loved ones, the financial burden on the economy, and the increasing risk on law enforcement, we decided to create a solution that aims to tackle the problem when it appears.
What it does
From municipal and law enforcement cameras, we’re able to gather live footage or recordings and determine driving patterns based on the linearity of the movement of cars. Through this, a computer-vision model can determine if someone is swerving too much, to alert law enforcement. This solution enables law enforcement to review the footage as alerts are sent to a heads-up display (HUD) which is our front-end, in real time, enabling them to quickly determine a course of action. If you’re curious or want to learn more about our project, check out the GitHub and follow the instructions to upload your own video and try it out! Some of us will also be continuing to update the project and take it our own direction so follow along!
How we built it
We began with an idea: we wanted to use publicly accessible data to detect impaired drivers with the goal of keeping them off the road. We mapped out the requirements for our model and started looking into methods to detect cars, settling on YOLOv8, a series of lightweight computer vision models with tracking capabilities. We initialized one model, yolov8n, and used OpenCV to run through each frame of an uploaded video. For each frame, we ran inference to obtain bounding boxes for images on the screen. Next, we looked at ways to track the motion of detected cars; luckily, object tracking only required a few small changes to initialize detection history and point generation. We stored the “movement” of each detected car in a dictionary for later use. At this point, we made the observation that on any straight road (such as a highway), a higher-than-street-level view of the cars would yield linear paths for straight-moving objects. Hence, to gauge the linearity of each car, we settled on a linear regression that calculates the mean-squared error. Above a certain threshold established through our research and testing, the error would indicate anomalous/impaired driving (i.e. a non-linear, swerving path).
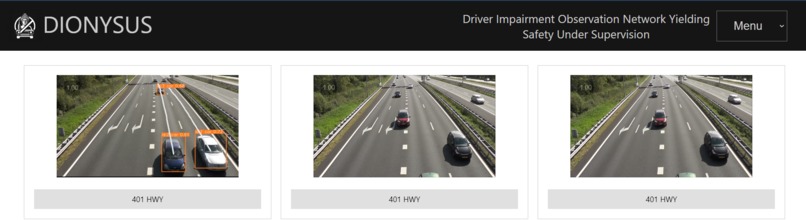
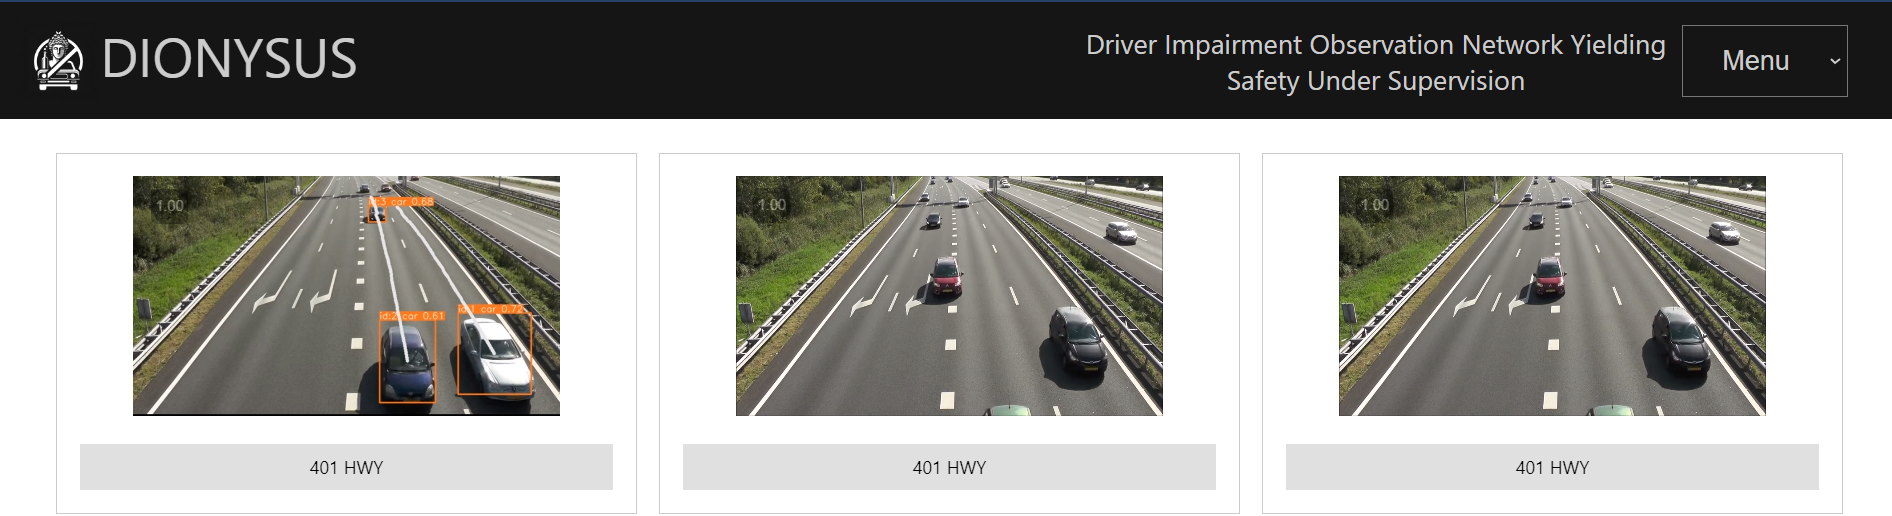
For our user interface, we used React as our front-end to display all the different cameras that would be using DIONYSUS. Each display when clicked, would expand and provide a larger view of the camera angle. Next to the video feed is the linear regression plot with analysis describing potential unsafe drivers. For example, white car1 (which would be labeled on the video) has a mean-squared error 1000, potential unsafe driving detected.
Challenges we ran into
One challenge we ran into was the lack of footage of unsafe driving from an aerial perspective. While there were many examples of dashcam footage, the data extracted from them yielded poor results as the images yielded viewing angles of only one dimension, or had a moving reference frame. This led to the use of highway cameras and helicopter shots as our primary data sources to allow for two-dimension imaging. These video clips were uncommon and had other noise factors such as camera shake or minor cases of unsafe driving. To generate the data of unsafe driving, we turned to the game Rocket League to simulate swerving and applied the footage to our existing model which was able to detect unsafe driving.
Another challenge was figuring out which statistical analysis to apply to determine unsafe driving. The team went with a regression model analysis where plotted points from the cars would be compared to a line of best fit. The mean squared value was used as a metric to determine how much of the data was not on the line of best fit. While the regression model fit the scope of the project, with more time, a more thorough model such as the Fast-Fourier Transform would be applied as a general noise-detection model.
Accomplishments that we're proud of
- For 3 members of our team, this was their first hackathon! It was a great learning experience to implement classroom learnings and previous project experiences into a fast-paced project with real world application such as this one!
- Editing the model and customizing to our own liking was quite difficult but allows us to serve a purpose impacting so many.
- Instead of just using javascript, we challenged ourselves to incorporate a full-stack application using react instead and it worked out pretty well, but more importantly, we learned a ton.
- We did a lot of research to back up our initial hypothesis to build a product with a wide reaching audience and global impact
Additional Information
Some additional information which influenced our decision in creating this project backed by statistics.
Dangers of Drunk Driving:
- Every day, about 37 people in the United States die in drunk-driving crashes — that's one person every 39 minutes. In 2021, 13,384 people died in alcohol-impaired driving traffic deaths — a 14% increase from 2020. These deaths were all preventable. [1]
- Daily: Every day, on average, 4 Canadians are killed and 175 are injured in impairment-related crashes.
- Annually: We estimate between 1,250 and 1,500 people are killed and more than 63,000 are injured each year in Canada in impairment-related crashes. [2]
- In 2020, the total estimated annual cost of fatalities from accidents involving drivers impaired by alcohol was approximately $123.3 billion. This figure encompasses both medical expenses and the estimated costs associated with the loss of life. Of those killed in such accidents, 62% were the impaired drivers themselves, while 38% included passengers in the impaired drivers' vehicles, occupants of other vehicles, or non-occupants like pedestrians. Additionally, 229 children aged 0–14 years lost their lives in accidents involving alcohol-impaired drivers, accounting for 21% of all traffic-related fatalities within this age group for that year. [3]
- The number of fatalities involving drivers impaired by drugs other than alcohol each year remains uncertain due to limitations in data collection. Nonetheless, certain studies have evaluated the presence of alcohol and drugs in drivers involved in serious accidents. For instance, a study conducted across seven trauma centers on 4,243 drivers who sustained severe injuries in crashes between September 2019 and July 2021 revealed that 54% tested positive for alcohol and/or drugs.
- Among these, 22% were found to have alcohol in their system, 25% tested positive for marijuana, 9% for opioids, 10% for stimulants, and 8% for sedatives. [3]
- About 1 million arrests are made in the United States each year for driving under the influence of alcohol and/or drugs.13,14 However, results from national self-report surveys show that these arrests represent only a small portion of the times impaired drivers are on the road. -The 2020 National Survey on Drug Use and Health (NSDUH) revealed that among U.S. residents aged 16 and older, the following numbers reported driving under the influence over the past year:
- 18.5 million for alcohol, which represents 7.2% of the age group.
- 11.7 million for marijuana, accounting for 4.5% of the age group.
- 2.4 million for other illicit drugs, making up 0.9% of the age group.
Additionally, the Behavioral Risk Factor Surveillance System reported that in 2020, 1.2% of adults admitted to driving when they had consumed too much alcohol within the last 30 days. This behavior led to an estimated 127 million instances of alcohol-impaired driving among U.S. adults. [3]
In 2019 alone, there were 15,000 injuries and 186 fatalities attributed to street racing. Here are some additional statistics related to street racing in the United States [4]:
The average age of street racing participants is between 18 and 24 years old [4].
49% of high-collision accidents occur on urban roads.
31% of all street racing accidents result in fatalities.
Over 90% of street racing accidents involve male drivers. Current Methods used to prevent street racing and drunk driving: Increased Patrols: Police departments may increase patrols in areas known for street racing to discourage the activity and catch those who engage in it. Undercover Operations: Police may use unmarked vehicles to blend in with traffic and catch street racers in the act. Traffic Stops: Officers may pull over drivers suspected of street racing or other traffic violations and issue citations or make arrests. Helicopter Surveillance: Police helicopters can provide an aerial view of street racing activity and assist ground units in apprehending offenders. Sting Operations: Police may set up sting operations, posing as street racers, to catch those who are participating in illegal races. Electronic Monitoring: Police may use radar guns, speed cameras, or other technology to monitor speeds and catch street racers in the act. Community Involvement: Police may work with community members to report suspicious activity and gather information on illegal street racing. [4] Target Market: The target market for DIONYSYS are government services. More specifically, law enforcement. This tool will allow the government to tackle impaired driving and street racing from a reactive approach. A report from the World Health Organization has found that road traffic accidents impose an economic burden, costing most nations approximately 3% of their GDP [5]. According to the latest research study, the demand of global Driver Monitoring System Market size & share was valued at approximately USD 1.9 Billion in 2022 and is expected to reach USD 2.23 Billion in 2023 and is expected to reach a value of around USD 5.27 Billion by 2032, at a compound annual growth rate (CAGR) of about 11.3% during the forecast period 2023 to 2032. [6]
[1] “Drunk Driving | NHTSA.” Accessed: Feb. 03, 2024. [Online]. Available: https://www.nhtsa.gov/risky-driving/drunk-driving [2] “Impaired Driving Statistics – MADD Parkland.” Accessed: Feb. 03, 2024. [Online]. Available: https://maddchapters.ca/parkland/about-us/impaired-driving-statistics/ [3] “Impaired Driving: Get the Facts | Transportation Safety | Injury Center | CDC.” Accessed: Feb. 03, 2024. [Online]. Available: https://www.cdc.gov/transportationsafety/impaired_driving/impaired-drv_factsheet.html [4] “Street Racing Accidents: Risks, Statistics, and Prevention - California Times Journal.” Accessed: Feb. 03, 2024. [Online]. Available: https://californiatimesjournal.com/street-racing-accidents-risks-statistics-and-prevention/ [5] “Driver Monitoring Systems Market Size, Share, Trend Analysis 2024-2033.” Accessed: Feb. 03, 2024. [Online]. Available: https://www.thebusinessresearchcompany.com/report/driver-monitoring-systems-global-market-report [6] C. M. R. P. LIMITED, “[Latest] Global Driver Monitoring System Market Size/Share Worth USD 5.27 Billion by 2032 at a 11.3% CAGR: Custom Market Insights (Analysis, Outlook, Leaders, Report, Trends, Forecast, Segmentation, Growth, Growth Rate, Value),” GlobeNewswire News Room. Accessed: Feb. 03, 2024. [Online]. Available: https://www.globenewswire.com/en/news-release/2023/10/31/2770703/0/en/Latest-Global-Driver-Monitoring-System-Market-Size-Share-Worth-USD-5-27-Billion-by-2032-at-a-11-3-CAGR-Custom-Market-Insights-Analysis-Outlook-Leaders-Report-Trends-Forecast-Segmen.html
What we learned
The key takeaways from QHacks were learning how to apply math and statistics to AI models and apply it to world problems. The lessons that we learned were to effectively communicate with our team on dividing up roles and responsibilities. For example, our team had two members working on AI and the other two working on research and front-end. This allowed us to finish our model and user interface within the giving time and allowed us to gain experience in software that we have not mastered yet. Overall, some of us went more in-depth with the math and statistics while some of us honed our design skills.
What's next for DIONYSUS
We’d like to integrate a database to potentially store footage and be able to recognize patterns to improve analysis. This would also allow us to refine the model and ensure a higher degree of accuracy for law enforcement. We ran out of time to use Flask to connect the model directly to our React front end fully, so we’d like to finish that. We’d also like to implement detection which enables to cameras to identify vehicle make and model. This would enable law enforcement to follow the path of a suspected impaired/dangerous driver. A large step ahead is implementing the capability of speed analysis in coordination with the straight line test and Fourier analysis. We also can look into securing government contracts for monetization and implementation!
If you’re curious or want to learn more about our project, check out the github below and follow the instructions to upload your own video and try it out! Some of us will also be continuing to update the project and take it our own direction so follow along!

Log in or sign up for Devpost to join the conversation.